Cashew nuts (Anacardium occidentale L.)
decrease visceral fat, yet augment glucose in
dyslipidemic rats
Celina C. Q. DiasID1*, Marta S. Madruga1☯, Maria Manuela E. Pintado2☯, Gabriel Henrique Oliveira Almeida3‡, Ana Paula Vilar Alves4‡, Francileide Amaro Dantas4‡, Je´ssyka Kallyne Galvão Bezerra4‡, Marı´lia Ferreira Frazão Tavares de Melo4☯, Vanessa Bordin Viera4, Juliana Ke´ssia B. Soares4
1 DEA—Department of Food Engineering, Technology Centre, Federal University of Paraiba, João Pessoa, Paraiba, Brazil, 2 Universidade Cato´lica Portuguesa, CBQF—Centro de Biotecnologia e Quı´mica Fina– Laborato´ rio Associado, Escola Superior de Biotecnologia, Porto, Portugal, 3 Animal Science Departament, Federal University of Paraiba, Areia, Paraiba, Brazil, 4 Department of Nutrition, Center of Education and Health, Federal University of Campina Grande, Cuite´, Paraı´ba, Brazil
☯These authors contributed equally to this work. ‡ These authors also contributed equally to this work. *[email protected]
Abstract
The objective of this study was to evaluate the biological effects of roasted Cashew nuts consumption on biochemical and murinometric parameters in dyslipidemic rats receiving lipid supplementation. Young male rats were randomly assigned to three experimental groups (n = 10). The Control group (CONT) was treated with water, the Dyslipidemic group (DL) received a high fat content emulsion throughout the experiment, and the Dyslipidemic Cashew Nuts group (DLCN) received the same high fat content emulsion throughout the experiment, yet was treated with Cashew nuts. Body parameters, biochemical, hepatic and fecal fatty acid profiles were all evaluated. The levels of total cholesterol and triglycerides were higher in the DL and DLCN groups as compared to the control group. DLCN and CONT presented no difference in HDL levels. DLCN presented higher glycemia levels than the other groups. There was reduction of body fat in DLCN as compared to other groups, but with higher accumulations of liver fat. DLCN presented a reduction in saturated hepatic fatty acids of 20.8%, and an increase of 177% in relation to CONT; there was also a 21% in increase DL forω9 fatty acids in comparison to CONT. As for fecal fatty acids, there was a lower concentration of polysaturates in DLCN as compared to the other groups. The data showed that the consumption of Cashew nuts by the dyslipidemic animals treated with a hyperlipidic diet induced greater accumulations of liver fat and worsened glycemic levels, despite having reduced visceral fats and increased fecal fat excretion.
a1111111111 a1111111111 a1111111111 a1111111111 a1111111111 OPEN ACCESS
Citation: Dias CCQ, Madruga MS, Pintado MME,
Almeida GHO, Alves APV, Dantas FA, et al. (2019) Cashew nuts (Anacardium occidentale L.) decrease visceral fat, yet augment glucose in dyslipidemic rats. PLoS ONE 14(12): e0225736.https://doi.org/ 10.1371/journal.pone.0225736
Editor: Juan J. Loor, University of Illinois, UNITED
STATES
Received: June 22, 2019 Accepted: November 11, 2019 Published: December 12, 2019
Copyright:© 2019 Dias et al. This is an open access article distributed under the terms of the
Creative Commons Attribution License, which permits unrestricted use, distribution, and reproduction in any medium, provided the original author and source are credited.
Data Availability Statement: All relevant data are
within the manuscript and its Supporting Information files.
Funding: This research was supported by the
grants from the Coordination for the Improvement of Higher Education Personnel – CAPES, Brazil to CCQD.
Competing interests: The authors have declared
Introduction
Oleaginous consumption in the population has increased considerably in recent years with worldwide growth estimated at 59% for the consumption of seed oils during the last decade. The most popular oleaginous nuts are Almonds (Prunus amigdalis), Hazelnuts (Corylus avel-lana), Pecans (Juglans regia), Brazil nuts (Bertholletia excelsa), Cashews (Anacardium occiden-tale), Pistachios (Pistachia vera), Pine nuts (Pinus pinea) and Macadamia nuts (Macadam integrifolia) [1].
Studies have evidenced the benefit of seed oils for human health [1], in particular the cho-lesterol-lowering effect [2], as well as cardioprotective effects of almonds [3], and reduction of inflammatory markers promoted by consumption of nuts in general [4]. Maternal consump-tion of Cashew nuts in rats has been investigated for causing alteraconsump-tions in offspring develop-ment [5], from acceleration of nervous system maturation, to prevention memory deficits. However, there are still few studies investigating the biological effects of Cashew nut seed oil in non-healthy populations.
Cashews are the fruit of the cashew tree (Anacardium occidentale), which when dried or
roasted, originate Cashew nuts (also known as Cashews). Cashews are a tropical fruit native to northeastern Brazil, produced in large scale in India and Vietnam [6,7] with global production from 2015 to 2016 reaching 738,861 tons [8]. Statistical data show a 70% increase in Cashew nut exports originating in these countries. The USA is the principal importer, but the popula-tion with the highest per capita consumppopula-tion is Cambodia [8].
Cashew nuts are consumed in their natural or roasted form, or converted into food by-products [7]. Having a soft and slightly sweet flavor, they stand out for high lipid content (47.8 g/100g) as source of unsaturated fatty acids (UFAs)—oleic (ω-9) and linoleic (ω-6) acid [9,5]. Other functional properties of the seed oil are due to its phenolic contents (flavonoids, antho-cyanins and tannins), and fiber [10]. The most valuable micronutrients found in cashews are folate and tocopherols [11], which delay metabolic disorders, protecting against atherosclerosis and other chronic non-communicable diseases (CNCD) [12].
Cardiovascular disease is the most prevalent of CNCDs and responsible for almost 1/3 of deaths worldwide. The main risk factors for CNCDs are obesity, smoking, hypertension and dyslipidemias [13]. Adequate food habits are essential to control dyslipidemia; both fiber and unsaturated fatty acids help control dyslipidemia. Cashew nuts is a source of fiber and UFAs could be a food that helps control dyslipidemia [14]. We hypothesize that consumption of cashew nuts improves dyslipidemia in rats with a hyperlipidic diet. The objective of this research was to evaluate biological effects on biochemical and murinometric parameters of consuming cashew nuts in dyslipidemic rats who did not modify the hyperlipidic diet to nor-molipidic diet.
Methods and materials
This study was approved by the UFCG Ethics Committee for Animal Use (Protocol No. 94– 2017). The experimental protocol followed the ethical recommendations of the National Insti-tute of Health Bethesda (Bethesda, USA) regarding animal care (Fig 1). The research was duly registered in the National System of Management of Genetic Heritage and Traditional Knowl-edge (SISGEN), under Code A1BE84C.
Plant material (cashew nuts)
Roasted cashew nuts were acquired in a local store in the city of Cuite´, located in the Curima-tau´ region of Paraı´ba. For better administration of the Cashew nuts to the animals, the Cashew nuts were crushed to flour. For this, the Cashew nuts were chilled to (± 4˚C) to avoid
temperature increases during processing; and loss of nutritional properties. A household blender was used to obtain the homogeneous flour which was then stored under refrigeration in a hermetically sealed container and unexposed to luminosity throughout the experiment.
Nutritional characterization of the cachew nuts
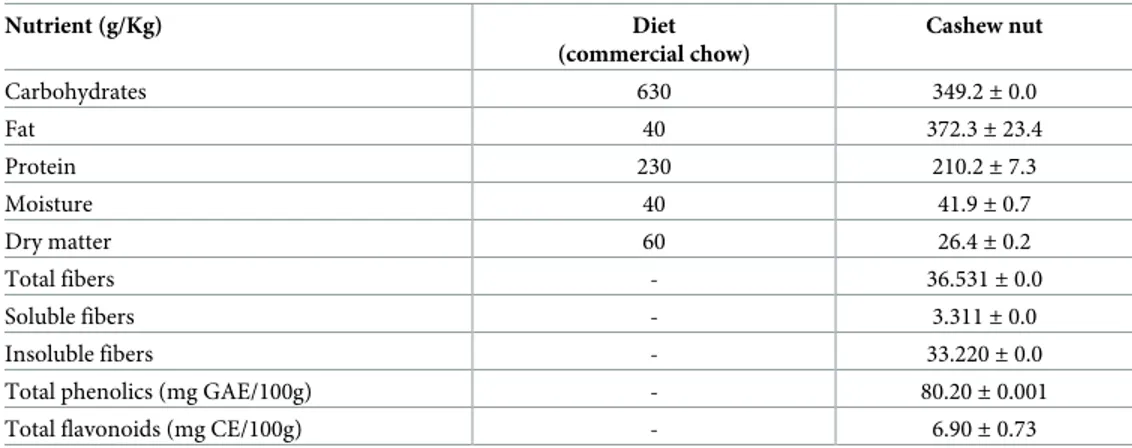
Cashew nut flour was subjected to analysis to characterize its centesimal composition, fiber quantification, phenolic contents and total flavonoids (Table 1), as also analysis of phenolic compounds by High-performance liquid chromatography (HPLC) (Table 2). For centesimal composition; moisture, ash, lipids and proteins [15] were analyzed. Calculation of the total car-bohydrate content was estimated by difference: using the AOAC formula [15]: 100-[Weight in grams (protein + lipids + ashes + water) in 100 g of food]. To quantify dietary fiber, the meth-odology described by Prosky et al. [16]. All analyses were performed in three replications and the results presented as mean and standard deviation.
For evaluation of total phenolic and total flavonoids, the Cashew nut constituents were extracted with an 80% methanol solution (v/v). One gram of Cashew nut was measured into a test tube and 10 mL of solvent was added. The test tube was left at room temperature for 24 hours and after filtration the volume was completed to 10 mL with an extraction solvent and stored in a freezer (-18˚C) until analysis. Total phenolic compounds were quantified according to the methodology described by Liu et al. [17], with modifications: 250μL of extract was
Fig 1. Experimental protocol. Sequence of time in days specifying procedures that were performed with dyslipidemic
rats fed with cashew nuts, dyslipidemic control group and normal control group. (�) Days of monitoring of body
weight and feed intake. Physical parameters, blood collection, adipose tissue and liver were performed on the same day of euthanasia.
https://doi.org/10.1371/journal.pone.0225736.g001
Table 1. Centesimal composition from the diet and cashew nut.
Nutrient (g/Kg) Diet (commercial chow) Cashew nut Carbohydrates 630 349.2± 0.0 Fat 40 372.3± 23.4 Protein 230 210.2± 7.3 Moisture 40 41.9± 0.7 Dry matter 60 26.4± 0.2 Total fibers - 36.531± 0.0 Soluble fibers - 3.311± 0.0 Insoluble fibers - 33.220± 0.0
Total phenolics (mg GAE/100g) - 80.20± 0.001
Total flavonoids (mg CE/100g) - 6.90± 0.73
mixed with 1250μL of a 1:10 diluted Folin–Ciocalteau reagent. The solutions were mixed thor-oughly and incubated at room temperature (27˚C) for 6 min. After incubation, 1000μL of 7.5% sodium carbonate (Na2CO3) solution was added and again incubated in a water bath at 50˚C for 5 min. The reaction mixtures’ absorbances were measured at 765 nm using a spectro-photometer (BEL Photonics, Piracicaba, São Paulo, Brazil). The absorbance of the extract was compared with a gallic acid standard curve for estimating concentration of total phenolic com-pounds in the sample. The results were expressed in mg of gallic acid equivalents (GAE) per hundred grams of Cashew nut on the basis of dry weight.
The total flavonoid content was measured using the colorimetric assay developed by Zhishen et al. [18]. A known volume (0.5 mL) of the extract was added to a test tube and at the same time 150μL of 5% NaNO2was added. After 5 min, 150μL of 10% AlCl3was added, and, at 6 min, 1 mL of 1 M NaOH was added, followed by 1.2 mL of distilled water. Sample absor-bance was read at 510 nm using a spectrophotometer (BEL Photonics, Piracicaba, São Paulo, Brazil), and for estimating the concentration of flavonoid contents in the sample, it was com-pared with a catechin standard curve. The flavonoids content was expressed as mg of catechin equivalents (QE) per hundred grams of Cashew nut on the basis of dry weight.
The extraction, identification and quantification of phenolic acids from the cashew nuts were performed according to Meireles (19). For this, the milled sample was degreased with chloroform and methanol, ethanol 70% was added in proportion sample:solvent 1:10, stirred for 4h at 200 rpm under temperature control (26˚ C), centrifuged for 15 minutes at 5000 rpm. Then it was vacuum filtered with Buchner funnel. The extract was dried in a circulating air oven and eluted in water at a concentration of 5mg/mL and then injected into HPLC following the methodology mentioned [19].
Animals and diets
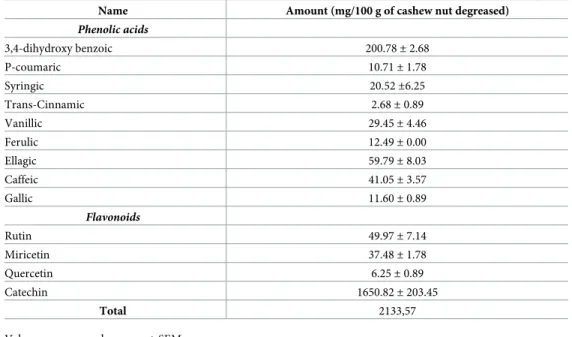
Seven-week-old Wistar rats were randomly separated into three experimental groups (n = 10). Throughout the experiment all the animals were offered access (ad libitum) to water and Table 2. Profile of phenolic components by HPLC present in cashew nuts.
Name Amount (mg/100 g of cashew nut degreased)
Phenolic acids 3,4-dihydroxy benzoic 200.78± 2.68 P-coumaric 10.71± 1.78 Syringic 20.52±6.25 Trans-Cinnamic 2.68± 0.89 Vanillic 29.45± 4.46 Ferulic 12.49± 0.00 Ellagic 59.79± 8.03 Caffeic 41.05± 3.57 Gallic 11.60± 0.89 Flavonoids Rutin 49.97± 7.14 Miricetin 37.48± 1.78 Quercetin 6.25± 0.89 Catechin 1650.82± 203.45 Total 2133,57
Values are expressed as mean± SEM.
commercial chow (Presence Purina 1), being housed individually in metabolic cages, in rooms with a 12 hours light/dark cycle, light phase starting at 6:00 a.m., with environmental tempera-ture from 22 to 25˚C, and relative humidity of± 65%. The experimental groups formed were: the control group (CONT), receiving water by gavage; the Dyslipidemic Group (DL), receiving emulsion with high lipid content by gavage; and the Dyslipidemic Cashew Nut Group (DLCN), receiving an emulsion with high lipid content and Cashew nut flour by gavage.
The animals of the DL and DLCN groups underwent induction of dyslipidemia through administration of a lipid emulsion during the initial 14 days of the experiment, in the amount of 1 mL/100 g of the animal’s weight, according to the methodology described by Xu et al. [20]. The emulsion contained pork lard, cholesterol, glycerol, propylthioracyl, and distilled water. After the initial 14 days, the formulation of the lipid emulsion was altered by removing the propylthioracyl and reducing the total quantity by half to 0.5 mL/100 g. Administrations continued to the DL and DLCN groups until the end of the experiment. Together with the lipid emulsion, the DLCN group animals received 1 g (4 g/kg of animal weight) of Cashew nut flour for 28 days.
Physical parameters
Weight and feed intake verifications were performed weekly. The calorie intake was calculated from feed, emulsion with high lipid content intake and cachew nuts intake. At the end of the experiment, with the animal anesthetized, the nasal-anal length, and the abdominal and tho-racic circumferences were measured by measuring tape. The body mass index (BMI) of the animals was calculated from the body weight (p) and nasal-anal length (c) data using the for-mula: BMI = p/c2, being weight (p) in grams, and length (c) in centimeters [21].
Biochemical parameters
At the end of the experiment, the blood samples were obtained after cardiac puncture with the animals anesthetized using ketamine hydrochloride + xilasine hydrochloride (1 mL/kg of weight). Plasma was collected by centrifugation of the blood at 3,500 rpm for 15 min. The plasma was used to quantify total cholesterol (TC), HDL, triglycerides (TG) and blood glucose using the enzyme kit (LABTEST), with later spectrophotometer reading (Spectrophotometer SP 1102).
Oral glucose tolerance test
The oral glucose tolerance test (OGTT) was performed at the end of the experiment on the 41st experimental day. The animals at 6 hours of fasting received a 10% sucrose solution at 2 mL/ 100 g of weight. Blood was collected through the caudal vein. Glycemia was verified using an AccuCheck Active glucometer (Roche Diagnostics GmbH, Germany) at 0, 15, 30 and 45 min-utes after administration of the solution.
The glucose area under the curve (AUC) were calculated as follows:
AUC mg h=dLð Þ ¼PG ð0Þ þ PG ð15Þ x 2 þ PG ð30Þ x 3 þ PG ð45Þ x 2 4
Where, PG is plasma glucose.
Visceral, retroperitoneal and hepatic fats
Shortly after euthanasia, the visceral (mesenteric and epididymal) and retroperitoneal fats were removed and weighed [22]. The liver was removed, weighed and subjected to fat
quantification by means of the methodology described by Folch et al. [23], and beginning from a 2 g lipid extraction of the sample using 40 mL of a chloroform: methanol (2:1) solution.
Fecal fat
The feces of the animals were collected in two periods of the study. The first collection took place at the end of dyslipidemia induction on the 14thexperimental day, and the second was performed at the end of the third week of treatment—on the 35thexperimental day. The Folch et al. [23] methodology was used for fecal fat quantification.
Hepatic and fecal fatty acids
Parts of the liver and feces samples from the animals were used for fatty acid quantification. Methylation of the fatty acids present in the lipid extract was carried out for both, following the methodology described by Hartman and Lago [24]. An aliquot of the lipid extract was taken, calculated for each sample according to the fat content found in the lipid measurement; and quantification was performed according to the method of Folch et al. [23]. Adding 1 mL of internal standard (C19:0) and a saponification (KOH) solution, the solution was subse-quently heated under reflux for 4 min. An esterification solution was then added immediately afterwards, returning the solution to heating under reflux for 3 extra minutes. The sample was then allowed to cool before subsequent washings with ether, hexane, and distilled water; finally obtaining an extract (with the methyl esters and solvents), which was conditioned into a prop-erly identified amber glass until complete drying of the solvents. After drying, a suspension was made (in 1 mL of hexane) and packaged into a vial for further chromatographic analysis. The aliquots of the saponification and esterification solutions were determined according to the methodology described by Hartman and Lago [24].
A gas chromatograph (VARIAN 430-GC, California, USA), coupled to a fused silica capil-lary column (CP WAX 52 CB, VARIAN, California, USA) with dimensions of 60 m x 0.25 mm, and a 0.25 mm film thickness was used with helium as the carrier gas (1 mL/min flow rate). The initial temperature was 100˚C programmed to reach 240˚C, increasing 2.5˚C per minute for 30 min, totaling 86 minutes. The injector temperature was maintained at 250˚C and the detector at 260˚C. 1.0μL aliquots of esterified extract were injected in a Split/Splitless injector. The chromatograms were recorded usingGalaxie Chromatography Data System soft-ware. Fatty acids were identified by comparing the retention times for the methyl esters of the
samples against Supelco Mix C4-24/C19 standards. The fatty acid results were quantified by normalizing the areas of the methyl esters, and are expressed as percentage of area.
Statistical analysis
The Cashew nuts flour composition result was described as mean± S.D. All other results were expressed as mean± S.E.M. The statistical analysis of the data was based on one-way ANOVA followed by a Tukey’s test. Differences were considered significant when p < 0.05. The statisti-cal analyses were performed using the GraphPad Prism 7 statististatisti-cal software.
Results
Phenolic compounds
The identification and quantification by HPLC of cashew nut phenolic components is shown inTable 2. Thirteen phenolic compounds were identified among phenolic acids and flavo-noids. The highest concentrations were found in 3,4-dihydroxy benzoic acids (200.78± 2.68), Ellagic acid (59.79± 8.03) and catechin (1650.82 ± 203.45).
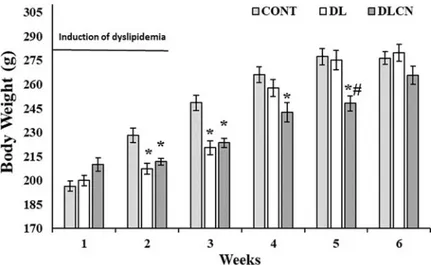
Body weight
As for the weekly weight of the animals in the respective second and third weeks of the experi-ment, it was found that the groups undergoing the dyslipidemic induction and treatment tran-sitions (DL 207.5± 3.44 g; 220.5 ± 4.31 g) and (DLCN 211.75 g ± 2.02; 223.6 ± 2.87 g)
presented lower weights in relation to the control group (CONT 228.2± 4.61 g; 248.6 ± 4.73 g) (P < 0.05). In the fourth week, the reduction in weight continued only for the DLCN
(242.6± 5.89 g) in relation to the CONT (266.0 ± 4.88 g), and in the fifth week, the DLCN (248.2± 4.75 g) also presented lower weights as compared to the other two experimental groups, CONT (277.3± 5.12 g), and DL (275.14 ± 6.05 g) (P < 0.05) (Fig 2).
Food and calories intake
During dyslipidemia induction, the DL (121.0± 3.65 g; 102.3 ± 2.35 g) and DLCN (122.0 ± 5.67 g; 99.12± 3.44 g) groups consumed less ration as compared to CONT (139.7 ± 2.45 g; 162.0± 3.20 g) (P < 0.05). In the third and fourth week the DL group (124.8 ± 6.06 G; 130.0± 3.18 g) consumed even less ration as compared to CONT (160.0 ± 2.73 G; 162.2 ± 2.65 g). In the fourth week of the experiment the DLCN (110.2± 4.26 g) also presented lower feed intake in relation to CONT (162.2± 2.65 g), and in the other weeks consumed less ration than the other groups as well (P < 0.05) (Fig 3).
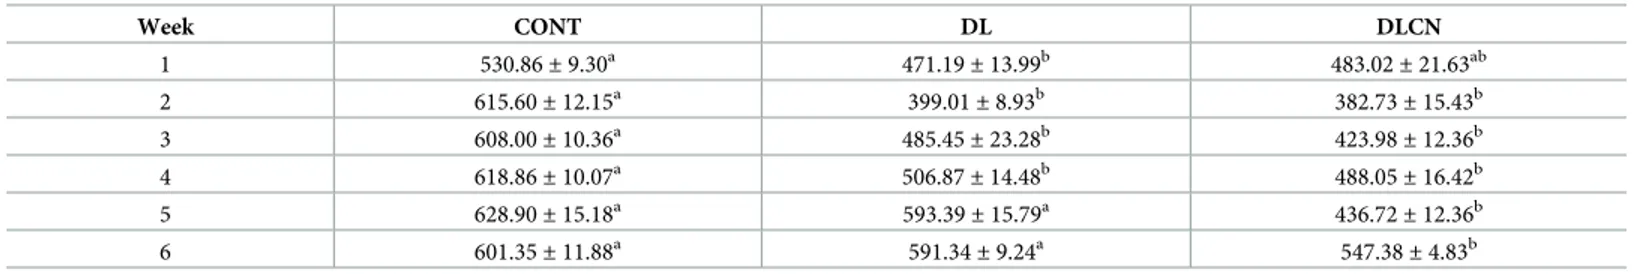
The caloric intake presented inTable 3shows that CONT consumed more calories from the high feed intake compared to the other groups in the first experimental weeks. In the last two experimental weeks, DLCN consumed fewer calories compared to the other groups.
BMI, abdominal and thoracic circumferences
InTable 4, the BMI, abdominal and thoracic circumference values of the experimental groups are described. No significant differences were observed between the groups (P > 0.05).
Biochemical analysis
The biochemical analyses proved the efficacy of the dyslipidemia inductions since both the DL (69.59± 4.39 mg/dl) and DLCN (122.52 ± 12.95 mg/dl) groups had high levels of total
Fig 2. Weekly body weight of rats with a hyperlipidaemic diet treated with cashew nut. Values are the
mean± SEM. Control group (CONT), Dyslipidemic group (DL), Dyslipidemic Cashew Nut group (DLCN).�versus
CONT. #versus DL. p < 0.05, as determined by One-Way ANOVA followed by the Tukey test.
cholesterol in relation to the CONT (43.72± 2.47 mg/dl) (P < 0.05). DLCN also presented higher values than DL (P < 0.05). The DL group presented higher serum triglyceride values (127.4± 12.56 mg/dl) as compared to CONT, while DLCN (81.56 ± 5.26 mg/dl) presented ele-vated triglycerides in relation to CONT (62.76± 6.24 mg/dl) and reduced triglycerides as com-pared to DL (P < 0.05).
HDL levels were similar for the group treated with Cashew nuts and the control group, but were higher in the DLCN (48.17± 3.53 mg/dl) than in the DL (29.55 ± 2.89 mg/dl) (P < 0.05). In the DL group, the HDL content was lower than in the CONT group (45.28± 5.46 mg/dl) (P < 0.05).
Regarding glycemic levels, DLCN (367.65± 12.48 mg/dl) presented higher values than the other groups (DL 311.39± 8.59 mg/dl, and CONT 251.54 ± 9.56 mg/dl). However, the DL group also presented elevated glycemia as compared to CONT (P < 0.05) (Fig 4).
Oral tolerance test for glucose (OTTG)
During OTTG, the animals of the DLCN (104.20± 2.97 mg/dl; 132.78 ± 6.05 mg/dl) and DL (114.11± 2.83 mg/dl; 135.1 ± 4.93 mg/dl) groups had higher glycemic peaks in relation to CONT (92.0± 3.18 mg/dl; 112.5 ± 3.76 mg/dl), respectively at times 0 (zero) and 45 min. At 30 min, only DL (145.11± 3.68 mg/dl) presented an increase as compared to CONT
(119.33± 5.25 mg/dl) (P < 0.05) (Fig 5A).
Fig 3. Weekly feed intake of dyslipidemic rats treated with cashew nut. Values are the mean± SEM for the following groups: Control group (CONT), Dyslipidemic group (DL), Dyslipidemic Cashew Nut group (DLCN).�
versus CONT. # versus DL. p < 0.05, as determined by One-Way ANOVA followed by the Tukey test.
https://doi.org/10.1371/journal.pone.0225736.g003
Table 3. Calorie intake (Kcal) of dyslipidemic rats treated with cashew nuts.
Week CONT DL DLCN 1 530.86± 9.30a 471.19 ± 13.99b 483.02 ± 21.63ab 2 615.60± 12.15a 399.01± 8.93b 382.73± 15.43b 3 608.00± 10.36a 485.45 ± 23.28b 423.98 ± 12.36b 4 618.86± 10.07a 506.87 ± 14.48b 488.05 ± 16.42b 5 628.90± 15.18a 593.39 ± 15.79a 436.72 ± 12.36b 6 601.35± 11.88a 591.34± 9.24a 547.38± 4.83b
Values are expressed as mean± SEM. Different letters in the same row differ significantly (p < 0.05) between the samples.
Still analyzing theFig 5, we can follow the OTTG results through the glucose area over the curve (Fig 5B), showing higher glucose levels for the DL group (926.99 mg h/dL), followed by the DLCN (866.91 mg h/dL) compared to CONT (771.04 mg h/dL).
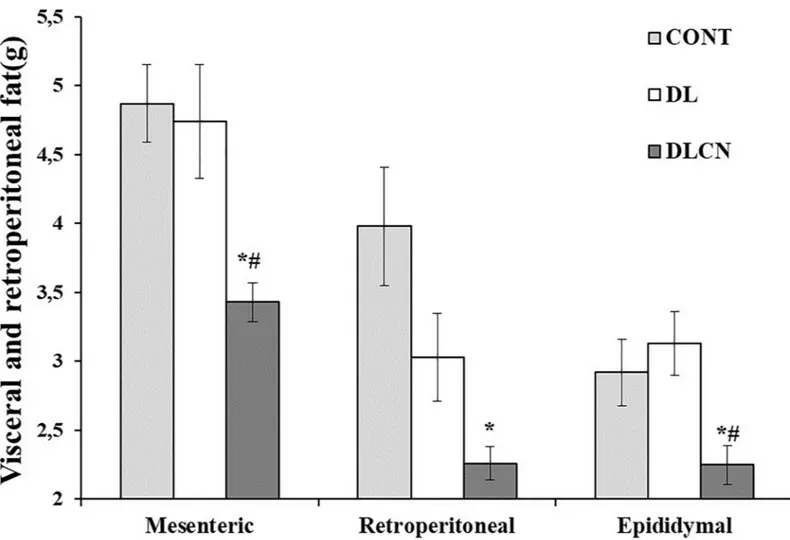
Visceral, retroperitoneal and hepatic fats
The measurements of visceral fats showed that DLCN accumulated less mesenteric and epidid-ymal fat respectively (3.43± 0.14 g; 2.25 ± 0.14 g) in relation to the other groups (CONT 4.87± 0.28 g; 2.92 ± 0.24 g and DL 4.74 ± 0.41 g; 3.13 ± 0.23 g), and in the retroperitoneal space (2.26± 0.12 g) when compared to CONT (3.98 ± 0.43 g) (P < 0.05) (Fig 6). The liver weight differed between the DLCN (10.33± 0.32 g) and DL (10.95 ± 0.58 g) groups as com-pared to the CONT (9.2± 0.17 g) (P < 0.05) (Fig 7).
The quantification of liver fat showed that the DLCN (8.55± 0.57 g/100g) accumulated more fat than the CONT (4.36± 0.12 g/100g) and DL (6.45 ± 0.22 g/100g) groups (P < 0.05). However, the DL group accumulated a higher hepatic fat content than the CONT group (Fig 7).
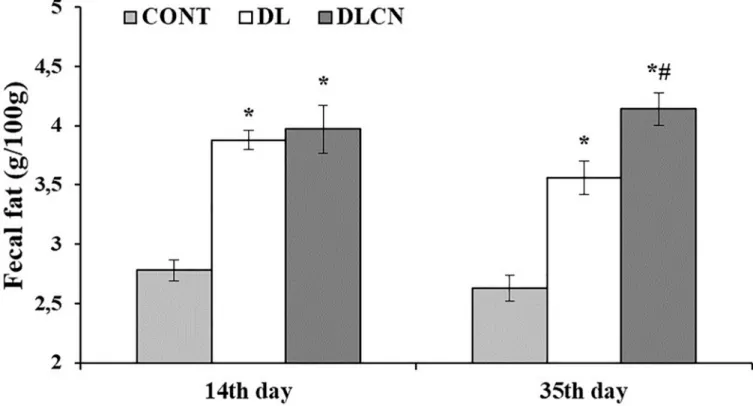
Fecal fat
The fat content in the feces was higher in the DL (3.88± 0.08 g/100g; 3.56 ± 0.14 g/100g) and DLCN (3.97± 0.20 g/100g; 4.14 ± 0.14 g/100g) groups in relation to CONT (2.78 ± 0.09 g/100g; 2.63± 0.11 g/100g) for all collections. However, in the second collection, the DLCN group (4.14± 0.14 g/100g) excreted more fat compared to the other groups (DL 3.56 ± 0.14 g/100g) and CONT (2.63± 0.11 g/100g), as illustrated inFig 8.
Table 4. Physical parameters of dyslipidemic rats treated with cashew nuts.
Parameters CONT DL DLCN P value
Body mass index (g/cm2) 0.527
± 0.02 0.575± 0.01 0.568± 0.02 0.154
Abdominal circumference (cm) 17.49± 0.25 17.2± 0.39 16.45± 0.28 0.060
Thoracic circumference (cm) 15.72± 0.29 15.05± 0.47 14.72± 0.27 0.150
Values are expressed as mean± SEM.
https://doi.org/10.1371/journal.pone.0225736.t004
Fig 4. Biochemical values (mean± SEM) of dyslipidemic rats fed cashew nut. CONT = Control group,
DL = Dyslipidemic group, DLCN = Dyslipidemic Cashew Nut group.�versus CONT, # versus DL; For all groups,
p < 0.05 was considered a significant difference as determined by One-Way ANOVA followed by the Tukey test.
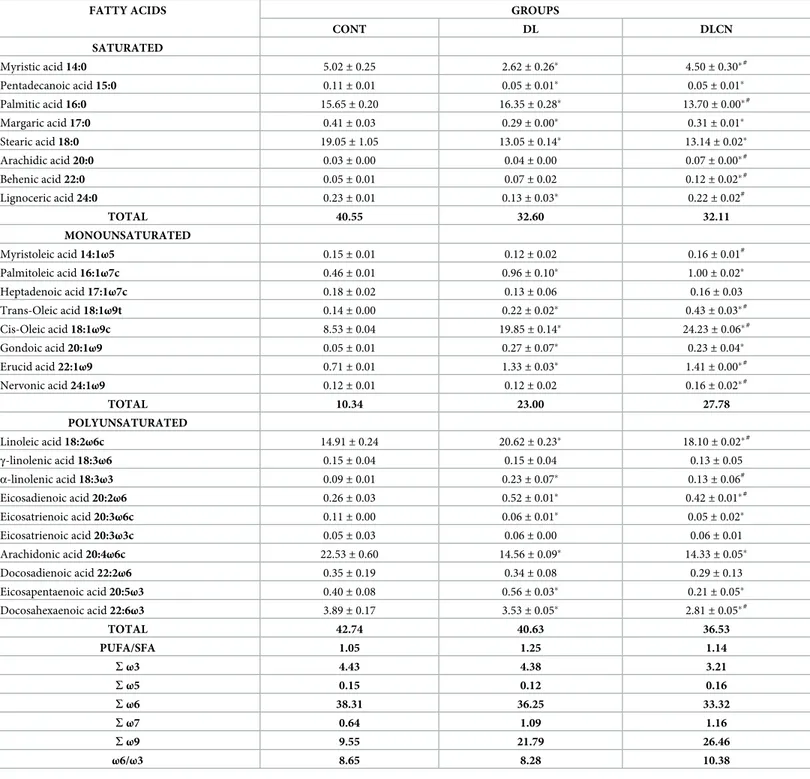
Hepatic and fecal fatty acids
Regarding saturated fatty acids (SFA) present in the liver (Table 5), the DLCN group presented an increase in the content of Myristic acid (14:0) as compared to DL and a reduction as
Fig 5. Glycaemic curve of oral tolerance test for glucose for dyslipidaemic rats treated with cashew nut and glucose area under the curve. a) Glycaemic curve of oral tolerance test for glucose; b) glucose area under the curve (AUC).
Values are the mean± SEM. Groups: CONT = Control group; DL = Dyslipidemic group; DLCN = Dyslipidemic Cashew Nut group.�versus CONT. p < 0.05, as determined by One-Way ANOVA followed by the Tukey test.
https://doi.org/10.1371/journal.pone.0225736.g005
Fig 6. Weight of visceral fat (mesenteric and epididymal) and retroperitoneal of dyslipidaemic rats fed cashew nut. Values are the mean± SEM. Control group (CONT), Dyslipidemic group (DL), Dyslipidemic Cashew Nut group (DLCN).�versus CONT. # versus DL. p < 0.05, as determined by One-Way ANOVA followed by
the Tukey test.
compared to CONT. There was a reduction of Palmitic acid (16:0) in the DLCN group com-pared to the other groups; the highest value was in the DL group. Stearic acid (18:0) resulted in similar values for DLCN and DL, with lower values than CONT. The DLCN group presented higher values of Lignoceric acid (24:0) compared to DL, but with no difference from CONT.
Fig 7. Liver fatty and liver weight of dyslipidaemic animals fed cashew nut for four weeks. Values expressed as the
mean± SEM. The groups were Control group (CONT), Dyslipidemic group (DL), Dyslipidemic Cashew Nut group (DLCN).�versus CONT. # versus DL. p < 0.05, as determined by One-Way ANOVA followed by the Tukey test.
https://doi.org/10.1371/journal.pone.0225736.g007
Fig 8. Fecal fat of rats treated with a high-fat diet with cashew nut. Rats were divided into the following groups: Control group (CONT), Dyslipidaemic
group (DL) and Dyslipidemic Cashew Nut group (DLCN). The first collection occurred at 14thday of the experiment and the second collection at 35thday of
experiment.�versus CONT. # versus DL, with p < 0.05, determined by One-Way ANOVA followed by the Tukey test, where values are expressed as the
mean± SEM.
In total values of accumulated SFA in the hepatic tissue, the DLCN group presented a reduc-tion of 20.8% as compared to the CONT group, and of 1.5% as compared to the DL group.
Table 5. Composition of fatty acids (%) present in the liver of rats fed with cashew nuts.
FATTY ACIDS GROUPS
CONT DL DLCN SATURATED Myristic acid 14:0 5.02± 0.25 2.62± 0.26� 4.50± 0.30�# Pentadecanoic acid 15:0 0.11± 0.01 0.05± 0.01� 0.05± 0.01� Palmitic acid 16:0 15.65± 0.20 16.35± 0.28� 13.70± 0.00�# Margaric acid 17:0 0.41± 0.03 0.29± 0.00� 0.31± 0.01� Stearic acid 18:0 19.05± 1.05 13.05± 0.14� 13.14± 0.02� Arachidic acid 20:0 0.03± 0.00 0.04± 0.00 0.07± 0.00�# Behenic acid 22:0 0.05± 0.01 0.07± 0.02 0.12± 0.02�# Lignoceric acid 24:0 0.23± 0.01 0.13± 0.03� 0.22± 0.02# TOTAL 40.55 32.60 32.11 MONOUNSATURATED Myristoleic acid 14:1ω5 0.15± 0.01 0.12± 0.02 0.16± 0.01# Palmitoleic acid 16:1ω7c 0.46± 0.01 0.96± 0.10� 1.00± 0.02� Heptadenoic acid 17:1ω7c 0.18± 0.02 0.13± 0.06 0.16± 0.03 Trans-Oleic acid 18:1ω9t 0.14± 0.00 0.22± 0.02� 0.43± 0.03�# Cis-Oleic acid 18:1ω9c 8.53± 0.04 19.85± 0.14� 24.23± 0.06�# Gondoic acid 20:1ω9 0.05± 0.01 0.27± 0.07� 0.23± 0.04� Erucid acid 22:1ω9 0.71± 0.01 1.33± 0.03� 1.41± 0.00�# Nervonic acid 24:1ω9 0.12± 0.01 0.12± 0.02 0.16± 0.02�# TOTAL 10.34 23.00 27.78 POLYUNSATURATED Linoleic acid 18:2ω6c 14.91± 0.24 20.62± 0.23� 18.10± 0.02�# γ-linolenic acid 18:3ω6 0.15± 0.04 0.15± 0.04 0.13± 0.05 α-linolenic acid 18:3ω3 0.09± 0.01 0.23± 0.07� 0.13± 0.06# Eicosadienoic acid 20:2ω6 0.26± 0.03 0.52± 0.01� 0.42± 0.01�# Eicosatrienoic acid 20:3ω6c 0.11± 0.00 0.06± 0.01� 0.05± 0.02� Eicosatrienoic acid 20:3ω3c 0.05± 0.03 0.06± 0.00 0.06± 0.01 Arachidonic acid 20:4ω6c 22.53± 0.60 14.56± 0.09� 14.33± 0.05� Docosadienoic acid 22:2ω6 0.35± 0.19 0.34± 0.08 0.29± 0.13 Eicosapentaenoic acid 20:5ω3 0.40± 0.08 0.56± 0.03� 0.21± 0.05� Docosahexaenoic acid 22:6ω3 3.89± 0.17 3.53± 0.05� 2.81± 0.05�# TOTAL 42.74 40.63 36.53 PUFA/SFA 1.05 1.25 1.14 Sω3 4.43 4.38 3.21 Sω5 0.15 0.12 0.16 Sω6 38.31 36.25 33.32 Sω7 0.64 1.09 1.16 Sω9 9.55 21.79 26.46 ω6/ω3 8.65 8.28 10.38
Values are expressed as mean± SEM. CONT = Control Group; DL = Dyslipidemic Group; DLCN = Dyslipidemic Cashew Nut Group; S = sum; PUFA = Polyunsaturated Fatty Acids; SFA = Saturated Fatty Acids.
�vs CONT.
#
vs DL. Statistical test used was One-Way ANOVA followed by Tukey with level of significance (p <0.05).
As for the amount of monounsaturated fatty acids (MUFA) present in the liver, DLCN pre-sented a higher value of Myristoleic acid (14:1ω5) as compared to DL. DLCN also prepre-sented higher values of Trans-oleic acid, Cis-oleic acid, Erucid and Nervonic acids (18:1ω9t, 18:1ω9c, 22:1ω9 and 24:1ω9) in relation to the other groups. The sum of the MUFA averages showed an increase of 168% for the DLCN group in relation to the CONT group and 21% in relation to the DL group. The total content ofω-9 fatty acids was higher in the DLCN group as compared to the other groups, with an elevation of 177% in relation to CONT, and 21% in relation to LD.
The polyunsaturated fatty acid Linoleic acid (18:2ω6c) presented elevated values (by about 17% for DLCN) when compared to CONT, and a higher quantification in the DL group as compared to the other groups. Arachidonic acid (20:4ω6c) presented similar values for the DLCN and DL groups, with a reduction in the CONT group. The fatty acid Eicosapentaenoic acid (20:5ω3) presented increasing values for DLCN, CONT and DL in order. The Docosahex-aenoic acid (22:6ω3) values were lower in the DLCN group and higher in the CONT group. The total polyunsaturated fatty acids (PUFA) in the liver presented a slight percentage differ-ence between the groups, with DLCN presenting a 14.5% reduction as compared to CONT, DL presenting a 4.9% reduction as compared to CONT, and DLCN presenting a 10% reduc-tion as compared to DL.
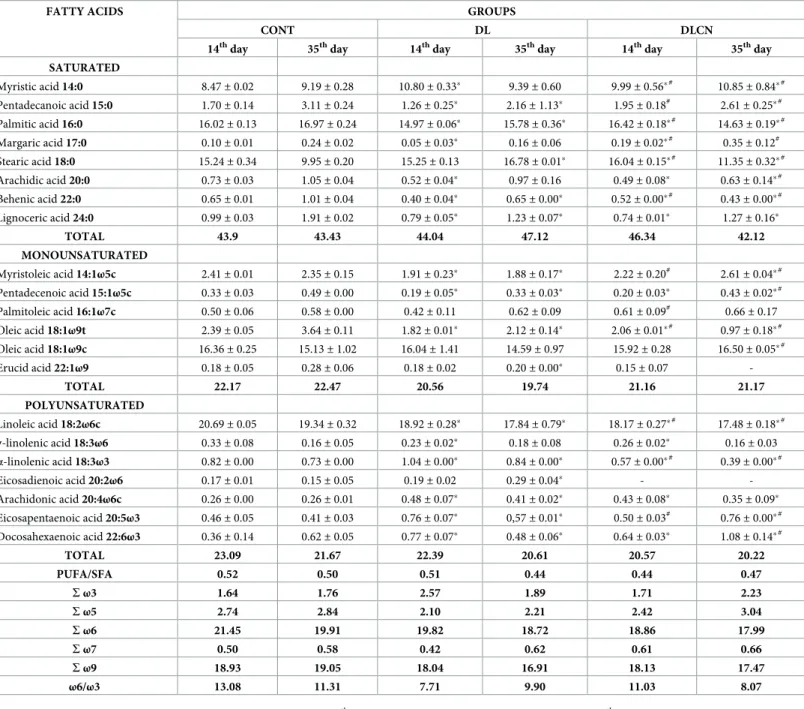
Our data show inTable 6that fecal excretion of fatty acids varied between groups in both feces collections. The data from the first collection, performed on the last day of dyslipidemia induction, show an increase in saturated fats for the groups that consumed the emulsion with high fat content. However, in the second collection there was a marked decrease in saturated fat excretion by the DLCN group as compared to the other groups, and a difference of 10.6% was observed in relation to the DL group. MUFA quantification presented similar levels between the two collections and between the groups. Regarding PUFA, there was a reduction in the second collection as compared to the first for the CONT and DL groups, but the DLCN presented lower levels of polyunsaturated fats in the feces for both the first and second collec-tions in relation to the other groups.
Discussion
Consumption of seed oils (pleasant flavors and high caloric values) is related to body weight gain [25]; but the fiber content of this food also acts on satiety, causing hypophagy, and conse-quent reduction of ingested energy [26]. Increased energy density in a diet with high lipid value, such as Cashew nut consumption with an emulsion rich in SFA and cholesterol as used in the present study also causes increased satiety [27], with consequent reductions in the appe-tites of the rats [28]. These findings justify the results of the present study in relation to the delay in weight gain and lower calories and feed intake by the groups that underwent induc-tion of dyslipidemia (Table 3, Figs2and3). However, in the DLCN animals, the result was even more evident, since the consumption of Cashew nuts caused lower calories and feed intake as compared to the other experimental groups, most evident in the last experimental weeks (Table 3andFig 3).
When assessing appetite sensations in humans ingesting almonds and walnuts, levels of hunger were found to be suppressed and satiety increased [29,30]. Like almonds and other nuts, Cashew nuts present high lipid and protein contents, as well as fibers which are associ-ated with reduced appetite [29].
The supplementation of fibers in rats fed a diet rich in fats has also caused a decrease in ani-mals’ weights, but with increased consumption [31,28]. Another factor associated with alter-ation of satiety is the profile and amount of fatty acids in the lipid source consumed; these eventually flow through the bloodstream and affect satiety in the brain. After triacylglycerol
hydrolysis of foods, fatty acids are transported to epithelial cells in the form of micelles to be absorbed. Depending on the degree of fat insaturation, micelle formation becomes faster; UFAs are more readily available for absorption, causing release of hormones and increased satiety [32].
Kozimor et al. [33], evaluated satiety in women receiving a diet rich in SFA, MUFA, and PUFA and it was observed that PUFAs promoted greater satiety in comparison to SFAs. In the
Table 6. Composition of fatty acids (%) present in the feces of dyslidemics rats fed with cashew nuts.
FATTY ACIDS GROUPS
CONT DL DLCN
14thday 35thday 14thday 35thday 14thday 35thday
SATURATED Myristic acid 14:0 8.47± 0.02 9.19± 0.28 10.80± 0.33� 9.39± 0.60 9.99± 0.56�# 10.85± 0.84�# Pentadecanoic acid 15:0 1.70± 0.14 3.11± 0.24 1.26± 0.25� 2.16± 1.13� 1.95± 0.18# 2.61 ± 0.25�# Palmitic acid 16:0 16.02± 0.13 16.97± 0.24 14.97± 0.06� 15.78± 0.36� 16.42± 0.18�# 14.63 ± 0.19�# Margaric acid 17:0 0.10± 0.01 0.24± 0.02 0.05± 0.03� 0.16± 0.06 0.19± 0.02�# 0.35± 0.12# Stearic acid 18:0 15.24± 0.34 9.95± 0.20 15.25± 0.13 16.78± 0.01� 16.04± 0.15�# 11.35 ± 0.32�# Arachidic acid 20:0 0.73± 0.03 1.05± 0.04 0.52± 0.04� 0.97± 0.16 0.49± 0.08� 0.63± 0.14�# Behenic acid 22:0 0.65± 0.01 1.01± 0.04 0.40± 0.04� 0.65± 0.00� 0.52± 0.00�# 0.43 ± 0.00�# Lignoceric acid 24:0 0.99± 0.03 1.91± 0.02 0.79± 0.05� 1.23± 0.07� 0.74± 0.01� 1.27± 0.16� TOTAL 43.9 43.43 44.04 47.12 46.34 42.12 MONOUNSATURATED Myristoleic acid 14:1ω5c 2.41± 0.01 2.35± 0.15 1.91± 0.23� 1.88± 0.17� 2.22± 0.20# 2.61 ± 0.04�# Pentadecenoic acid 15:1ω5c 0.33± 0.03 0.49± 0.00 0.19± 0.05� 0.33± 0.03� 0.20± 0.03� 0.43± 0.02�# Palmitoleic acid 16:1ω7c 0.50± 0.06 0.58± 0.00 0.42± 0.11 0.62± 0.09 0.61± 0.09# 0.66 ± 0.17 Oleic acid 18:1ω9t 2.39± 0.05 3.64± 0.11 1.82± 0.01� 2.12± 0.14� 2.06± 0.01�# 0.97 ± 0.18�# Oleic acid 18:1ω9c 16.36± 0.25 15.13± 1.02 16.04± 1.41 14.59± 0.97 15.92± 0.28 16.50± 0.05�# Erucid acid 22:1ω9 0.18± 0.05 0.28± 0.06 0.18± 0.02 0.20± 0.00� 0.15± 0.07 -TOTAL 22.17 22.47 20.56 19.74 21.16 21.17 POLYUNSATURATED Linoleic acid 18:2ω6c 20.69± 0.05 19.34± 0.32 18.92± 0.28� 17.84± 0.79� 18.17± 0.27�# 17.48 ± 0.18�# γ-linolenic acid 18:3ω6 0.33± 0.08 0.16± 0.05 0.23± 0.02� 0.18± 0.08 0.26± 0.02� 0.16± 0.03 α-linolenic acid 18:3ω3 0.82± 0.00 0.73± 0.00 1.04± 0.00� 0.84± 0.00� 0.57± 0.00�# 0.39± 0.00�# Eicosadienoic acid 20:2ω6 0.17± 0.01 0.15± 0.05 0.19± 0.02 0.29± 0.04� - -Arachidonic acid 20:4ω6c 0.26± 0.00 0.26± 0.01 0.48± 0.07� 0.41± 0.02� 0.43± 0.08� 0.35± 0.09� Eicosapentaenoic acid 20:5ω3 0.46± 0.05 0.41± 0.03 0.76± 0.07� 0,57± 0.01� 0.50± 0.03# 0.76± 0.00�# Docosahexaenoic acid 22:6ω3 0.36± 0.14 0.62± 0.05 0.77± 0.07� 0.48± 0.06� 0.64± 0.03� 1.08± 0.14�# TOTAL 23.09 21.67 22.39 20.61 20.57 20.22 PUFA/SFA 0.52 0.50 0.51 0.44 0.44 0.47 Sω3 1.64 1.76 2.57 1.89 1.71 2.23 Sω5 2.74 2.84 2.10 2.21 2.42 3.04 Sω6 21.45 19.91 19.82 18.72 18.86 17.99 Sω7 0.50 0.58 0.42 0.62 0.61 0.66 Sω9 18.93 19.05 18.04 16.91 18.13 17.47 ω6/ω3 13.08 11.31 7.71 9.90 11.03 8.07
Values are expressed as mean± SEM. The first collection occurred at 14thday of the experiment and the second collection at 35thday of experiment. CONT = Control group; DL = Dyslipidemic Group; DLCN = Dyslipidemic Cashew Nut Group; S = sum; PUFA = Polyunsaturated Fatty Acids; SFA = Saturated Fatty Acids.
�vs CONT.
#
vs DL. Statistical test used was One-Way ANOVA followed by Tukey with level of significance (p <0.05).
study, MUFAs presented a lower satiety response as compared to the other two types of fat. Poudyal and collaborators [34] concluded that supplementation with differing oils such as: “macadamia oil, safflower oil, and linseed oil, being respectively rich in oleic, linoleic, and α-linolenic acids, reduced feed intakes as compared to groups fed a normal diet. A study compar-ing a diets rich in saturated and unsaturated fats, found higher weights in rats fed a diet rich in saturated fats, even with the same calorie intake for both groups [35].
The Cashew nuts used in this research presented excellent total phenolic content and total flavonoids; as well as a high catechin content, seen in Tables1and2, giving it a high nutritional quality [36]. According to Trox et al. [37], Cashew nuts present high antioxidant potential because they are a source of phenolic compounds which possess biological and medicinal properties. Like other oleaginous foods, the total phenolic content and total flavonoids found in Cashew nuts are highlighted for their functional properties [38,39], being responsible for inhibiting or reducing oxidation, and resulting in UFA protection [40]. However, Cashew nuts’ antioxidant content can be diminished through heat treatment, percentage of shell pres-ent, storage, and irradiation processes [40]. Studies show the potential value ofAnacardium occidentale as a source of antioxidants not only in the fruit, but also in its leaves and
pseudo-fruits [41,42].
The induction of dyslipidemia as performed in the present study proved to be effective, since the treatment induced an increase in TC in both treated groups (DL and DLCN) (Fig 4). However, the consumption of Cashew nuts did not reverse the effects caused by the adminis-tration of a high fat content emulsion. The Cashew nuts used in the present study presented a total dietary fiber content of 3.65 g per 100 g of product, (with 0.33 g of soluble and 3.32 g of insoluble fibers). Soluble fibers are widely used in the treatment of dyslipidemias [43,44]. In contrast, insoluble fiber consumption does not present positive effects for cholesterol reduc-tion or cardiovascular risk [14]; as verified in the present study, because there were no observed reductions in TC or TG.
The hypocholesterolemic action caused by consumption of seed oils still diverges in many studies. Lovejoy et al. [45], evaluated non-diabetic adult males and females who consumed 100 g of almonds/day for 4 weeks. A reduction in TC by 21% was observed. Similarly, Lee et al. [46] reported improvement of TC levels in women with metabolic syndrome who consumed a nut mixture for 6 weeks. However, Casas-Agustench et al. [26], when assessing the effect of a seed oil mixture (walnuts, almonds and hazelnuts), in conjunction with a standard diet in adult men and women with metabolic syndrome observed (after 12 weeks) no alterations in TC, LDL, HDL and TG. When evaluating the administration of Cashew leaf, stem and nut extract, Jaiswal et al. [47], reported no significant differences in TC and HDL levels in diabetic rats.
In the present study, the HDL levels in the dyslipidemic group decreased in comparison to the control group. However, in the animals treated with Cashew nuts, which also suffered prior induction of dyslipidemia, the damage was reversed. The DLCN presented values similar to the control group (which did not suffer from induction of dyslipidemia) (Fig 4), thus highlighting the beneficial effects of Cashew nuts on HDL levels.
Evaluating the glycemic metabolism of the animals in the present study through fasting gly-cemia, the group treated with Cashew nuts presented higher values as compared to the other groups (Fig 4). In the oral glucose tolerance test, the groups DL and DLCN presented elevated levels of serum glucose at the beginning and end of the test (time 0, 30 and 45 minutes) (Fig 5A), this can be confirmed inFig 5Bwith the glucose area over the OTTG curve. However, the curve shows that DL had higher serum glucose levels. Studies evaluating seed oil consumption in humans have observed a reduction in fasting glycemia in diabetic individuals [48,49,45]. However, Ma et al. [50], when treating diabetic men and women with nuts, verified an increase in fasting glycemia.
Research also performed with humans presents results similar to the present study when performing the OGTT, confirming an increase in serum glycemia in men and women diag-nosed with metabolic syndrome and treated with Cashew nuts for 8 weeks [51]. When testing a diet with high fat content, Almeida-Suhett et al. [52], also found an increase in basal glycemia in rats, resulting in a glucose tolerance curves with greater areas in the animals fed the high fat content diets.
Regarding serum TG levels, DLCN presented a decrease of 36.3% in relation to the dyslipi-demic group and a 23% elevation as compared to the control group. Because they are a source of UFA, Cashew nuts promote a fall in TG because they potentially reduce exposure of non-esterified fatty acids to the liver, preventing one of the main TG synthesis pathways [53]. How-ever in this study, Cashew nuts were not able to completely ablate such alterations as compared to the control group.
Alterations in carbohydrate metabolism interfere in the lipid profile, because when glucose appears in excess, insulin converts it into fatty acids which are stored in the form of TG, (their concentration becomes elevated and HDLs are reduced). Elevation of TG levels implies pan-creaticβ cell apoptosis due to lipotoxicity, causing insulin resistance [54]. Thus, elevation of serum TG levels correlates with high fasting glucose levels and the OGTT results in this study. The induction of dyslipidemia and the consumption of Cashew nuts may have triggered increased glycemic levels which interfere with lipid metabolism.
A diet rich in lipids, such as the one used in the present study, causes the organism to accu-mulate excess fat, with adipocyte expansion, high blood concentrations of serum lipids and lipoproteins, and high lipid supplies to the liver. Lipid superaccumulation results in the ectopic deposition of lipids in non-adipose tissues, and increases hepatic gluconeogenesis; along with LDL and HDL reductions [55,56].
In our study, the animals of the DL and DLCN groups were kept on a fat-rich diet, and the DLCN group received Cashew nuts (in addition) which also have high lipid content. The data revealed that supplementation with Cashew nuts induces a lower deposition of fatty acids in the adipose tissues, besides promoting a decrease in serum TG. The data correlate when con-sidering that TG are stored in the adipose tissue and that deposition is directly related to its synthesis in the liver and its concentration in the bloodstream [57].
However, reduction in fat deposition was not observed in the liver, since there was a higher accumulation of fats in the DLCN than in the DL. Evaluating the fatty acids profile as accumu-lated in this tissue, a difference was observed; the group that received Cashew nuts presented more MUFA in relation to the DL group.
Considering that the DLCN group received fatty acids (originating in Cashew nuts) in addi-tion to the dietary fatty acids which the DL group also received. Cashew nut supplementaaddi-tion inhibited fat accumulation in adipose tissue as compared to DL. However, when analyzing the glycemic curve we also found an increase in plasma glycemia. According to Kahn and Valdez [55], a fat-rich diet can generate free fatty acid deposition in the pancreas; reduce insulin secre-tion, inducing insulin resistance, or hyperglycemia. This potentially occurred in the present study, since there was an increase in the glycemic curve and in fasting hyperglycemia.
When the physical condition of the animals was evaluated, it was found that the Cashew nuts offered to the animals caused (besides reduction of body weight) a reduction of visceral (mesenteric and epididymal) and retroperitoneal fats (Fig 6). Vaidya et al. [58] evaluated the effect of omega 3 fatty acid supplementation in rats with a fat-rich diet, and observed reduc-tions in body fat in animals treated for 8 weeks. The same research observed reduction of body weight, reduction of liver weight, reduction of TC, and of hepatic cholesterol. Bhaskaran et al. [35], when treating rats with saturated and unsaturated fats found a reduction in the size of the
adipocytes of the group fed with a diet rich in unsaturated fat. These studies corroborate our findings, where Cashew nuts, a source of unsaturated fats, produced the same results.
Fat-rich diets also induce adipose tissue accumulation; which causes the increase of free plasmatic fatty acids [59]. The release of free fatty acids from visceral adipose tissues contrib-utes to fat oxidation, and stimulates esterification of fatty acids into TGs in the liver. This leads to reductions in glucose and lipid metabolism in the peripheral tissues [60]. Our research pre-sented reductions of visceral and retroperitoneal fats in the group treated with Cashew nuts. In contrast, there was an increase in serum TG (as compared to the control group) and higher liver fat accumulation, which might be explained by increased oxidation of fatty acids and reduction of lipogenesis, which uses peripheral tissue fats [35].
The hepatic fat content measured followed the organ weight; since as fat deposition increases, there is an increase in organ weight. Our findings evidenced greater deposition of hepatic fat in the group treated with Cashew nuts as compared to the other groups (CONT and DL), but the liver weight increased in both dyslipidemic groups (DLCN and DL) as com-pared to CONT (Fig 7). Cholesterol and TG synthesis is highest in the liver, and the main sites of fat deposition are in the viscera and under the skin.
In this study, the animals that consumed Cashew nuts presented lower abdominal fat depo-sition. Both dyslipidemic groups presented a higher percentage of liver fat, with the highest amount found in DLCN. The correlation of hepatic fat deposition with quantification of fatty acids revealed that when comparing the DLCN with the DL, the amounts of SFA were similar; with the MUFA contents being 21% higher in the DLCN. These results are possibly due to Cashew nuts being a source of oleic acid. The consumption of Cashew nuts induced greater hepatic deposition of MUFA. As in our research, Picklo et al. [61], also found an increase in oleic acid in the livers of rats with a high-fat oleic acid diet; as well as an elevation of liver fats and glycemia for these animals.
High depositions of inappropriate ectopic fat in the liver generate hepatic steatosis or non-alcoholic fatty liver disease (NAFLD) [57], a disease with negative impacts on the health of obese individuals, and usually accompanied by dyslipidemia and other complications [58,62].
Lee Homma and Fujii [63] showed that the early phase of non-alcoholic fatty liver disease (NAFLD) presents protective functions against oxidative lesions caused by reactive oxygen species (ROS) and toxic agents in rats when fed a diet rich in unsaturated fat, because this tem-porary accumulation of liver fat is an adaptive response of hepatocytes under stress. Research comparing the accumulation of liver fats as related to the consumption of SFA, (with a palm oil based diet), and UFA, (with sunflower oil-based diet) in adult men and women concluded that a UFA rich diet prevents liver, visceral, and total fat deposition as compared to the SFA rich diet. This was not observed in the present study [53].
The Cashew nuts used in this research are a source of oleic acid and linoleic acid, however, since it was offered to previously dyslipidemic animals and this continued with consumption of a hyperlipid emulsion, the Cashew nut consumption was not able to reverse liver fat accu-mulation or to improve the fatty acid profile in the tissue, with the exception of the MUFA.
In the first collection, the amount of fat excreted in the feces was higher in the DL and DLCN groups than in the CONT group, due to induction of dyslipidemia through administra-tion of a high fat content emulsion. However, in the second collecadministra-tion, (after initiaadministra-tion of treat-ment with Cashew nuts), there was a higher amount of fat excretion by DLCN as compared to CONT and DL (Fig 8). The use of fibers in the diet assists in the excretion of fat through the feces [64]. Cashew nuts, in addition to containing dietary fibers, are a food source of UFAs, especially oleic and linoleic acids. High fat intake, (as in the case of the animals in the DL group), induced higher fecal fat excretion, and the consumption of Cashew nuts (which is a
source of fibers) also caused an increase in excretion. The soluble fibers form a chelate with the fat being excreted by the gallbladder or consumed in the diet [65].
Thus, in the present study, the data confirm that the fibers and lipid content of Cashew nuts were responsible for the increase in fecal fat excretion. When using seed oils (walnuts, almonds and hazelnuts) in research with adult individuals, Casas-Agustench et al. [26] found higher excretion of fecal fat when compared to the control group. Research evaluating dietary fiber contents, found that a diet supplemented with flaxseed increased fat excretion by up to 50% [64]. Even with increased fat excretion, DLCN showed high total cholesterol, but this group consumed largely unsaturated cashew lipids, which may be responsible for increasing the HDL content compared to DL.
When correlating the data of this study, we found that Cashew nuts in a dyslipidemic diet (DLCN), in relation to the group without Cashew nuts (DL), led to reversal of HDL serum lev-els, weight reduction, visceral and retroperitoneal fat deposition, higher liver fat deposition (of a better quality) and increased excretion of fecal fat. However, we also found increased serum levels of total cholesterol, together with glucose.
Conclusion
Previously dyslipidemic animals, maintained on saturated fats associated with Cashew nuts, presented reductions in visceral and retroperitoneal fat deposition, and a reversal of dimin-ished HDL levels usually found in dyslipidemias. However, treatment with Cashew nuts com-promised glycemic metabolism, and augmented fat deposition in the hepatic tissue.
We conclude that consumption of Cashew nuts by dyslipidemic animals in an unbalanced diet presents improvements in dyslipidemia, yet also increases glycemic alterations, and raises risks of non-alcoholic fatty liver disease.
Supporting information
S1 Fig. Experimental protocol.
(TIF)
S2 Fig. Chromatogram for the analysis of cashew nut phenolic compounds.
(TIF)
S1 Table. Commercial chow composition.
(DOCX)
Acknowledgments
We would like to thank the scientific collaboration of CBQF under the FCT project UID/ Multi/50016/2013 and the Fuel and Materials Laboratory of UFPB.
Author Contributions
Conceptualization: Celina C. Q. Dias, Marı´lia Ferreira Frazão Tavares de Melo, Juliana Ke´ssia B. Soares.
Data curation: Celina C. Q. Dias, Ana Paula Vilar Alves, Francileide Amaro Dantas, Je´ssyka
Kallyne Galvão Bezerra.
Formal analysis: Celina C. Q. Dias, Juliana Ke´ssia B. Soares.
Investigation: Celina C. Q. Dias, Gabriel Henrique Oliveira Almeida, Ana Paula Vilar Alves,
Francileide Amaro Dantas, Je´ssyka Kallyne Galvão Bezerra, Vanessa Bordin Viera.
Methodology: Juliana Ke´ssia B. Soares.
Project administration: Celina C. Q. Dias, Juliana Ke´ssia B. Soares. Resources: Marta S. Madruga, Juliana Ke´ssia B. Soares.
Supervision: Celina C. Q. Dias, Juliana Ke´ssia B. Soares. Validation: Celina C. Q. Dias.
Visualization: Celina C. Q. Dias, Juliana Ke´ssia B. Soares. Writing – original draft: Celina C. Q. Dias.
Writing – review & editing: Celina C. Q. Dias, Marta S. Madruga, Maria Manuela E. Pintado,
Marı´lia Ferreira Frazão Tavares de Melo, Juliana Ke´ssia B. Soares.
References
1. Grosso G, Estruch R. Nut consumption and age-related disease. Maturitas. 2016; 84:11–16.https://doi. org/10.1016/j.maturitas.2015.10.014PMID:26586104
2. Sabate´ J, Haddad E, Tanzman JS, Jambazian P, Rajaram S. Serum lipid response to the graduated enrichment of a Step I diet with almonds: a randomized feeding trial. Am J Clin Nutr. 2003; 77:1379–84. https://doi.org/10.1093/ajcn/77.6.1379PMID:12791613
3. Albert CM, Gaziano JM, Willett WC, Manson JE. Nut consumption and decreased risk of sudden car-diac death in the Physicians’ Health Study. Arch Intern Med. 2002; 162:1382–87.https://doi.org/10. 1001/archinte.162.12.1382PMID:12076237
4. Jiang R, Jacobs DR Jr, Mayer-Davis E, Szklo M, Herrington D, Jenny NS, et al. Nut and seed consump-tion and inflammatory markers in the multi-ethnic study of atherosclerosis. Am J Epidemiol. 2006; 163:222–31.https://doi.org/10.1093/aje/kwj033PMID:16357111
5. Melo MFFT, Pereira DE, Sousa MM, Medeiros DMF, Lemos LTM, Madruga MS, et al. Maternal intake of cashew nuts accelerates reflex maturation and facilitates memory in the offspring. International Jour-nal of Developmental Neuroscience. 2017; 61:58–67.https://doi.org/10.1016/j.ijdevneu.2017.06.006 PMID:28663041
6. Andrade TJAS, Arau´jo BQ, Cito´ AMGL, Silva J, Saffi J, Richter MF, et al. Antioxidant properties and chemical composition of technical Cashew Nut Shell Liquid (tCNSL). Food Chemistry. 2011; 126:1044– 48.
7. Carvalho ALN, Annonia R, Silva PRPS, Borelli P, Fock RA, Trevisan MTS, et al. Acute, subacute toxic-ity and mutagenic effects of anacardic acids from cashew (Anacardium occidentale Linn.) in mice. Jour-nal of Ethnopharmacology. 2011; 135:730–36.https://doi.org/10.1016/j.jep.2011.04.002PMID: 21511024
8. NUTS & DRIED FRUITS STATISTICAL YEARBOOK 2016/2017. International Nut and Dried Fruit Council Foundation (INC). Available im:<http://www.nutfruit.org/wp-continguts/uploads/2017/06/ Statistical-Yearbook-2016-2017.pdf>Access date: 01/07/2017.
9. Agila A, Barringer SA. Volatile Profile of Cashews (Anacardium occidentale L.) from Different Geo-graphical Origins during Roasting. Journal of Food Science. 2011; 76(5):768–74.
10. Baptista A, Gonc¸alves RV, Bressan J, Peluzio MCG. Antioxidant and Antimicrobial Activities of Crude Extracts and Fractions of Cashew (Anacardium occidentale L.), Cajui (Anacardium microcarpum), and Pequi (Caryocar brasiliense C.): A Systematic Review. Oxidative Medicine and Cellular Longevity. 2018; 2018:13p.https://doi.org/10.1155/2018/3753562PMID:29849888
11. Alexiadou K, Katsilambros N. Nuts: Anti-atherogenic food? European Journal of Internal Medicine. 2011; 22:141–46.https://doi.org/10.1016/j.ejim.2010.11.008PMID:21402243
12. Go´mez-Caravaca AM, Verardo V, Caboni MF. Chromatographic techniques for the determination of alkyl-phenols, tocopherols and other minor polar compounds in raw and roasted cold pressed cashew nut oils. Journal of Chromatography A. 2010; 1217:7411–17.https://doi.org/10.1016/j.chroma.2010.09. 054PMID:20961547
13. Wong ND. Epidemiological studies of CHD and the evolution of preventive cardiology. Nat. Rev. Car-diol. 2014; 11:276–89.https://doi.org/10.1038/nrcardio.2014.26PMID:24663092
14. Faludi AA, Izar MCO, Saraiva JFK, Chacra APM, Bianco HT, Afiune Neto A, et al. Atualizac¸ão da Dire-triz brasileira de dislipidemias e prevenc¸ão da aterosclerose. Arquivos Brasileiro de Cardilogia. 2017; 109(2).
15. AOAC INTERNATIONAL. Official methods of analysis. 16thed. Gaitherburg: Published by AOAC
International. 1997; 2:1–43.
16. Prosky L, Asp NG, Sceweizer TF. Determination of insoluble, soluble and total fiber in food products: interlaboratory study. J Assoc Off Anal Chem. 1988; 71(5):1017–23. PMID:2853153
17. Liu M, Li XQ, Weber C, Lee CY, Brown J, Liu RH. Antioxidant and antiproliferative activities of raspber-ries. Journal of Agricultural and Food Chemistry. 2002; 50:2926–30.https://doi.org/10.1021/jf0111209 PMID:11982421
18. Zhishen J, Mengchen T, Jianming W. The determination of flavonoid contents in mulberry and their scavenging effects on superoxide radicals. Food Chemistry. 1999; 64:555–59.
19. Meireles BRLA. Potencial nutricional e antioxidante do fruto do catole´ (Syagrus cearensis). M.Sc. The-sis, Universidade Federal da Paraı´ba. 2017. Available from:https://repositorio.ufpb.br/jspui/handle/ 123456789/12729
20. Xu D, Xu M, Lin L, Rao S, Wang J, Davey AK. The effect of isosteviol on hyperglycemia and dyslipide-mia induced by lipotoxicity in rats fed with high-fat emulsion. Life Sciences. 2012; 90:30–38.https://doi. org/10.1016/j.lfs.2011.10.010PMID:22075495
21. Novelli ELB, Diniz YS, Galhardi CM, Ebaid GMX, Rodrigues HG, Mani F, et al. Anthropometrical param-eters and markers of obesity in rats. Laboratory Animals. 2007; 41:111–119.https://doi.org/10.1258/ 002367707779399518PMID:17234057
22. Cinti S. The Adipose Organ. Prostaglandins, Leukotrienes and Essential Fatty Acids. 2005; 73:9–15.
23. Folch J, Lees M, Sloane Stanley GH. A simple method for the isolation and purification of total lipids from animal tissues. Journal Biological Chemistry. 1957; 226:497–509.
24. Hartman L, Lago RCA. Rapid preparation of fatty acid methyl from lipids. Lab. Pract. 1973; 22:475. PMID:4727126
25. Vadivel V, Kunyanga CN, Biesalski HK. Health benefits of nut consumption with special reference to body weight control. Nutrition. 2012; 28:1089–97.https://doi.org/10.1016/j.nut.2012.01.004PMID: 23044160
26. Casas-Agustench P, Lo´pez-Uriarte P, Bullo´ M, Ros E, Cabre´ -Vila JJ, Salas-Salvado´ J. Effects of one serving of mixed nuts on serum lipids, insulin resistance and inflammatory markers in patients with the metabolic syndrome. Nutrition, Metabolism & Cardiovascular Diseases. 2011; 21:126–135.
27. Neyrinck AM, Bindels LB, De Backer F, Pachikian BD, Cani PD, Delzenne NM. Dietary supplementation with chitosan derived from mushrooms changes adipocytokine profile in diet-induced obese mice, a phenomenon linked to its lipid-lowering action. International Immunopharmacology. 2009; 9:767–773. https://doi.org/10.1016/j.intimp.2009.02.015PMID:19286482
28. Chang S, Cui X, Guo M, Tian Y, Xu W, Huang K, et al. Insoluble Dietary Fiber from Pear Pomace Can Prevent High-Fat Diet-Induced Obesity in Rats Mainly by Improving the Structure of the Gut Microbiota. J. Microbiol. Biotechnol. 2017; 27(4):856–867https://doi.org/10.4014/jmb.1610.10058PMID:
28173692
29. Tan SY, Mattes RD. Appetitive, dietary and health effects of almonds consumed with meals or as snacks: a randomized, controlled trial. European Journal of Clinical Nutrition. 2013; 67:1205–1214. https://doi.org/10.1038/ejcn.2013.184PMID:24084509
30. Brennan AM, Sweeney LL, Liu X, Mantzoros CS. Walnut consumption increases satiation but has no effect on insulin resistance or the metabolic profile over a 4 day period. Obesity (Silver Spring). 2010; 18 (6):1176–1182.https://doi.org/10.1038/oby.2009.409PMID:19910942
31. Brockman DA, Chen X, Gallaher DD. High-Viscosity Dietary Fibers Reduce Adiposity and Decrease Hepatic Steatosis in Rats Fed a High-Fat Diet. J Nutr. 2014 144(9):1415–22.https://doi.org/10.3945/jn. 114.191577PMID:24991042
32. Maljaars J, Romeyn EA, Haddeman E, Peters HPF, Masclee AAM. Effect of fat saturation on satiety, hormone release, and food intake. Am J Clin Nutr. 2009; 89:1019–24.https://doi.org/10.3945/ajcn. 2008.27335PMID:19225118
33. Kozimor A, Chang H, Cooper JA. Effects of dietary fatty acid composition from a high fat meal on sati-ety. Appetite. 2013; 69:39–45.https://doi.org/10.1016/j.appet.2013.05.006PMID:23688821
34. Poudyal H, Kumar SA, Iyer A, Waanders J, Ward LC, Brown L. Responses to oleic, linoleic and α-linole-nic acids in high-carbohydrate, high-fat diet-induced metabolic syndrome in rats. Journal of Nutritional Biochemistry. 2013; 24:1381–1392.https://doi.org/10.1016/j.jnutbio.2012.11.006PMID:23333092
35. Bhaskaran S, Unnikrishnan A, Ranjit R, Qaisar R, Pharaoh G, Matyi S, et al. A fish oil diet induces mito-chondrial uncoupling and mitomito-chondrial unfolded protein response in epididymal white adipose tissue of
mice. Free Radical Biology and Medicine. 2017; 108:704–714.https://doi.org/10.1016/j.freeradbiomed. 2017.04.028PMID:28455142
36. Trox J, Vadivel V, Vetter W, Stuetz W, Kammerer DR, Carle R, et al. Catechin and epicatechin in testa and their association with bioactive compounds in kernels of cashew nut (Anacardium occidentale L.). Food Chemistry. 2011; 128:1094–1099.
37. Trox J, Vadivel V, Vetter W, Stuetz W, Scherbaum V, Gola U, et al. Bioactive Compounds in Cashew Nut (Anacardium occidentale L.) Kernels: Effect of Different Shelling Methods. J. Agric. Food Chem. 2010; 58:5341–5346.https://doi.org/10.1021/jf904580kPMID:20387832
38. Cardoso BR, Duarte GBS, Reis BZ, Cozzolino SMF. Brazil nuts: Nutritional composition, health benefits and safety aspects. Food Research International. 2017; 100:9–18.https://doi.org/10.1016/j.foodres. 2017.08.036PMID:28888463
39. Yang J, Liu RH, Halim L. Antioxidant and antiproliferative activities of common edible nut seeds. LWT— Food Science and Technology. 2009; 42:1–8.
40. Sajilata MG, Singhal RS. Effect of irradiation and storage on the antioxidative activity of cashew nuts. Radiation Physics and Chemistry. 2006; 75:297–300.
41. Barbosa Filho VM, Waczuk EP, Kamdem JP, Abolaji AO, Lacerda SR, Costa JGM, et al. Phytochemical constituents, antioxidant activity, cytotoxicity andosmotic fragility effects of Caju (Anacardium microcar-pum). Industrial Crops and Products. 2014; 55:280–88.
42. Aguilar YM, Rodrı´guez FS, Saavedra MA, Espinosa RH, Yero OM. Secondary metabolites and in vitro antibacterial activity of extracts from Anacardium occidentale L. (Cashew tree) leaves. Revista Cubana de Plantas Medicinales. 2012; 17(4):320–329.
43. Slavin JL. Dietary fiber and body weight. Nutrition. 2005; 21:411–418.https://doi.org/10.1016/j.nut. 2004.08.018PMID:15797686
44. Rao TP. Role of guar fiber in appetite control. Physiology & Behavior. 2016; 64:277–83.
45. Lovejoy JC, Most MM, Lefevre M, Greenway FL, Rood JC. Effect of diets enriched in almonds on insulin action and serum lipids in adults with normal glucose tolerance or type 2 diabetes. Am J Clin Nutr. 2002; 76:1000–1006.https://doi.org/10.1093/ajcn/76.5.1000PMID:12399271
46. Lee YJ, Nam GE, Seo JA, Yoon T, Seo I, Lee JH, et al. Nut consumption has favorable effects on lipid profiles of Korean women with metabolic syndrome. Nutrition Research. 2014; 34:814–820.https://doi. org/10.1016/j.nutres.2014.08.011PMID:25238912
47. Jaiswal YS, Tatke PA, Gabhe SY, Vaidya AB. Antidiabetic activity of extracts of Anacardium occiden-tale Linn. leaves on n-streptozotocin diabetic rats. Journal of Traditional and Complementary Medicine. 2016; 7(4):421–27https://doi.org/10.1016/j.jtcme.2016.11.007PMID:29034189
48. Damavandi RD, Eghtesadi S, Shidfar F, Heydari I, Foroushani AR. Effects of hazelnuts consumption on fasting blood sugar and lipoproteins in patients with type 2 diabetes. J Res Med Sci. 2013; 18(4):314– 321. PMID:24124429
49. Sauder KA, Mccrea CE, Kris-Etherton PM, Ulbrecht JS, West SG. Effect of pistachios on lipids, lipopro-teins, glucose metabolism, and insulin sensitivity in type 2 diabetes. FASEB Journal 2013; 27:368–374. https://doi.org/10.1096/fj.12-213728
50. Ma Y, Njike VY, Millet J, Dutta S, Doughty K, Treu JA, et al. Effects of Walnut Consumption on Endothe-lial Function in Type 2 Diabetic Subjects: A randomized controlled crossover trial. Diabetes Care. 2010; 33:227–232.https://doi.org/10.2337/dc09-1156PMID:19880586
51. Schutte EA, Van Rooyen JM, Huisman HW, Mukuddem-Petersen J, Oosthuizen W, Hanekom SM, et al. Modulation of Baroreflex Sensitivity by Walnuts Versus Cashew Nuts in Subjects With Metabolic Syndrome. American Journal of Hypertension 2006; 19:629–636.https://doi.org/10.1016/j.amjhyper. 2005.12.014PMID:16733237
52. Almeida-Suhett CP, Graham A, Chen Y, Deuster P. Behavioral changes in male mice fed a high-fat diet are associated with IL-1βexpression in specific brain regions. Physiology & Behavior. 2017; 169:130– 140.
53. Rosqvist F, Iggman D, Kullberg J, Cedernaes J, Johansson HE, Larsson A, et al. Overfeeding Polyun-saturated and Saturated Fat Causes Distinct Effects on Liver and Visceral Fat Accumulation in Humans. Diabetes. 2014; 63(7):2356–68.https://doi.org/10.2337/db13-1622PMID:24550191
54. Kahn SE, Cooper ME, Del Prato S. Pathophysiology and treatment of type 2 diabetes: perspectives on the past, presente, and future. The Lancet. 2014; 383:1068–1083.
55. Kahn HS, Valdez R. Metabolic risks identified by the combination of enlarged waist and elevated triacyl-glycerol concentration. Am J Clin Nutr. 2003; 78:928–34.https://doi.org/10.1093/ajcn/78.5.928PMID: 14594778
56. Esmaillzadeh A, Mirmiran P, Azizi F. Clustering of metabolic abnormalities in adolescents with the hypertriglyceridemic waist phenotype. Am J Clin Nutr. 2006; 83:36–46.https://doi.org/10.1093/ajcn/83. 1.36PMID:16400047
57. Yang MY, Chan KC, Lee YJ, Chang XZ, Wu CH, Wang CJ. Sechium edule Shoot Extracts and Active Components Improve Obesity and a Fatty Liver That Involved Reducing Hepatic Lipogenesis and Adi-pogenesis in High-Fat-Diet-Fed Rats. J. Agric. Food Chem. 2015; 63:4587−4596.https://doi.org/10. 1021/acs.jafc.5b00346PMID:25912298
58. Vaidya HB, Gangadaran S, Cheema SK. An obesogenic diet enriched with blue mussels protects against weight gain and lowers cholesterol levels in C57BL/6 mice. Nutrition Research. 2017; 46:31– 37.https://doi.org/10.1016/j.nutres.2017.07.004PMID:29173649
59. Belchior T, Paschoal VA, Magdalon J, Chimin P, Farias TM, Chaves-Filho AB, et al. Omega-3 fatty acids protect from diet induced obesity, glucose intolerance, and adipose tissue inflammation through PPARγ-dependent and PPARγ-independent actions. Mol. Nutr. Food. Res. 2015; 59:957–967.https:// doi.org/10.1002/mnfr.201400914PMID:25641959
60. Guo X, Sinclair AJ, Kaur G, Li D. Differential effects of EPA, DPA and DHA on cardio-metabolic risk fac-tors in high-fat diet fed mice. Prostaglandins Leukotrienes and Essential Fatty Acids. 2018; 136:47–55. https://doi.org/10.1016/j.plefa.2017.09.011PMID:29113747
61. Picklo MJ, Idsoa J, Seegerc DR, Aukemad HM, Murphyc EJ. Comparative effects of high oleic acid vs high mixed saturated fatty acid obesogenic diets upon PUFA metabolism in mice. Prostaglandins, Leu-kotrienes and Essential Fatty Acids. 2017; 119:25–37.
62. Fabbrini E, Sullivan S, Klein S. Obesity and nonalcoholic fatty liver disease: Biochemical, metabolic, and clinical implications. Hepatology. 2010; 51:679–89.https://doi.org/10.1002/hep.23280PMID: 20041406
63. Lee J, Homma T, Fujii J. Mice in the early stage of liver steatosis caused by a high fat diet are resistant to thioacetamide-induced hepatotoxicity and oxidative stress. Toxicology Letters. 2017; 277:92–103. https://doi.org/10.1016/j.toxlet.2017.06.005PMID:28642009
64. Kristensen M, Jensen MG, Aarestrup J, Petersen KE, Sondergaard L, Mikkelsen MS, et al. Flaxseed dietary fibers lower cholesterol and increase fecal fat excretion, but magnitude of effect depend on food type. Nutrition & Metabolism. 2012; 3:9–8.https://doi.org/10.1186/1743-7075-9-8PMID:22305169
65. Mcrae MP. Dietary fiber is beneficial for the prevention of cardiovascular disease: An umbrella review of meta-analyses. Journal of Chiropractic Medicine. 2017; 16(4):289–299.https://doi.org/10.1016/j.jcm. 2017.05.005PMID:29276461