Yield and composition of milk from dairy cows fed diets containing
cashew nuts
1Produção e composição do leite de vacas leiteiras alimentadas com dietas contendo
castanha de caju
Patrícia Guimarães Pimentel2*, Ronaldo Braga Reis3, José Neuman Miranda Neiva4, Sandra Gesteira Coelho3
and Andréa Pereira Pinto2
ABSTRACT - This work evaluated the production and composition of milk from dairy cows fed increasing levels of cashew nuts in the concentrate portion of the diet. Eight Holstein multiparous cows were used, between the third and fifth lactation, with an average milk yield of 28.0± 4.0 kg day-1, arranged in a double 4 x 4 Latin square experimental design. The assessed
diets consisted of including different amounts of ground cashew nuts (CN): 0; 80; 160 and 240 g kg-1 of concentrate portion,
which resulted in ether extract contents of 31.6; 46.0; 68.9 and 73.1 g kg-1 of dietary dry matter, respectively. Corn silage was
used as the only roughage at a proportion of 50% and diets were formulated to be isoprotein. Diet was offered as a complete mixture. Average milk yield was 30.3 kg day-1. The concentration of protein, N-urea and lactose did not present significant
variations (p>0.05) among the diets. The inclusion of 24% of cashew nut in the concentrate portion of the diet, maintains milk production, reduces milk fat content and together with the reduction in the concentration of short chain fatty acids and the increase in the concentrations of long chain fatty acids, provide a greater nutraceutical value to milk, making the use of cashew nut an excellent alternative for obtaining milk with more benefits to human health.
Key words: Byproduct. Conjugated linoleic acid. Lipids. Milk fat. Milk protein.
RESUMO - O presente trabalho avaliou a produção e a composição do leite de vacas leiteiras alimentadas com níveis crescentes de castanha de caju na porção concentrada da dieta. Foram utilizadas oito vacas holandesas multíparas, entre a terceira e a quinta lactação, com produção média de 28,0± 4,0 kg de leite dia-1, dispostas em delineamento experimental quadrado latino
4 x 4, duplo. As dietas avaliadas consistiram na inclusão de diferentes níveis de castanha de caju moída (CC): 0; 80; 160 e 240 g kg-1 na porção concentrada, possibilitando concentrações de extrato etéreo de 31,6; 46,0; 68,9 e 73,1 g kg-1na matéria
seca da dieta, respectivamente. A silagem de milho foi utilizada como volumoso único, na proporção 50% e as dietas foram formuladas para serem isoproteicas. A dieta foi fornecida na forma de mistura total. A produção média de leite foi 30,3 kg dia-1.
As concentrações de proteína, N-ureico e lactose não apresentaram variações significativas (p>0,05) entre as dietas. A inclusão de 24% de castanha de caju na porção concentrada da dieta, mantem a produção de leite, reduz o conteúdo de gordura no leite e juntamente com a redução na concentração de ácidos graxos de cadeia curta e o aumento nas concentrações de ácidos graxos de cadeia longa, proporciona maior valor nutracêutico ao leite, tornando a utilização de castanha excelente alternativa para obtenção de leite com maior benefício à saúde humana.
Palavras-chave: Ácido linoléico conjugado. Gordura do leite. Lipídeos. Proteína do leite. Subproduto. DOI: 10.5935/1806-6690.20170081
*Autor para correspondência
Recebido para publicação em 23/03/2016; aprovado em 01/12/2016
1Parte da Tese da primeira autora apresentada ao Doutorado em Zootecnia da Escola de Veterinária da Universidade Federal de Minas Gerais, com financiamento do Banco do Nordeste do Brasil
2Departamento de Zootecnia, Centro de Ciencias Agrarias, Universidade Federal do Ceará/UFC, Fortaleza-CE, Brasil, [email protected], [email protected]
3Departamento de Zootecnia, Escola de Veterinária, Universidade Federal de Minas Gerais, Belo Horizonte-MG, Brasil, [email protected], [email protected]
INTRODUCTION
Selecting animals with a greater milk potential requires the use of concentrate feeds, increasing the need to evaluate alternative food sources, such as agroindustrial byproducts. The development of cashew culture in northeastern Brazil stands out for its production volume, comprising the totality of the Brazilian production of cashew nuts (CN). CN that are improper for human consumption are an agroindustrial byproduct.
The supply of CN as a source of lipids to dairy cows is an alternative that allows for increasing the energy density in the diet. However, when lipids are supplied at high levels in the diet, this may cause the accumulation of intermediaries of ruminal biohydrogenation of long chain unsaturated fatty acids, reducing the lipogenic capacity of the mammary gland, and reducing fat content in the milk
as a consequence (CHILLIARDet al., 2007).
Fat is the main energy carrier in milk, and is responsible for most of the physical characteristics as well as manufacturing and organoleptic qualities of milk
and its derivatives (BAUMAN et al., 2006). However,
milk fat is relatively more saturated than most plant oils, and this has led to a negative consumer perception and public health concern related to excessive intake of saturated fats. Consumers are increasingly aware of the link between diet and health, and recently fatty acids have gained special attention for their potential health
benefits (CHILLIARDet al., 2007).
Conjugated linoleic acids (CLA) are the group of positional and geometric isomers of octadecadienoic acid with conjugated double bonds, naturally occurring in the composition of fatty acids derivative of feeds; such a bioactive fatty acid may function to improve health maintenance and prevent chronic diseases
(O´DONNELL-MEGAROet al., 2012; PARODI, 2004). The presence of
CLA in the human diet has received considerable attention due to its anticancer properties and as an immunological modulator and growth promoter (BENJAMIN; SPENER,
2009). According to Dewhurstet al. (2006), the composition
of the basal diet, the amount and form of the lipid supplement, has a significatly effect on changes in milk fat CLA concentrations over an extended period of time.
The objective of this work was to evaluate the production and composition of milk from dairy cows fed increasing levels of CN in the concentrate portion of the diet.
MATERIAL AND METHODS
Humane animal care and handling procedures were followed according to the guidelines of the
University’s animal care committee (Protocolo CEUA 136/2004, UFMG).
Eight Holstein pluriparous cows were used, between the third and fifth lactation, at 50 and 74 post-partum days, with a daily milk average production of
28.0± 4.0 kg, and an average body weight of 555 kg. Cows
were placed in a double 4 x 4 Latin square experimental design.
The experiment consisted of 21-day periods, in which 14 days were for adaptation and seven days for data collection. Animals were kept in confinement and individualized in tie stall installations. The assessed diets consisted of including different amounts of
ground cashew nuts (CN): 0; 80; 160 and 240 g kg-1
of concentrate portion (Table 1). All the diets had 50% corn silage in the total dry matter. Diet was offered as a complete mixture, twice a day after milking, allowing orts of approximately 10%.
Contents of ether extract in the diets with 0; 80;
160 and 240 g of CN kg-1 of concentrate were 31.6; 46.0;
68.9 and 73.1 g kg-1 of dietary dry matter, respectively
(Table 2). Cashew nut contributed approximately with 36.5; 48.0 and 68.1% of the total ether extract in the diet, according to the increasing levels of inclusion. Diets were formulated to be isoprotein (NRC, 2001).
Milking was done mechanically and the milk yield was measured twice a day (07h00 and 17h00), from
the 15th to the 21st day of each experimental period. On
the last two days of the period, four milk samples were collected in successive milking to determine the contents of fat, protein, lactose, urea nitrogen (N-urea), total solids and non-fat solids (NFS) in the milk. To preserve the 50 mL samples, a 10 mg pill of bronopol (2-bromo 2-nitropropane-1,3-diol) was added into each container.
After that, samples were cooled at 4oC.
Milk samples for analysis of the fatty acid profile were the result of a single sample composed of four
milkings of the 20th and 21st days of each experimental
period, stored at -20oC.
The contents of fat, protein, lactose, total solids and NFS in the milk were determined using the near infrared ray method on a Bentley 2000 apparatus (Bentley Instruments, Chaska, EUA).
Milk was corrected for the content of 4% of fat (YMC4%), according to the formula cited by the NRC (1989): YMC4% = 0.4 x milk production + 15 x
(%fat 100-1) x milk yield. Milk yield was also corrected
for content of total solids (MCCTS) according to the equation proposed by Tyrrel and Reid (1965): MCCTS
%= [12.3 x fat yield (kg day-1)] + [6.56 x non-fat solids
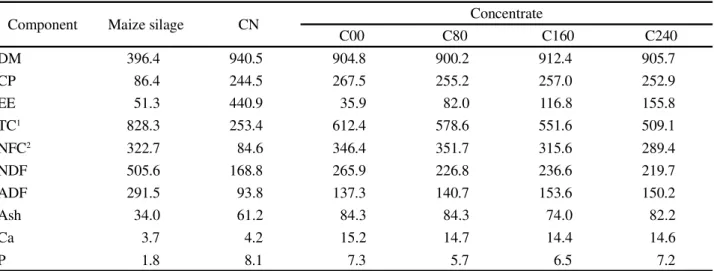
Table 1 - Chemical composition (g kg-1DM) of maize silage, cashew nut (CN) and experimental concentrates, on dry matter basis
C00: concentrate with no CN; C80: 80 g of CN kg-1 of concentrate; C160: 160 g of CN kg-1 of concentrate; C240: 240 g of CN kg-1 of concentrate. DM: Dry matter; CP: Crude protein; EE: Ether extract; TC: Total carbohydrates; NFC: Non-fibrous carbohydrates; NDF: Neutral detergent fiber; ADF: Acid detergent fiber; Ca: Calcium; P: Phosphorus.1%TC = 100 – (%CP + %EE + %Ash), according to Sniffenet al. (1992).2%NFC = 100 – (%CP + %NDF + %EE + %Ash), according to NRC (2001)
Component Maize silage CN Concentrate
C00 C80 C160 C240
DM 396.4 940.5 904.8 900.2 912.4 905.7
CP 86.4 244.5 267.5 255.2 257.0 252.9
EE 51.3 440.9 35.9 82.0 116.8 155.8
TC1 828.3 253.4 612.4 578.6 551.6 509.1
NFC2 322.7 84.6 346.4 351.7 315.6 289.4
NDF 505.6 168.8 265.9 226.8 236.6 219.7
ADF 291.5 93.8 137.3 140.7 153.6 150.2
Ash 34.0 61.2 84.3 84.3 74.0 82.2
Ca 3.7 4.2 15.2 14.7 14.4 14.6
P 1.8 8.1 7.3 5.7 6.5 7.2
Ingredient Diets1
0 80 160 240
Corn silage 500.0 500.0 500.0 500.0
Cashew nut 0.0 37.6 75.3 112.9
Ground corn 181.5 145.8 131.3 124.4
Soybean meal 180.9 165.5 146.8 128.5
Citrus pulp 113.3 129.5 123.9 108.2
Urea 3.2 3.2 3.2 3.2
Premix min.-vit.2 6.4 6.4 6.5 6.5
Sodium chloride 2.7 2.7 2.7 2.7
Limestone 3.2 3.2 2.7 4.3
Calcium bicarbonate 2.7 2.7 2.7 2.7
Component3
DM 501.8 512.5 500.2 494.0
CP 157.7 162.2 153.6 145.9
EE 31.6 46.0 68.9 73.1
NFC4 296.4 280.7 276.3 278.2
NDF 455.1 458.5 443.0 440.3
ADF 298.7 280.7 276.3 278.2
Ash 59.2 52.6 58.2 62.5
Ca 7.4 7.8 7.8 7.2
P 3.0 3.4 3.4 3.1
Table 2 -Composition and nutritional value (g kg-1) of experimental diets with different inclusion levels of cashew nut (CN) in the
concentrate portion, on dry matter basis
The analysis of urea nitrogen was carried out using the colorimetric enzymatic method, with the use of a ChemSpec 150 apparatus (Bentley Instruments, Chaska, EUA). Analyses of the profile of fatty acids in the milk were performed according to the extraction and methylation
technique, described by Chouinardet al. (1999).
The results were statistically analyzed by using PROC GLM (General Linear Models) in the SAS software. Statistical analysis for achieving linear and quadratic contrasts was carried out by observing the response types of the variables to the assessed diets. Regression analyses were performed to achieve estimates of the assessed responses for the levels of CN not used in the experiment. PROC REG in the SAS software was used for this estimative.
The effects of including cashew nut into the milk production and composition were evaluated according to
the following statistical model: Yijkl =m + Qi + Pj + A/Qk(i)+
Tl +eijkl, where: Yijkl = response of k animal in the j period
within i square under diet 1;m = overall mean; Qi= square
effect; i = 1;2; Pj= effect of the j period; j = 1; 2; 3; 4; A/
Qk(i) = effect of k animal; k = 1; 2; 3; 4; 5; 6; 7; 8, within i
square; Tl = effect of the diet 1; l = 1; 2; 3; 4;eijkl= random
error on k animal, in the j period of 1 diet.
The profile of long chain fatty acids was transformed into an (x + 1) logarithm for comparison among means due to the high coefficient of variation observed. Non-parametric analysis was performed
for C18:1 Trans-10, C18:1 Trans-11 and C18:2 Trans-10
cis-12, using the Wilcoxon test at the level of 0.05 of probability.
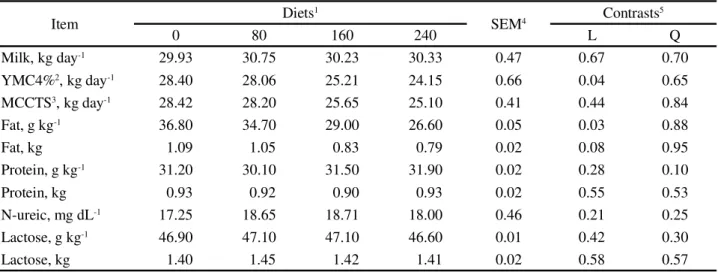
Table 3 - Yield and composition of the milk from dairy cows fed with different levels of cashew nut (CN) in the concentrate portion of the diet
10: Diet with no CN; 80: Diet with 80 g of CN kg-1 of concentrate portion; 160: Diet with 160 g of CN kg-1 of concentrate portion; 240: Diet with 240 g of CN kg-1 of concentrate portion.2YMCF4%: Milk corrected for 4% fat;3MCCTS: milk corrected for content of total solids.4SEM: Standard error of the mean.5Contrasts (p value): L = linear effect; Q = quadratic effect
Item Diets
1
SEM4 Contrasts
5
0 80 160 240 L Q
Milk, kg day-1 29.93 30.75 30.23 30.33 0.47 0.67 0.70
YMC4%2, kg day-1 28.40 28.06 25.21 24.15 0.66 0.04 0.65
MCCTS3, kg day-1 28.42 28.20 25.65 25.10 0.41 0.44 0.84
Fat, g kg-1 36.80 34.70 29.00 26.60 0.05 0.03 0.88
Fat, kg 1.09 1.05 0.83 0.79 0.02 0.08 0.95
Protein, g kg-1 31.20 30.10 31.50 31.90 0.02 0.28 0.10
Protein, kg 0.93 0.92 0.90 0.93 0.02 0.55 0.53
N-ureic, mg dL-1 17.25 18.65 18.71 18.00 0.46 0.21 0.25
Lactose, g kg-1 46.90 47.10 47.10 46.60 0.01 0.42 0.30
Lactose, kg 1.40 1.45 1.42 1.41 0.02 0.58 0.57
RESULTS AND DISCUSSION
The addition of CN to the diet maintained milk yield and milk yield corrected for total solids (MCCTS), regardless of the level of inclusion in the concentrate portion of the diet (Table 3).
Milk yield corrected for 4% of fat (YMC4%) and fat content in the milk linearly decreased as greater proportions of CN were included in the concentrate, as
shown by the following equations: YMC4%, kg day-1 =
28.87 – 0.02x (R2= 0.90; p<0.05) and Fat, g kg-1 = 37.20 –
0.045x (R2= 0.97; p<0.05), where x = the inclusion level
of CN in the concentrate. The regression analysis showed
that for every inclusion of 10 g of CN kg-1 of concentrate,
milk fat decreased by 0.045 g kg-1. The increment in the
content of lipids tended to linearly decrease the production of milk fat (p=0.08) with the inclusion of increasing levels of CN in the concentrate. Milk fat production was
reduced by 0.014 kg day-1 for every 10 g of CN kg-1 of
concentrate, as demonstrated by the regression equation:
Fat, kg = 1.11 – 0.014x (R2 = 0.91; p<0.05), where: x =
the inclusion level of CN in the concentrate.
The inclusion of lipids in the diet for dairy cows may reduce the fat content in the milk due to modifications in the ruminal environment, such as an inhibitory effect on dry matter digestibility, influencing the acetic acid supply,
which is the main source of carbon forde novo synthesis in
the mammary gland (GLASSER; FERLAY; CHILLIARD,
2008). However, Pimentelet al. (2012) observed that the
caused by the increase in the supply of unsaturated fatty acids (UFA), as expressed by the ratio of 3.68 between unsaturated and saturated fatty acids in CN. The negative influence of UFA on the synthesis of milk by reducing the final stages of ruminal biohydrogenation increased
the amount of C18:1Trans-18 unsaturated fatty acid, which
are transformed into C18:2Trans-10 cis-12 in the mammary
gland and inhibit lipogenesis (BAUMAN; HARVATINE; LOCK, 2011).
Halmemies-Beauchet-Filleau et al. (2011) found
no increase in milk production and composition from dairy cows fed red clover silage-based diets and plant oils or camelina expeller. Although, as observed by Harvatine and Allen (2006), the increase in the supply of UFA
reduced milk fat synthesis by 0.27 kg day-1, possibly due
to the inhibition of ruminal biohydrogenation caused by the fatty acid intermediates.
The production of milk protein did not present significant variations (p>0.05) among the diets.
The content of milk protein with 240 g of CN kg-1 of
concentrate was 31.9 g kg-1, a value close to the ideal
value (32.0 g kg-1) set for the Holstein breed. However,
the percentage of milk protein presented a quadratic trend (p=0.10) with the addition of CN to the concentrate. Although in the present study was not observed influence of the byproduct in milk protein content, according to De Peters and Cant (1992), a reduction around 0.1 to 0.3 percentage units can be expected in this paramenter with the addition of lipid to the diet. The failure of the ruminal microorganisms to use lipids as a source of energy for their growth may explain this reduction in the synthesis of milk protein, since the availability of amino acids becomes insufficient for the synthesis of protein in the
mammary gland (SNIFFENet al., 1992).
Contents of N-urea in the milk were not influenced by the diets (p>0.05), despite being considered high with
a mean value of 18.15 mg dL-1. Although the diets did not
present high contents of CP (146.0 to 162.0 g kg-1DM),
the mean value of milk N-urea was above the target value
(>16 mg dL-1). According to Butler, Calaman and Beam
(1996), negative effects on reproductive performance of dairy cows occur when concentrations of N-urea reach
values higher than 19.0 mg dL-1 in the milk.
Although milk N-urea increased, there was no negative effect on milk protein, showing that there was an adequate supply of amino acids for the mammary
gland. Pimentel et al. (2012) presented data related
to the concentrations of purine derivatives in urine of
cows fed cashew nut (0, 80, 160 and 240 g of CN kg-1 of
concentrate), wherein the excretions of allantoin and uric acid were not influenced by the addition of the byproduct, however showed high ratio allantoin:creatinine (mean
of 4.16), suggesting suitable microbial growth, which possibly increased the intestinal microbial protein flow.
The content and production of lactose were not influenced by increasing proportions of CN in the concentrate portion of the diet, which is in agreement with the statement that this component is little influenced by modifications in the diet, and is one of the most constant constituents in the milk.
Oliveira et al. (2007) did not find alterations
in milk production and milk production corrected for 3.5% fat, but observed a reduction in the production and concentration of milk fat when supplying diets with
approximately 5 g of fatty acids kg-1 of DM. This author
also obtained lower concentrations of total solids and urea nitrogen in the milk.
In the early 1980s, there was a clear realization that diet manipulation changes milk composition, being milk fat the most sensitive component, which could be changed over a range of 3 percentage units, while lactose content could not be altered, only under unusual feeding situations. Concerning milk protein, the response to diet changes would be higher (over a 0.5-percentage unit range) than lactose, but less than fat. Until nowdays, the studies conducted to detect the changes in this three components, observe that the greatest influence of diet occurs in milk fat and fatty acid composition (JENKINS; McGUIRE, 2006).
The inclusion of CN in the concentrate linearly decreased (p<0.05) the concentration of short chain fatty
acids (SCFA; C8:0to C12:1), as well as the total of short
chain fatty acids (Total C4:0to C12:1; Table 4). The diet with
240 g of CN kg-1 of concentrate portion was responsible
for a reduction of 383.2 g 100 g-1 in the concentration of
short chain fatty acids in milk fat.
The total C4:0–C12:0 can be estimated from the
following regression equation: Total C4:0–C12:0 = 15.43 –
0.25x (R2 = 0.99; p<0.05), where x = the inclusion level of
CN in the concentrate. According to the previous equation,
a decrease of 0.25 mg g-1 in the total SCFA was estimated
for every 10 g of CN kg-1 of concentrate. The reduction
in the concentration of SCFA acids was followed by an
increase in the contents of C18:2Trans-10 cis-12.
The medium chain fatty acids (MCFA) C13:0, C14:1,
C16:1, C17:0 and C17:1 were not influenced by the addition
of the by product, with mean values of 0.31; 8.20; 11.55;
3.94 and 2.01 mg g-1, respectively. However, C
14:0, C15:0
and C16:0 had their concentrations reduced at all inclusion
levels of lipids into the diet (p≤0.01). These results were
The two greatest inclusion levels of CN presented
the greatest concentration means of stearic acid (C18:0),
with values of 144.72 and 155.07 mg g-1, for the levels of
160 and 240 g of CN kg-1 of concentrate, respectively. This
increase may point to the saturation of biohydrogenation
reactions in milk fat (CHILLIARD et al., 2007). The
supplied diets did not have an effect on the contents of
C18:1Trans-10, whereas the inclusion of CN at its highest
proportion (240 g of CN kg-1 of concentrate) increased
the concentration of C18:1Trans-11 in the milk from
11.56 to 31.16 mg g-1 of fat. Average concentrations of
linoleic acid (C18:2) presented a linear pattern in response
to the increment of lipids in the diets of experimental
animals, whereas the contents of linolenic (C18:3) and
arachidonic (C20:0) acids showed an increased trend in
their concentrations due to the inclusion of CN in the
concentrate (p=0.06 and p=0.07, respectively for C18:3
and C20:0).
The lipids added to the diet caused a linear increase in the total concentrations of long chain fatty
acids (LCFA; 436.07; 511.21 and 544.43 mg g-1 of fat,
respectively, for the levels of inclusion of 80, 160 and
240 g of CN kg-1 of concentrate portion) in relation to the
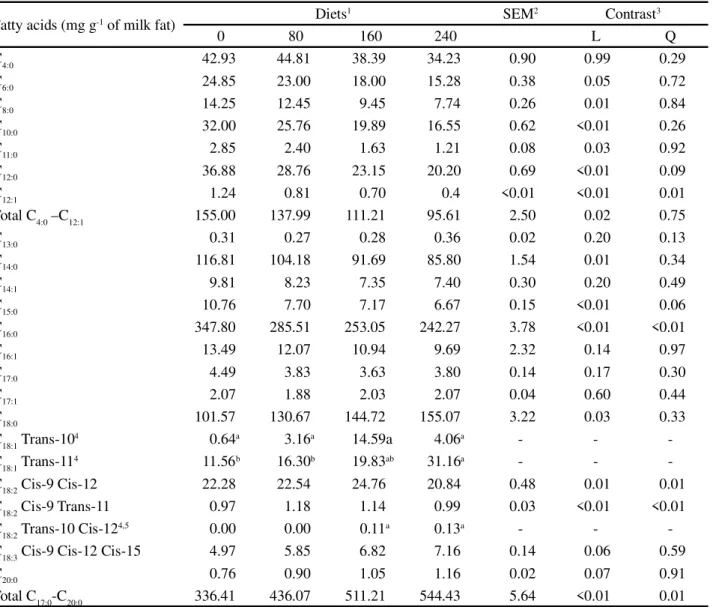
a,bMeans followed by different letters in the same row are statistically significant (p<0.05).10: Diet with no CN; 80: Diet with 80 g of CN kg-1 of concentrate portion; 160: Diet with 160 g of CN kg-1 of concentrate portion; 240: Diet with 240 g of CN kg-1 of concentrate portion.2SEM: Standard error of the mean.3Contrasts (p value): L = linear effect; Q = quadratic effect.4Non-parametric analysis. Test of Wilcoxon at the level of 0.05 of probability.5The zero values cannot be statistically analyzed due to the lack of variance. Comparison among means can be done only between the diets with 160 and 240 g of CN kg-1 of concentrate portion
Fatty acids (mg g-1 of milk fat) Diets
1 SEM2 Contrast3
0 80 160 240 L Q
C4:0 42.93 44.81 38.39 34.23 0.90 0.99 0.29
C6:0 24.85 23.00 18.00 15.28 0.38 0.05 0.72
C8:0 14.25 12.45 9.45 7.74 0.26 0.01 0.84
C10:0 32.00 25.76 19.89 16.55 0.62 <0.01 0.26
C11:0 2.85 2.40 1.63 1.21 0.08 0.03 0.92
C12:0 36.88 28.76 23.15 20.20 0.69 <0.01 0.09
C12:1 1.24 0.81 0.70 0.4 <0.01 <0.01 0.01
Total C4:0 –C12:1 155.00 137.99 111.21 95.61 2.50 0.02 0.75
C13:0 0.31 0.27 0.28 0.36 0.02 0.20 0.13
C14:0 116.81 104.18 91.69 85.80 1.54 0.01 0.34
C14:1 9.81 8.23 7.35 7.40 0.30 0.20 0.49
C15:0 10.76 7.70 7.17 6.67 0.15 <0.01 0.06
C16:0 347.80 285.51 253.05 242.27 3.78 <0.01 <0.01
C16:1 13.49 12.07 10.94 9.69 2.32 0.14 0.97
C17:0 4.49 3.83 3.63 3.80 0.14 0.17 0.30
C17:1 2.07 1.88 2.03 2.07 0.04 0.60 0.44
C18:0 101.57 130.67 144.72 155.07 3.22 0.03 0.33
C18:1 Trans-104 0.64a 3.16a 14.59a 4.06a - -
-C18:1 Trans-114 11.56b 16.30b 19.83ab 31.16a - -
-C18:2 Cis-9 Cis-12 22.28 22.54 24.76 20.84 0.48 0.01 0.01
C18:2 Cis-9 Trans-11 0.97 1.18 1.14 0.99 0.03 <0.01 <0.01
C18:2 Trans-10 Cis-124,5 0.00 0.00 0.11a 0.13a - -
-C18:3 Cis-9 Cis-12 Cis-15 4.97 5.85 6.82 7.16 0.14 0.06 0.59
C20:0 0.76 0.90 1.05 1.16 0.02 0.07 0.91
Total C17:0-C20:0 336.41 436.07 511.21 544.43 5.64 <0.01 0.01
control diet (336.41 mg g-1 of fat). As most fatty acids in CN are LCFA, it is likely that the supply of the diet with greater additions of this byproduct had a greater influence on the increase in LCFA in the milk fat after being biohydrogenated or not by ruminal microorganisms. Yan et al. (2011) observed that the addition of extruded
soybeans increased the contents of C18:0, C18:2 and C18:3in
the diets, but the C16:0, C18:1, C18:2 Cis-9 Trans-11, C20:0,
C20:2, C22:1 and C24:0 contents were decreased in the milk.
According to the present study, these authors observed that feeding extruded soybeans reduced the proportion of both SCFA and MCFA, and increased the LCFA content in milk fat, being soybean and cashew nut sources of dietary fatty acids.
About 50% of the fatty acid in the milk are from LCFA in the diet and from biohydrogenation of lipids by ruminal bacteria, probably because of the profile of fatty
acids in CN (12.26% of C18:0, 57.39% of C18:1, 20.71% of
C18:2and 0.22% of C18:3). The supply of CN produced a
milk fat profile with lower proportions of C16:0 and with
greater proportions of long chain fatty acids (C18:0, C18:1,
C18:2and C18:3), which are considered more desirable for
human health. The increasing inclusion of CN in the diet
also tended to increase the concentration of C20:0.
CONCLUSION
The inclusion of 24% of cashew nut in the concentrate portion of the diet, maintains milk production, reduces milk fat content and together with the reduction in the concentration of short chain fatty acids and the increase in the concentrations of long chain fatty acids, provide a greater nutraceutical value to milk, making the use of cashew nut an excellent alternative for obtaining milk with more benefits to human health.
ACKNOWLEDGMENTS
The authors wish to thank the Banco do Nordeste do Brasil for financial support and the Escola de Veterinária, UFMG, for the opportunity to develop the experimental work. The first author benefited from a grant from the Coordenação de Aperfeiçoamento de Pessoal de Nível Superior (Capes).
REFERENCES
BAUMAN, D. E.et al. Major advances associated with tha biosynthesis of milk.Journal of Dairy Science, v. 89, n. 4, p. 1235-1243, 2006.
BAUMAN, D. E.; HARVATINE, K. J.; LOCK, A. L. Nutrigenomics, rumen-derived bioactive fatty acids, and the regulation of milk fat synthesis.Annual Review of Nutrition, v. 31, p. 299-319, 2011.
BENJAMIN, S.; SPENER, F. Conjugated linoleic acids as functional food: an insight into their health benefits. Nutrition and Metabolism, v. 6, p. 36-50, 2009.
BUTLER, W. R.; CALAMAN, J. J.; BEAM, S. W. Plasma and milk urea nitrogen in relation to pregnancy rate in lactating dairy cattle.Journal of Animal Science, v. 74, n. 4, p. 858-865, 1996.
CHILLIARD, Y. et al. Diet, rumen biohydrogenation and nutritional quality of cow and goat milk fat. European Journal of Lipid Science and Technology, v. 109, n. 8, p. 828–855, 2007.
CHOUINARD, P. Y. et al. Conjugated linoleic acid alter milk fatty acid composition and inhibit milk fat secretion in dairy cows.Journal of Nutrition, v. 129, n. 8, p. 1579-1584, 1999. DE PETERS, E. J.; CANT, J. P. Nutritional factors influencing the nitrogen composition of bovine milk: a review. Journal of Dairy Science, v. 75, n. 8, p. 2043-2070, 1992.
DEWHURST, R. J. et al. Increasing the concentrations of beneficial polyunsaturated fatty acids in milk produced by dairy cows in high-forage systems.Animal Feed Science and Technology, v. 131, n. 3/4, p. 168–206, 2006.
GLASSER, F.; FERLAY, A.; CHILLIARD, Y. Oilseed lipid supplements and fatty acid composition of cow milk: a meta-analysis.Journal of Dairy Science, v. 91, n. 12, p. 4687-4703, 2008.
HALMEMIES-BEAUCHET-FILLEAU, A.et al. Effect of plant oils and camelina expeller on milk fatty acid composition in lactating cows fed diets based on red clover silage. Journal of Dairy Science, v. 94, n. 9, p. 4413–4430, 2011.
HARVATINE, K. J.; ALLEN, M. S. Effects of fatty acid supplements on milk yield and energy balance of lactating dairy cows.Journal of Dairy Science, v. 89, n. 3, p. 1081-1091, 2006. JENKINS, T. C.; McGUIRE, M. A. Major advances in nutrition: impact on milk composition. Journal of Dairy Science, v. 89, n. 4, p. 1302-1310, 2006.
NATIONAL RESEARCH COUNCIL.Nutrient requirements of dairy cattle. 6. ed. rev. Washington, DC: National Academy of Science, 1989. 157 p.
NATIONAL RESEARCH COUNCIL. Nutrient
requirements of dairy cattle. 7. ed. rev. Washington, DC: National Academy of Science, 2001. 381 p.
O´DONNELL-MEGARO, A. M. et al. Effect of linoleic acid and dietary vitamin E supplementation on sustained conjugated linoleic acid production in milk fat from dairy cows.Journal of Dairy Science, v. 95, n. 12, p. 7299-7307, 2012.
PARODI, P. W. Milk fat in human nutrition. The Australian Journal of Dairy Technology, v. 59, n. 1, p. 3-59, 2004. PIMENTEL, P. G. et al. Parâmetros da fermentação ruminal e concentração de derivados de purina de vaca em lactação alimentadas com castanha de caju. Arquivo Brasileiro de Medicina Veterinária e Zootecnia, v. 64, n. 4, p. 959-966, 2012.
SNIFFEN, C. J.et al. A net carbohydrate and protein system for evaluating cattle diets: II. Carbohydrate and protein availability.Journal of Animal Science, v. 70, n. 11, p. 3562-3577, 1992.
TYRRELL, H. F.; REID, J. T. Prediction of the energy value of cow’s milk.Journal of Dairy Science, v. 48, n. 9, p. 1215-1223, 1965. VYAS, D.; TETER, B. B.; ERDMAN, R. A. Milk fat responses to dietary supplementation of shortand medium-chain fatty acids in lactating dairy cows.Journal of Dairy Science, v. 95, n. 9, p. 5194-5202, 2012.