Consumers´wine knowledge and perceptions
about wine labels and packaging
Catarina Pitta Esteves Pires Lopes
Dissertation presented as the partial requirement for
obtaining a Master's degree in Information Management
NOVA Information Management School
Instituto Superior de Estatística e Gestão de Informação
Universidade Nova de LisboaCONSUMERS´WINE KNOWLEDGE AND PERCEPTIONS ABOUT WINE
LABELS AND PACKAGING
by
Catarina Pitta Esteves Pires Lopes
Dissertation presented as the partial requirement for obtaining a Master's degree in Information Management, with a specialization in Marketing Intelligence Advisor: Cristina Isabel Galamba de Oliveira de Costa MarreirosMay 2020
iii
ACKNOWLEDGEMENTS
Firstly, I would like to express my gratitude to my thesis advisor, Professor Cristina Galamba Marreiros, for all the support and rigor through the whole process. Particularly, I am grateful for all the insights and quality guidance that she provided me with.
Secondly, my sincere thanks to Rita Rivotti and João Grave, who directly contributed to this thesis with their knowledge, helping me to adapt my research (survey) to the Portuguese market. Their help was unparalleled for the conclusion of this work.
I am also thankful for my family and friends´ support and for their patience at the most critical phases, helping me to stay motivated and never give up. Specially, I want to thank my sister Sofia for always helping with my doubts.
Finally, I would like to give a special thanks to all the people who collaborated in this study by answering the online survey.
iv
ABSTRACT
This study intended to understand how consumers with different types of wine knowledge perceive wine labels and packaging.
Firstly, the concept of wine consumer knowledge was investigated following the typology of Ellis & Caruana (2018). The typology splits consumers in four groups: Experts, Snobs, Modest and Novices. Secondly, the wine packaging was analyzed following Silayoi & Speece´s (2007) approach: the wine label information was analysed as the primary informational element; and label design, shape, size and type of closure were analysed as the primary visual elements. The data was gathered through an online survey conducted with 306 Portuguese wine consumers. The analysis of the results involved measures of descriptive statistics and inferential statistics.
The findings of this study showed that the importance of wine label information is significantly higher for the Experts than for the Neophyte and Modest groups. Additionally, there were statistically significant differences on the importance of the informational elements on wine label for the four groups. However, the same cannot be concluded about the perceptions and acceptance of visual elements on wine packaging. In fact, results showed that there were no statistically significant differences among the four groups.
For those working in the marketing field, especially in the wine sector, these results provide relevant insights: consumers value information on the wine label in the purchase process; despite the increasing appearance of innovative packaging, consumers prefer labels with traditional designs and bottles with cork; when creating wine labels, marketers should give more attention to the Expert group compared to other groups.
KEYWORDS
v
RESUMO
O presente estudo pretendeu perceber como os consumidores com diferentes tipos de conhecimento sobre vinho percepcionam os rótulos e embalagens de vinhos.
Em primeiro lugar, o conceito de conhecimento do consumidor de vinho foi investigado de acordo com a tipologia de Ellis e Caruana (2018). Esta tipologia divide dos consumidores em quatro grupos: Experts; Snobs; Modestos e Noviços. Em segundo lugar, a embalagem de vinho foi analisada seguindo a abordagem de Silayoi & Speece (2007): a informação do rótulo do vinho foi analisado como o principal elemento informativo; e o design do rótulo, forma, tamanho e tipo de fecho da garrafa foram analisados como elementos visuais primários. Os dados foram recolhidos através de um questionário online realizado a 306 consumidores de vinho portugueses. A análise dos resultados envolveu medidas de estatísticas descritiva e estatística inferencial.
Os resultados deste estudo mostraram que a importância da informação no rótulo do vinho é significativamente maior para os Experts em comparação com os grupos Noviços e Modestos. Além disso, encontraram-se diferenças estatisticamente significativas na importância dos elementos informativos do rótulo do vinho para os quatro grupos. No entanto, não se pode concluir o mesmo relativamente às percepções e aceitação dos elementos visuais das embalagens de vinho. De facto, os resultados não mostram diferenças estatisticamente significativas entre os quatro grupos nestes factores.
Para aqueles que trabalham na área de marketing, especialmente no sector vinícola, estes resultados fornecem informações relevantes: os consumidores valorizam a informação no rótulo do vinho no processo de compra; apesar do crescente aparecimento de embalagens inovadoras, os consumidores preferem rótulos com designs tradicionais e garrafas com rolha de cortiça; ao criar rótulos, os profissionais de marketing devem dar mais atenção ao grupo dos Experts em comparação com os restantes grupos.
PALAVRAS-CHAVE
vi
TABLE OF CONTENTS
1. INTRODUCTION ...
11.1. Background and problem identification ... 1
1.2. Study objectives ... 2
1.3. Study organization ... 2
2. LITERATURE REVIEW ...
42.1. Consumer product knowledge ... 4
2.1.1. Consumer wine knowledge ... 5
2.1.2. Wine knowledge typology ... 6
2.2. Packaging and labels ... 8
2.2.1. Functions and elements... 8
2.2.2. Wine packaging and label ... 9
2.2.2.1. Informational elements on wine packaging ... 10
2.2.2.2. Visual elements on wine packaging ... 11
2.3. Research questions and conceptual model ... 13
3. METHODOLGY ...
153.1. Research design ... 15
3.2. Measurement of variables ... 15
3.3. Data collection ... 19
3.4. Data analysis ... 20
4. RESULTS AND DISCUSSION ...
224.1. General sample characteristics ... 22
4.2. Consumers´ perceptions of wine labels and packaging ... 24
4.2.1. Importance of informational elements on wine label ... 24
4.2.2. Attitudes and perception of visual elements on wine packaging ... 25
4.2.3. Acceptance of visual elements on wine packaging ... 27
4.3. Consumers´ wine knowledge and perceptions of wine labels and packaging ... 28
4.3.1. Wine knowledge typology: subjective knowledge and objective knowledge ... 28
4.3.2. Consumers’ wine knowledge and perceived importance of wine label informational elements ... 30
4.3.3. Consumers’ wine knowledge and attitude towards visual elements on wine packaging .... 32
vii
5. CONCLUSION ...
345.1. Main conclusions and implications of the research ... 34
5.2. Limitations and future research ... 35
6. BIBLIOGRAPHY ...
377. APPENDIX ...
44Appendix 1: Online Survey ... 44
Appendix 2: Repeated Measures ANOVA for attitude towards wine label design ... 52
Appendix 3: Repeated Measures ANOVA for attitude towards shape, size and type of closure ... 55
Appendix 4: Repeated Measures ANOVA for acceptance of wine label ... 58
Appendix 5: One Sample T-test for acceptance of wine label design ... 59
Appendix 6: Repeated Measures ANOVA for acceptance of shape, size and type of closure ... 60
Appendix 7: One Sample T-test for acceptance of shape, size and type of closure ... 61
Appendix 8: Pearson´s correlation (Objective knowledge and subjective knowledge) ... 62
Appendix 9: Chi-Square Test of Independence (Wine Typology Demographics Characteristics) ... 63
Appendix 10: One-way ANOVA ... 65
Appendix 11: MANOVA ... 66
a) Consumers´ wine knowledge and perceived importance of wine label ... 66
b) Consumers’ wine knowledge and attitude towards labels design ... 68
c) Consumers’ wine knowledge and attitude towards shape, size and type of closure ... 68
d) Consumers’ wine knowledge and acceptance of labels design ... 69
viii
TABLE OF FIGURES
Figure 1 - Wine knowledge types, Ellis & Caruana (2018)………...6
Figure 2 - Conceptual model of the study………14
Figure 3 - Wine label designs, Sherman & Tuten (2011) - Adapted version……….18
Figure 4 - Shape, size and type of closure, Nesselhauf et al. (2017) - Adapted version………...18
Figure 5 - Respondents´wine consumption frequency………23
Figura 6 - Responsible for wine purchase……….23
ix
LIST OF TABLES
Table 1 - Subjective wine knowledge scale, Flynn and Goldsmith (1999) - Adapted version………..16
Table 2 - Objective wine knowledge test questions - Adapted version………..16
Table 3 - Value the overall importance of information on wine labels, Tootelian & Ross (2000)…….…17
Table 4 - Informational elements on wine label, Thomas & Pickering (2003) - Adapted version…….…17
Table 5 - Sample characteristics (N=306)……….……18
Table 6 - Frequency of importance of information on wine label………24
Table 7 - Mean and standard deviation for informational elements on wine label………25
Table 8 - Mean and standard deviation for attitudes towards wine labels designs………26
Table 9 - Mean and standard deviation for attitudes towards shape, size and type of closure……….…27
Table 10 - Mean and standard deviation for the acceptance of labels design………...28
Table 11 - Mean and standard deviation for the acceptance of shape, size and type of closure……….28
Table 12 - Mean and standard deviation for subjective wine knowledge……….29
Table 13 - Frequency for objective wine knowledge ……….29
Table 14 - Subjective knowledge Cronbach´s alpha………..29
Table 15 - Consumer wine knowledge typology………..30
Table 16 - Consumers´ wine knowledge and perceived importance of informational elements on label……….………32
1
1. INTRODUCTION
This chapter splits in three main sections. Firstly, it conceptualizes the research topic: consumers wine knowledge and perception about wine packaging and labels. Secondly, it identifies the study´s objectives. And finally, it introduces the study organization.
1.1. Background and problem identification
The global wine industry is changing in terms of consumption. Since 2014 it has been observed a steady growth in global consumption (OIV, 2018). According to the annual report of the International Organization of Vine and Wine, in 2018, Portugal was the country with the highest per capita consumption of wine in the world, with an average of 62 liters consumer per person per year. Indeed, this increase of consumption “has resulted in a dramatic rise in the number of wineries, wine brands, labels, bottle shapes and colors, styles of closures, regional designations, and grape varietals”(Barber & Almanza, 2006, p.84).
In fact, the strong competition in the wine market has forced wineries and retailers to re-think their marketing strategies taking into account the heterogeneity of consumer preferences (Pomarici, Lerro, Chrysochou, Vecchio, & Krystallis, 2017).
According to Ellis & Mattison Thompson (2018) wine is a complex and information-intensive product with a multitude of attributes, both intrinsic - the physical-chemical aspects of the wine, which are unique in each product and cannot be modified without changing the product (Boncinelli, Dominici, Gerini, & Marone, 2019) - and extrinsic - the external aspect of the product (Ellis & Mattison Thompson, 2018). Due to this complexity, it is crucial to understand which type of wine attributes are best valued by the different groups of consumers in order to target various market segments effectively (Velikova, Howellv, & Dodd, 2015).
Taking into account that consumers are not typically able to taste wine in a retail store, extrinsic attributes such as packaging and labels have an important role on consumers´ decision (Lockshin, Jarvis, d’Hauteville, & Perrouty, 2006). Although is it possible to find some studies about the influence of wine packaging and labels on consumers perceptions (e.g. Barber & Almanza, 2006; Henley, Fowler, Yuan, Stout, & Goh, 2011; Sherman & Tuten, 2011; Rocchi & Stefani, 2006;), there seems to exist little research on this field focusing on the perceptions of consumers according to their knowledge about wine. Consumer´s knowledge plays a key role on consumer purchase behaviour (Vigar-Ellis, Pitt, & Berthon, 2015); indeed what consumers know about a product affects many aspects of their perceptions and purchase behaviour.
2 Ellis & Caruana (2018) proposed a wine knowledge typology based on the relation between two different types of knowledge, objective and subjective knowledge, with the aim of providing a useful basis for segmentation of the wine market. Based on that typology, this research extends existing literature by investigating the relationship between consumers wine knowledge types and their perception of wine packaging and labels. Furthermore, this investigation will help marketers who work in wine sector, to refine their strategies by adjusting the attributes of the packaging and labels when targeting segments of the market with different types of wine knowledge. Actually, from a marketer´s point of view, it is also interesting to determine which attributes should be present on the label and to understand the impact of innovative wine packaging considering the segment´s preferences. This is especially important because the wine market is increasingly more mature and, as a response, brands need to invest on innovative packaging to gain competitive advantage more than ever.
In short, the question that drives the research efforts of this dissertation is: How consumers with different types of wine knowledge differ on their perceptions regarding wine packaging and labels?
1.2. Study objectives
The main objective of the study is, therefore, to understand consumers´ perceptions of wine label and packaging considering their type of wine knowledge.
In order to reach the main objective, some specific objectives must be attained:
Understand the different types of consumers´ wine knowledge according to Ellis & Caruana (2018) typology, and their main characteristics as a segment;
Analyse which are the main elements in packaging and labels valued by consumers according to their wine knowledge type;
Understand if consumer´s perceptions and attitudes regarding wine packaging and labels vary among consumers with different types of wine knowledge;
Evaluate the acceptance of innovative wine packaging among consumers with different types of wine knowledge.
1.3. Study organization
This dissertation is organised in five main chapters: introduction, literature review, methodology, results and discussion, and conclusion.
After the introduction that contextualizes the present study and its objectives, the second chapter consists of a literature review, where the topics regarding consumer wine knowledge and wine
3 packaging and labels are discussed. Additionally, the research questions and a conceptual model are presented.
The following chapter is related with the methodology – it describes the different phases of the investigation, the measurement of the study´s variables, the data that was collected and also explains how the data was analysed.
The fourth chapter presents the analysis of the main results of the study, using both descriptive statistics and inferential statistics. Firstly, it describes the general sample characteristics, after analysis respondents´ perceptions of informational and visual elements on wine packaging, and lastly develops the wine knowledge typology and provides answers to the research questions.
Finally, the last chapter highlights the main conclusions of the study, as well as its limitations and some suggestions for future researches.
4
2. LITERATURE REVIEW
This chapter aims to review some existing literature on two main topics: consumers wine knowledge and wine packaging and labels. Firstly, it introduces the concept of consumer product knowledge, followed by an overview of how it applies specifically to the wine consumer and, finally, it covers the wine knowledge typology. The second part of the chapter explains the importance of packaging elements and functions, and then outlines how these visual and informational elements are applied in the wine packaging market. Lastly, research questions and a conceptual model are developed for the present research.
2.1. Consumer product knowledge
The concept of consumer product knowledge has been discussed in several research studies, particularly regarding the role of product knowledge in distinct aspects of consumer behaviour. The majority of these studies argue that consumers with high and low product knowledge have different ways of making decisions, evaluations and searching and processing information (e.g. Alba & Hutchinson, 1987; Bettman & Park, 1980; Brucks, 1985; Lee & Lee, 2011; Rao & Monroe, 1988; Sujan, 1985).
Indeed, consumer product knowledge is the amount of information hold in consumer´s memory and their self-perception about their product knowledge as well as their familiarity and experience with a product before an external search occurs (Alba & Hutchinson, 1987; Brucks, 1985; Rao & Sieben, 1992). Consumer knowledge can be conceptualized and measured according to three different perspectives: familiarity (Alba & Hutchinson, 1987; Rao & Monroe, 1988), objective knowledge and subjective knowledge (Brucks, 1985). Familiarity is defined “as the number of product-related experiences that have been accumulated by the consumer” (Alba & Hutchinson, 1987, p.412). In fact, is familiarity, or past experience with the product, that sets the foundation for both objective and subjective knowledge (Dodd, Laverie, Wilcox, & Duhan, 2005).
The present research focuses particularly on objective and subjective consumer´s knowledge as concepts that measure consumer product knowledge. Objective knowledge is considered the accurate and factual knowledge that consumers hold in their memory (Brucks, 1985), in other words, is the “real knowledge” of consumers (Bruwer, Chrysochou, & Lesschaeve, 2017). This concept is strongly related with consumer´s expertise, which includes “cognitive structures and processes” (Alba & Hutchinson, 1987, p.411). In fact, a developed objective knowledge is what allows consumers to better analyse, elaborate and remember product information. Consumers with high objective knowledge with few resources and less cognitive effort can reach identical understanding of the product as consumers with lower levels of objective knowledge (Alba & Hutchinson, 1987).
5 The term subjective knowledge is defined as “consumer’s perception of the amount of information they have stored in their memory” (Flynn & Goldsmith, 1999, p. 59) and, in a certain way, subjective knowledge reflects the confidence that consumers have about their own knowledge (Alba & Hutchinson, 2000). It can be easily measured by challenging consumers to speak about their own perception of acquaintance with a specific subject (Ellis & Mattison Thompson, 2018), thus, there is no “correct” or “incorrect” answers (Ellis & Caruana, 2018). In contrast, to measure objective knowledge is crucial to develop a product-specific test, which includes correct and incorrect answers that define consumer´s knowledge (Forbes, Cohen, & Dean, 2008). Additionally, Guo & Meng (2008) state that when consumers evaluate or make decisions about products, subjective knowledge has more impact than objective knowledge.
In short, understanding the levels of consumer product knowledge allows a better understanding of consumer’s behaviour (Guo & Meng, 2008), particularly consumer’s decision-making.
2.1.1. Consumer wine knowledge
Wine is an information-intensive product (Pomarici et al., 2017), since it provides consumers with an immense amount of information such as origin, grapes, vintage, winemaker, and also information about what food it is best paired with (Vigar-Ellis, Pitt, & Berthon, 2015). A considerable number of marketing researchers have studied consumer knowledge on the wine sector, in particular regarding the topic of extrinsic and intrinsic cues used in consumers’ wine choice (Ellis & Caruana, 2018). For instance, Japanese consumers with higher levels of objective knowledge used more intrinsic cues (such as colour, flavour and variety of the wine) than extrinsic cues (such as price and packaging) in their purchase decisions (Bruwer & Buller, 2012) .
Other studies found out that more knowledgeable wine consumers consider a higher number of attributes as important when making a wine purchase than less knowledgeable consumers (Aurier & Ngobo, 1999; Charters, Lockshin, & Unwin, 1999; Rasmussen & Lockshin, 1999; Viot, 2012). Viot (2012) highlights that the most important attributes are not the same for the experts and the novices. The study demonstrates that experts give particular importance to attributes such as vintage and region of production in wine decision-making and novices are more concerned about price and vintage. A previous study has shown that colour, price and bottle design were the most valued attributes to the novices (Aurier & Ngobo, 1999).
Additionally, researchers noticed that low self-confidence consumers preferred modern colours and classic label information (Barber, Ismail, & Taylor, 2007; Lockshin & Corsi, 2012), contrarily to self-confident consumers, who are more likely to experiment products with a new label or packaging design (Bearden, Hardesty, & Rose, 2001; McClung, Freeman, & Malone, 2015). Orth & Krška (2001),
6 in a study in Czech Republic, concluded that less knowledgeable wine consumers considered medals displayed on bottles as a relevant indicator of wine quality and value.
To conclude, Velikova et al., (2015) highlight that experts and novices vary in the amount of content and organization of their wine knowledge, thus they value different wine attributes in their wine choices.
2.1.2. Wine knowledge typology
When it comes to wine knowledge typology, there is a useful and interesting way to segment the wine market. Vigar-Ellis, Pitt, & Berthon (2015) were the first to develop it, although, it was the study of Ellis & Caruana (2018) that described each segment with more detail. The segments resulted from the relationship between objective and subjective wine knowledge. In order to measure consumer´s objective wine knowledge, the authors applied the five-question test developed by Forbes et al. (2008), and to measure consumer´s perception of their own knowledge (subjective knowledge) the Flynn & Goldsmith (1999) nine-item scale was used. Hence, the authors identified four different wine knowledge types (figure 1).
MODEST NOVICES EXPERTS SNOBS O bj ec ve W in e Kn ow le dg e
Subjec ve Wine Knowledge High
Low High
The segment that has low level of objective and subjective wine knowledge is called Neophytes or Novices. Consumers in this segment are aware of their lack of wine knowledge although they like to consume wine (Ellis & Caruana, 2018). Novices are more likely to be young wine drinkers that perceive some risk in their wine purchasing decisions. Moreover, due to their lack of confidence, they will mostly rely on awards, promotions and fun and catchy labels that attract their attention (Ellis & Thompson, 2018). However, some researchers have noticed that consumers prefer wines with a
7 classic design packaging whether the segments are considered Novices or not (Campbell & Goodstein, 2001; Celhay & Passebois, 2011; Viot, 2012).
In contrast with Neophytes there are the wine Experts. These consumers differ in the amount, content and organization of their knowledge about wine (Velikova, Howell and Dodd, 2015; Bruwer, Chysochou and Lesschaeve, 2017) and also value different attributes when choosing a bottle of wine (Velikova et al., 2015; Viot, 2012). Experts have high levels of both objective and subjective wine knowledge; therefore, their memory structures are more complex and specific than in Novices (Alba & Hutchinson, 1987;Vigar-Ellis, Pitt, & Caruana, 2015). It is also known that experts are considered for opinion seekers a credible information source (Ellis & Caruana, 2018).
Snobs have high subjective but low objective wine knowledge. Consumers on this segment believe that they know a lot about wine but, actually, they do not – they are overconfident. Thus, this type of consumers tends to use wine terminology in order to demonstrate what they think they know (Ellis & Caruana, 2018). In fact, they are likely to be influenced by opinion leaders or wine awards, which gives them more confidence. This segment is more likely to be brand loyal, and thus less price sensitive (Ellis & Caruana, 2018).
Finally, the Modest have low subjective and high objective wine knowledge, contrary to Snobs (Ellis & Caruana, 2018). In other words, although this segment possesses wine knowledge, they lack confidence in the process of wine selection (Barber, Almanza and Donovan 2006), therefore, they are more conservative in their purchase behaviour (Ellis & Caruana, 2018).
It is important to point out that wine knowledge typology has been applied in recent wine studies (Ellis & Thompson, 2018; Robertson, Ferreira, and Botha, 2018;). In their study, Ellis & Thompson (2018) attempted to understand the effects of the combination of subjective and objective consumer´s wine knowledge and their influence on variety-seeking behaviour in wine purchasing. The researchers have concluded that Snobs and Experts are more variety seeking and, consequently, they give more attention to new wines in the market, in contrast to Modest and Neophytes who lack of self-confidence. Regarding the second study, Robertson, Ferreira, and Botha (2018) have examined the effects of consumer´s objective and subjective knowledge of wine on the relative importance of four extrinsic wine cues such as price, age, brand and region of origin. The attribute price was the most important among all segments. Snobs were the segment that ranked “expensive wines” as their least preferred level price. Furthermore, Experts and Modest considered the region of origin as the second most important attribute, highlighting “well-known region of origin” as the most preferred level of region. On the other hand, Novices and Snobs gave importance to wine brand, attaching a high level of preference for “well-known brands”. Finally, the attribute age represents the
8 less important attribute for Novices, Experts and Snobs.
According to the mentioned studies, the knowledge factor plays a key role on consumers’ choice and behaviour – indeed, what consumers know about a product affects many aspects of their perceptions and purchase behaviour. As such, this study aims to validate the impact of this variable on wine label and packaging, to do so, it is important to review the existing literature on this topic.
2.2. Packaging and labels
Packaging “includes all the activities of designing and producing the container for a product” (Kotler & Keller, 2012 p.346). According to Agariya, Johari, Sharma, Chandraul, & Singh (2012) packaging is defined as the wrapping material used to contain, identify, describe, protect, display and promote the product in order to make it marketable and clean. The authors further suggest that label is an important part of packaging.
Indeed, packaging and labels play a key role in consumer decision-making due to the impact it has on attracting consumer´s attention. Additionally, they also influence consumer´s perception of the product (Rundh, 2005). In order to have a deep understanding of packaging and labels is crucial to understand its functions and elements.
2.2.1. Functions and elements
Nowadays, packaging has a more extensive role than solely protecting a product. Indeed, when researchers study the functions of packaging, they are starting to relate both logistics and marketing (Prendergast & Pitt 1996). As a marketing tool, the objective is to promote the product, increasing visibility and provide customers with more information (Abdullah, Kalam, & Akterujjaman, 2013; Silayoi & Speece, 2007). There are some factors that contribute to the increased importance of packaging as a marketing tool, such as: “Self-service”- nowadays products are sold on a self-serve basis. Customers pass by an average of 300 products per minute in the halls of supermarkets and retails stores, therefore, packaging should be able to attract consumer´s attention; “Consumer affluence”- consumers are willing to pay more in order to have a more appealing packaging; “Company and brand image” - the importance that packaging has on consumer´s recognition of the company and brand; and “Innovation opportunity”- it means the possibility to get differentiation, uniqueness or innovation through packaging (Kotler & Keller, 2012). The authors (Kotler & Keller, 2012) further suggest that some marketers consider packaging as the fifth “P” of the marketing-mix, along with product, price, place and promotion, though the majority of marketers consider packaging as an integral part of the product.
9 Packaging as a marketing tool can be analysed according to two different perspectives: visual elements and informational elements (Silayoi & Speece, 2007). The visual elements include image, design, typography, colours, shape and size of packaging. However, in literature, the shape, size and material can also be named as structural components of packaging (Ampuero & Vila, 2006; Underwood, 2003). The informational elements are mainly related with product information and technologies used in the packaging (Silayoi & Speece, 2007). Essentially, consumers find most information elements on labels. The label is an essential part of the packaging that identifies the product or brand. Kotler & Keller (2012) highlight the label as the essential part of the product that describes the confection details.
The influence of packaging and its elements on consumer´s decision-making process can be demonstrated by evaluating the importance of its separate elements on consumer´s preferences (Ehsan & Lodhi, 2015). For instance, Ehsan & Lodhi, (2015) have studied the influence of brand packaging elements on the consumer´s buying behaviour of FMCG. The study found out that among the different aesthetic elements of packaging, colour is one of the most appealing elements to consumers and that the label of the product helps consumers to make choices and it also provides appropriate information such as the proper usage of the product.
Despite the overall importance of each element of packaging and label in FMCG products, the objective of this study is to better understand its importance on wine packaging and labels. Further on, the most relevant studies regarding this topic will be discussed.
2.2.2. Wine packaging and label
Packaging in the wine industry can be more complex compared to other fast moving consumer goods, due to the fact that wine packaging incorporates a large number of interrelated attributes, some of which are historical and traditional, such as the type of closure and the bottle shape (Atkin & Newton, 2012; Barber & Almanza, 2006). However, due to the growth in the number of wineries, more and more the wine producers want to stand out in the wine market and, to do so, packaging in wine industry is changing and traditional and historical attributes are taking innovative forms (Nesselhauf et al., 2017).
Following Silayoi & Speece (2007) packaging´s approach, this study examines wine label´s information as the primary informational elements, and label design, shape, size and bottle closure of wine packaging as the primary visual elements.
10 2.2.2.1. Informational elements on wine packaging
The informational elements on wine packaging are mostly present on the label. Indeed, the label is an important source of information for wine consumers as it provides them with both intrinsic and extrinsic information (Sherman & Tuten, 2011; Thomas & Pickering, 2003). Intrinsic information is mostly related to grape variety, region, producer, vintage and wine style. Extrinsic information is the information that marketers can control such as price, style of packaging and labelling, brand name (Quester & Smart, 1996; Sherman & Tuten, 2011) and QR codes (Higgins, McGarry Wolf, & Wolf, 2014).
Several studies have found that product information delivered via the label such as grape variety, brand name, and price are among the most important cues consumers use in wine choice decision (Barber & Almanza, 2006; Sherman & Tuten, 2011; Thomas, 2000; Thomas & Pickering, 2003). Additionally, other elements such as taste information and food parings are also seen as items consumers use to assess wine before purchase (Chaney, 2000; Henley et al., 2011; Lockshin & Corsi, 2012).
The information elements are usually present in both front and back labels. Usually, the front label foments consumers’ interest and the back label provides them with more detailed information (Rocchi and Stefani, 2006), including grape variety, alcohol percentage, volume in the bottle, and vintage (Henley et al., 2011). Baber & Almanza (2006) suggested that the front label cue “country of origin” is the most important attribute for consumers when purchasing a bottle of wine, followed by back labels cues such as “style of wine” and “description of wine”. Mueller, Lockshin, Saltman, & Blanford (2010) concluded that ingredient information on back labels had a large negative impact on consumers’ perceptions.
Apart from these traditional attributes, Higgins et al., (2014) highlighted the importance of QR codes on front and back labels as a cost-effective way to provide extra information about wine at the point of purchase. Higgins et al., (2014) concluded that QR codes are mostly used by consumers who usually seek specific information about wine such as its sustainability and local of production. The authors named these consumers as connoisseurs or experts.
Some studies have also suggested that label information might be more important for consumers than visual packaging attributes, such as the colour and shape of the bottle (Mueller, Lockshin, & Louviere, 2010; Puyares, Ares, & Carrau, 2010). However, “consumers are more likely to read the label to check that the product information is consistent with their needs if the package make it seem that the product is worth investigating more carefully” (Silayoi & Speece, 2007, p.1502).
11
2.2.2.2. Visual elements on wine packaging
Wine consumers are impacted by the total packaging design - label design, shape, size, colour of the bottle and type of closure (Barber & Almanza, 2006; Henley et al., 2011; Rocchi and Stefani, 2006). Wine label design
When developing a label design marketers should consider which colours, shapes, texture and fonts better characterize the wine brand (Barber et al., 2007; Lockshin & Corsi, 2012). For most consumers, package design is the reflection of the quality of the product and the brand (Barber & Almanza, 2006). For instance, in the old wine world a classic and traditional label was associated with high quality, therefore design changes were often avoided. Nowadays, wine labels are getting more sophisticated and wine producers have become more creative by using labels with modern and contemporary colours that combine exotic shapes and sizes (Barber et al., 2007; Jennings & Wood, 2013).
There are some studies that have used distinct classifications regarding wine label design. According to Sherman & Tuten (2011) there are three different genres of labels design: the Traditional design that uses classic and typical images of “coats-of-arms”, “chateaux” and “vineyards”; Contemporary design which focuses more on a “sense of style” and modern design; and finally Novelty labels that use “fun” as the main factor to attract the consumers, these labels are often characterized for having animals images (Sherman & Tuten 2011, p.223). Subsequently, the authors concluded that traditional labels designs are still associated with high quality wine while contemporary and specifically novelty styles are perceived as cheap and low quality. Furthermore, Orth & Malkewitz (2008) found out that “natural” and “delicate” wine designs were associated with high quality, in contrast to “massive” and “contrasting” designs that were perceived as inexpensive wine.
Therefore, it can be concluded that the evolution of wine packaging has not changed consumers’ perception of how label design should look like, and that they prefer traditional labels and colours over complex design with unusual colour combinations (Lockshin & Corsi, 2012). A recent study conducted by Tang, Tchetchik, & Cohen (2015) with Hong Kong Chinese consumers also confirmed the aforementioned. However, the authors verified that a specific segment of younger consumers prefer “elegant contemporary” labels. The label designs used on this study were similar to those used by Boudreaux & Palmer (2007) – “traditional with châteaux”, “modern classic”, “modern vibrant,” “modern contemporary”, and “elegant contemporary” (Tang et al., 2015, p. 15). Boudreaux & Palmer (2007) suggested that labels with images had the strongest effect, and that wine related images such as grapes had the highest score. On the other hand, labels that used unusual animals were the least
12 preferred. Additionally, Elliot & Barth's study (2012) showed that millennials tend to prefer non-traditional design opposing older consumers, who prefer non-traditional labels.
Finally, another classification of label design was provided by Barber et al., (2007). The authors classified label design as classic (formal and traditional in style and characteristics); modern (reflects recent times including elements of present lifestyle) and contemporary Art Deco (style of the 1925-1940 time periods that use geometric design, bold colours and graphics). The authors concluded that respondents with low self-confidence are more likely to choose modern label colour and classic label information.
Shape, size, type of closure
According to Nesselhauf et al., 2017, consumers can find different types of packaging shape, size and type of closure for wines: bottles with corks, screw caps, bag-in-box, tetra Pak and StackTek (plastic containers for casual activities and outdoor events – the container is appropriate for just a single person). The aim of the study was to analyse the Germans’ perceptions and acceptance of innovative wine packaging, concluding that consumers’ acceptance of screw caps is significantly higher than that of bag-in-box and StackTek. The study also noticed that the acceptance of the last two was similar. The majority of researchers emphasized that cork is perceived as an indicator of high quality, as opposed to screw caps, large bottles and bag-in-box which are associated with lower quality (Atkin & Newton, 2012; Barber & Almanza, 2006; Barber, Almanza, & Donovan, 2006; Higgins et al., 2014). A study conducted by Atkin, Garcia, & Lockshin (2006) showed that consumers who are more likely to adopt screw caps are more interested and involved with wine and have a higher income level. Moreover, some studies have shown that the preference for a wine closure type is strongly related with the type of occasion the wine is consumed (Barber, Taylor, & Dodd, 2009).
Finally, some authors argued that bottle shape is strongly related with the region of the wine - “there are many wine producing areas that have adopted unique wine bottle shapes that became the traditional bottle for wines of that region” (Puyares et al., 2010, p.684).
13
2.3. Research questions and conceptual model
Viot (2012) highlighted that the most important attributes are not the same for the Experts and the Novices. The study demonstrated that Experts give particular importance to attributes such as vintage and region of production in wine decision-making and Novices are more concerned with price and vintage. A study conducted by Robertson, Ferreira, and Botha (2018) highlighted that Experts and Modest considered the region of origin as the second most important attribute, in contrast to Novices and Snobs that gave more importance to wine brand.
Considering the aforementioned there are some insights that proof that consumers with different wine knowledge value the elements of wine packaging differently. Therefore, the present study intends to answer the following research question:
RQ1: Do Experts, Snobs, Modest and Neophytes value wine label information differently? If so, which are the main elements on labels valued by each group?
According to literature consumer attitudes towards visual elements of wine packaging tend to be consistent over the years: the evolution of wine packaging has not changed the consumers’ perception of how label design should look like, and they prefer traditional labels and colours over complex design with unusual colour combinations (Lockshin & Corsi, 2012). Traditional label designs are still associated with high quality wine, while contemporary and specifically novelty styles are perceived as cheap and low quality. Boudreaux & Palmer (2007) suggested that labels with images had the strongest effect, and that wine related images such as grapes had the highest score in terms of quality. On the other hand, labels that used unusual animals were the least preferred. The majority of researchers emphasized that cork is perceived as an indicator of high quality, as opposed to screw caps, large bottles and bag-in-box which are associated with lower quality (Atkin & Newton, 2012; Barber & Almanza, 2006;Barber et al., 2006; Higgins et al., 2014).
Thus, although there are some insights in literature about perceptions of consumers towards labels and wine packaging is still unknown if the variable “knowledge” influences those attitudes and perceptions. Thereby, the following research question was formulated:
RQ2: Do Experts, Snobs, Modest and Neophytes have the same perception and attitudes towards visual elements on wine packaging (design, shape and type of closure)?
Consumer´s product knowledge plays an important role in determining new product adoption” (Wenben Lai, A. 1991, p.56). Some researchers suggest that consumers with different levels of knowledge will choose different types of wine closures (Barber, Taylor, & Dodd, 2009). Moreover,
14 “owing to the lower level of knowledge, low-involvement consumers might be more open to information about new packaging forms”(Nesselhauf et al., 2017, p. 289).
Considering the previous the present study aims to answer the following research question:
RQ3: Do Experts, Snobs, Modest and Neophytes have different levels of acceptance of visual elements on wine packaging (design, shape and type of closure)?
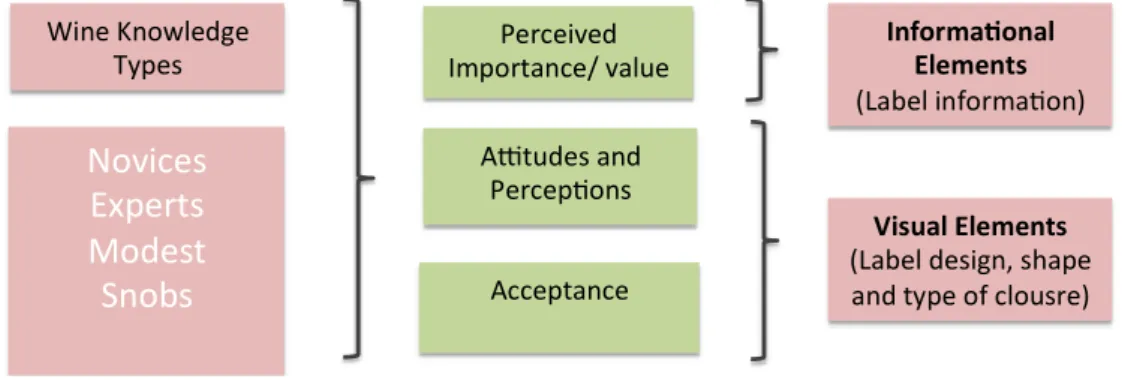
The conceptual model presented on figure 2 illustrates the relationships under study.
Novices
Experts
Modest
Snobs
WineKnowledge
Types Importance/Perceivedvalue A tudesand
Percep ons Acceptance
Informa onal Elements (Labelinforma on)
VisualElements (Labeldesign,shape andtypeofclousre)
15
3. METHODOLGY
This chapter presents and justifies the methodology used to reach the goals of the study. More specifically, this chapter consists of four main sections: the first section outlines the different phases of the investigation; the second describes the measurement of the variables used to answer the research questions; the third describes the procedures for data collection; and, lastly, the fourth section explains how the data was analysed.
3.1. Research design
The literature review was the first stage of this investigation, from which the research questions to be answered on this study were developed.
In order to obtain data for the study, a survey was designed with the study´s variables described in chapter 3.2 (Measurement of variables). To ensure that the survey was understandable and explicit, it was crucial to go through a pre-test phase that is described in chapter 3.3 (Data collection). After the changes, the survey was published online during two weeks.
The collected data was analysed through IBM SPSS (Statistical Package for Social Sciences) 25. The statistical analysis involved descriptive (absolute and relative frequencies, means and standard deviations) and inferential statistics, as further explained in section 3.4 (Data analysis).
3.2. Measurement of variables
The items of the scales used to measure the variables under study were taken from previous research and adapted to suit the objectives of the present study.
a) Consumers´ wine knowledge: subjective knowledge and objective knowledge
Subjective wine knowledge was measured following the study of Ellis & Caruana (2018) that used the scale from Flynn & Goldsmith (1999)(Table 1). The original scale has nine-items, on this study was just used eight-items (explanation in chapter 3.4). All scale items were measured using a seven-point Likert scale ranging from 1 “Strongly Disagree” to 7 “Strongly Agree”. Two reverse-scored items were used to ensure the consistency of responses. According to Barber et al. (2008), Johnson & Bastian (2015), and Ellis & Caruana (2018) the scale of Flynn & Goldsmith (1999) is one of the most used in research related with wine industry. Indeed in the study of Ellis & Caruana (2018) the nine-items scale of Flynn & Goldsmith (1999) exhibits a Cronbach´s alpha of 0.93, which indicates a very good reliability.
16 I know pretty much about wine
I know how to judge the quality of a bottle of wine
I think I know enough about wine to feel pretty confident when I make a purchase
I do not feel very knowledgeable about wine (R)
Among my circle of friends, I´m one of the “experts” on wines I have heard of most of the new wines that are around I can tell whether a bottle of wine is worth the price Compared to most other people, I know less about wines (R) Subjective Wine Knowledge
Variable Items
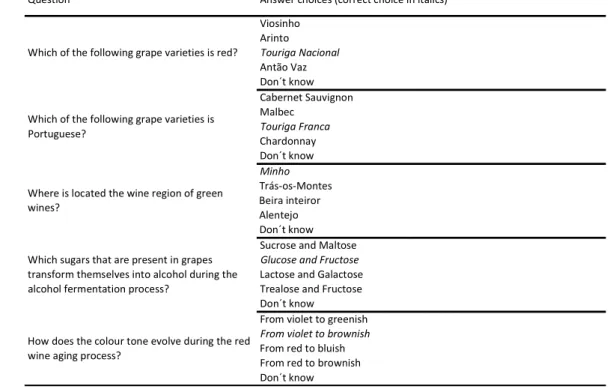
Regarding objective wine knowledge, it has been found by researchers that there is a lack of consistency in measuring this concept, due the fact that each study proposes its own scale (Bruwer & Buller, 2012; Velikova et al., 2015; Ellis & Caruana, 2018). In this study, the objective wine knowledge was measured following the study of Ellis & Caruana (2018) that used the five-item scale of Forbes et.al (2008). The scale consists of five multiple-choice questions about wine, each featuring five choices, of which one is the correct answer. The five-questions were adapted to the Portuguese market, with the collaboration of a well-known Portuguese winemaker from Casa Santos Lima (Table 2).
Which of the following grape varieties is red?
Viosinho Arinto
Touriga Nacional Antão Vaz Don´t know Which of the following grape varieties is
Portuguese? Cabernet Sauvignon Malbec Touriga Franca Chardonnay Don´t know Where is located the wine region of green
wines? Minho Trás-os-Montes Beira inteiror Alentejo Don´t know Which sugars that are present in grapes
transform themselves into alcohol during the alcohol fermentation process?
Sucrose and Maltose Glucose and Fructose Lactose and Galactose Trealose and Fructose Don´t know
How does the colour tone evolve during the red wine aging process?
From violet to greenish From violet to brownish From red to bluish From red to brownish Don´t know
Answer choices (correct choice in italics) Question
b) Informational elements on wine label: perceived importance/value
Two different approaches to measure the importance of information on wine label were used in the present research.
Table 1. Subjective wine knowledge scale, Flynn and Goldsmith (1999) - Adapted version
17 Firstly, in a more generic approach that measures the overall importance of information on wine labels, the respondents were asked to indicate how important the labels information was to them, on a range of 1 (Very important) to 5 (Not at all important). This question was based on the study of Tootelian & Ross (2000), about product labels (Table 3).
Important Uncertain Very important Not at all important Not very important
Question Answer choice
Overall importance of information on wine label
Secondly, a more specific approach, which measures the importance of each informational item present on wine labels was introduced. The measurement items were taken and adapted from the research of Thomas & Pickering (2003) about the importance of wine label information. The main goal of this question was to evaluate the importance of descriptive elements on wine label. Thus, visual elements such as “Image, picture, logo” and “Colours used on labels” were not considered. In total eleven descriptive elements were included, and one item modified (explanation in chapter 3.4). The items were measured through a seven-point importance scale, which varied from very little importance (1) to very great importance (7) (Table 4).
Winecompanyname
Winebrandname
Awardsandmedals
Winemakername
Howwinewasmade
Historyofwineregion
Foodandwineparing
Alcohollevel Grapevariety Vintage
Typeofpersonwinewouldappeal
Variable Items
Informationalelementsonwinelabel
c) Visual elements on wine packaging: attitudes/perceptions Labels design
The labels design and the scale to measure the labels preferences were based on the insights from the study of Sherman & Tuten (2011). The labels were created to represent visually three different design styles: Traditional (typical image of coats-of-arms, classic font and neutral colours), Contemporary (modern font and design) and Novelty (image of an elephant as a “fun element” and differentiating factor, where strong colours are prevalent). To prevent possible biased opinions
Table 3. Value the overall importance of information on wine labels, Tootelian & Ross (2000)
18 caused by the informational elements such as the wine’s country of origin, age and type, each label contained the same information: brand name (Quinta de Cima – fictional name), country (Portugal), year (2019), variety (red wine). The labels were designed by Rita Rivotti, who is a well-known designer in the wine packaging industry (Figure 3).
To measure attitudes and perceptions towards the labels design a five-point Stapel Scale was used. In the original study (Sherman & Tuten, 2011), the authors used seven adjectives. In this study, to ensure the survey was not too long, it was decided to reduce the list and only use the following five adjectives: “Good”, “Complex”, “Cheap”, “High Quality” and “Common”.
Shape, size and type of closure
The choice of different packaging with various shapes, sizes and types of closure was mainly based on the reaserch of Nesselhauf et al. (2017) that analysed consumers’ perception of innovative wine packaging. More specifically, the experiment featured four different packaging options: bottles with corks (the most typical), screw caps, bag-in-box and StackTek (the most unusual). The packaging were illustrated on the survey through images (Figure 4). To explore the attitudes towards the different packaging options, the five-point Stapel Scale was used once again for the five adjectives mentioned above.
Figure 3. Wine label designs, Sherman & Tuten (2011) – Adapted version
19 d) Visual elements on wine packaging: acceptance
The acceptance of wine labels’ design and packaging were measured through participants intention to buy, using the expression “I would buy wine with this label” in a seven-point Likert scale for the wine labels, and “I would buy wine in this packaging”, for shape, size and type of closure (Nesselhauf et al., 2017). Once again, both labels’ design and packaging were illustrated on the survey through images.
3.3. Data collection
The data for this study was collected using a survey.
The survey (Appendix 1) was divided into six parts, and all questions were mandatory with closed answers.
In the first part, participants could find an explanation of the purpose of this study and were also informed about the Garrafeira Nacional’s draw that raffled a €25 voucher among the people who completed the survey. The contest was created as an incentive to motivate wine consumers to participate on the survey and get a larger sample for the study.
In the second part there were mainly filter questions to exclude participants, which were not part of the study sample. To be part of the study, the participants were required to be older than 17 years old and wine consumers. In case they did not meet these requirements, they could not answer the survey, and were informed so.
The third part of the survey was mainly composed by questions regarding wine consumption and purchase.
The fourth part aimed at testing the knowledge variables, specifically the two types of knowledge: subjective and objective. The objective knowledge test took place first to ensure that the answers were realistic and that would not be biased by the subjective question. The fifth part of the survey was mostly related to the wine labels and packaging – at the
beginning the participants were asked about their preferences on the informative elements of wine packaging; then, the participants had the chance to express their attitudes, preferences and finally the acceptance of wine with the different label designs and different packaging as well.
The last section collected the participant’s socio-demographic data, such as their nationality, gender, education and current occupation.
20 To ensure that the survey was understandable and explicit, it was crucial to go through a pre-test phase where six people revised it in person, including two people from the wine industry. Taking into account their insights, some questions and items of the scales were reformulated to create a last version of the survey to be published online. For example, some items of the subjective wine knowledge scale were repeated and ambiguous (such as: “I do not feel very knowledgeable about wines” and " When it comes to wine, I really don´t know a lot”, therefore it was suggested to eliminate the item: “When it comes to wine, I really don´t know a lot”. Also, considering the Portuguese market it was suggested the modification of the item “Winemaker history” to “Winemaker name”. Finally, the adoption of a simpler and clearer writing was suggested. After the changes, the survey was published online during two weeks.
The survey was written in Portuguese and it was designed to target only Portuguese speaking individuals, who buy and consume wine. The survey was implemented online in Google forms, due to its simplicity and ease of use. Most participants were recruited through private and group messages on WhatsApp and Facebook.
A convenience sample was used: a non-probabilistic sample technic that involves a selection of the sample elements based on their availability. Its advantages are simplicity and speed: get the highest number of possible answers in a short period of time (Cooper & Schindler, 2016).
3.4. Data analysis
As mentioned before, the collected data was analysed through the statistical software – IBM SPSS (Statistical Package for the Social Sciences) 25.
The statistical analysis involved measures of descriptive statistics (absolute and relative frequencies, means and respective standard deviations) and inferential statistics. The level of significance chosen to reject the null hypothesis was (α) ≤ 0.05. The following statistics were used: the Repeated Measures ANOVA, One Sample T-test, Cronbach´s alpha consistency coefficient, the Pearson´s correlation coefficient, Chi-Square Test of Independence, the One-way ANOVA and the MANOVA. In order to used the statistics aforementioned, some assumptions should be considered. The distribution of values was accepted on variables in samples with dimension bigger than 30, according to the central limit theorem. The homogeneity of variances was analysed with the Levene’s test. The sphericity assumption and the homogeneity of variance and covariance matrix were also analysed (Marôco, 2007).
21 More specifically, the Repeated Measures ANOVA compares means across one or more variables that are based on repeated observations of the same group of participants. In order words, “Repeated-measures” is a term used when the same participants participate in all conditions of an experiment” (Field, 2009,p.458). In the present study, Repeated Measures ANOVA was carried out in order to compare and analyse the mean scores across different type of wine label designs, as well as different type of wine packaging given by the same group of consumers.
Additionally, a One Sample T-test was run to compare the values obtained in the study with a theoretical average of distribution for the acceptance of visual elements on wine packaging.
Furthermore, following Ellis & Caruana (2018) research, the Cronbach´s alfa method was applied to evaluate the internal consistency of the measurement scale of subjective knowledge. Also, Pearson´s correlation was calculated to explore the correlation between objective and subjective wine knowledge.
The Chi-Square Test of Independence was performed to give a comparative analysis of demographic characteristics of wine knowledge groups. The Chi-Square assumption that there should be less that 20% of the cells with expected frequencies below 5 was analysed. In situations where this assumption was not satisfied, the Chi-Square test by Monte Carlo simulation was used.
Lastly, One Way ANOVA and MANOVA were used. The One Way ANOVA “compares several means, when those means have come from different groups of people (Field, 2009, p.388). In this study, the technique was used to determine if there were any statistically significant differences among the four groups in perceived importance of wine labels information (one dependent variable). Moreover, a multivariate analysis of variance (MANOVA) was performed to compare the responses of the four groups in dependent variables correlated with each other, such as the wine informational elements, the different type of label designs, shape, size and types of closure. In short, “MANOVA can be thought of as ANOVA for situations in which there are several dependent variables” (Field, 2009, p.585).
22
4. RESULTS AND DISCUSSION
This chapter presents the main results of the research. The first section describes the general sample characteristics using both relative and absolute frequencies; the second section analysis the results of the survey regarding respondents´ perceptions of informational and visual elements on wine packaging using descriptive statistics, Repeated Measures ANOVA and One Sample T-test; the last section develops the wine knowledge typology and provides answers to the three research questions through One Way ANOVA and MANOVA.
4.1. General sample characteristics
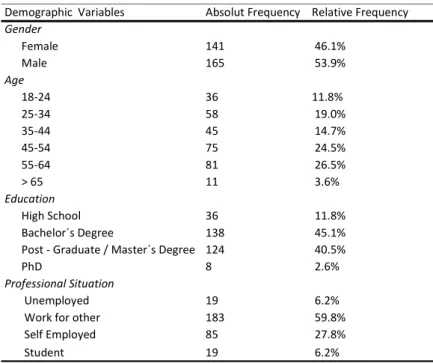
A total of 328 valid answers were collected, including 22 respondents that were not considered part of the study target (under eightheen years old and/or non wine consumers).Therefore, the final sample was composed of 306 people. The sample characteristics are presented on Table 5. The sample was well distributed regarding gender, with 53.9% male and 46.1% female. When it comes to age, there were two age groups that standed out: the age group of 55-64 years old with 26.5% and the group of 45-54 with 24.5%. Regarding education level, the majority of respondents had a higher level of education: 45.1% with Bachelor degree and 40.5% with Post-Graduate/Masters degree. Concerning professional situation, the majority of respondents worked for others (59.8%) and 27.8% were self employeed. Both the unemployed and students represented 6.2% of respondents.
In summary, the most common respondent of the survey is a man, aged between 55-64 years old, with a Bachelor degree that works for others.
Demographic Variables Absolut Frequency Relative Frequency Gender Female 141 46.1% Male 165 53.9% Age 18-24 36 11.8% 25-34 58 19.0% 35-44 45 14.7% 45-54 75 24.5% 55-64 81 26.5% > 65 11 3.6% Education High School 36 11.8% Bachelor´s Degree 138 45.1% Post - Graduate / Master´s Degree 124 40.5%
PhD 8 2.6%
ProfessionalSituation
Unemployed 19 6.2%
Work for other 183 59.8%
Self Employed 85 27.8%
Student 19 6.2%
23 Additionaly, it was relevant to analyse consumers’ behaviour in terms of their wine consumption and purchasing. It is notable that the frequency of wine consumption was quite high: 36.6% of respondents consume wine several times a week, and 25.2% consume it once per week. Only a small group of people (7.5%) consumes wine once per month or less (Figure 5).
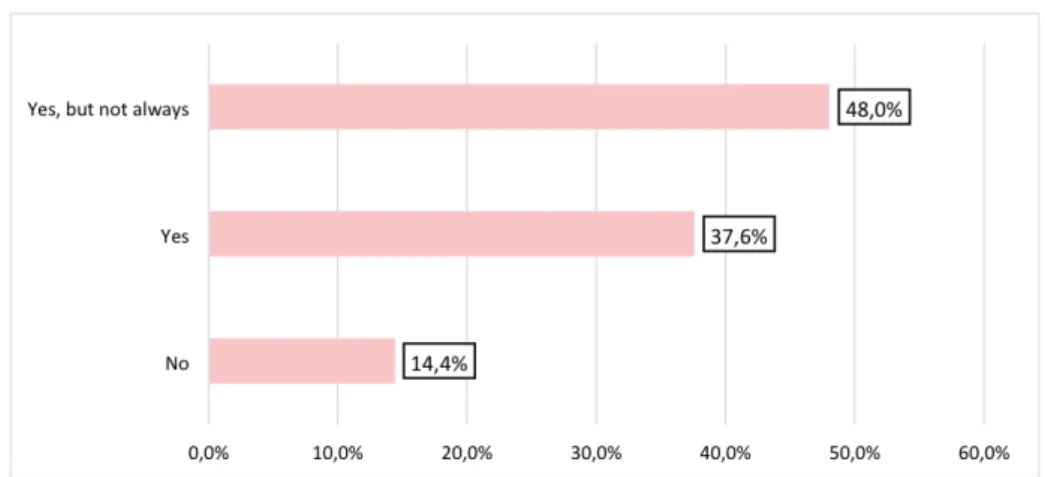
Regarding wine purchasing (Figure 6), almost half of the respondents answered that they are responsible for the purchase, although not always (48%).
In contrast to wine consumption frequency, wine purchase frequeceny is low. For the ones who usually buy wine (262 respondents), 43.5% buy once a month or less, and 38.2% buy 2 to 3 times per month (Figure 7).
Figure 5. Respondents´wine consumption frequency
24
4.2. Consumers´ perceptions of wine labels and packaging
This section intends to analyse the results of the survey regarding consumers’ perception of wine labels and packaging, and also compares them with studies that were used as a basis for the design of the conceptual model and the survey. This point is split in three sub-sections: importance of informational elements on wine labels; attitudes and perceptions of visual elements on wine packaging; and acceptance of visual elements on wine packaging.
4.2.1. Importance of informational elements on wine label
Over half of respondents (52%) considered label information “Important”, whereas 37.6% considered it “Very important”. Only a small percentage of them answered that it was “Not very important” (2.9%) or “Not important at all” (0.7%) (Table 6). These results are in line with the Tootelian & Ross (2000) study in United States, where most of the respondents (53.5%) also considered the information on the label “Important”, and 27.4% considered it “Very important”.
Importanceofinformationonwinelabel N %
Important 159 52.0
Uncertain 21 6.9
Veryimportant 115 37.6
Notatallimportant 2 0.7
Notveryimportant 9 2.9
Total 306 100.0
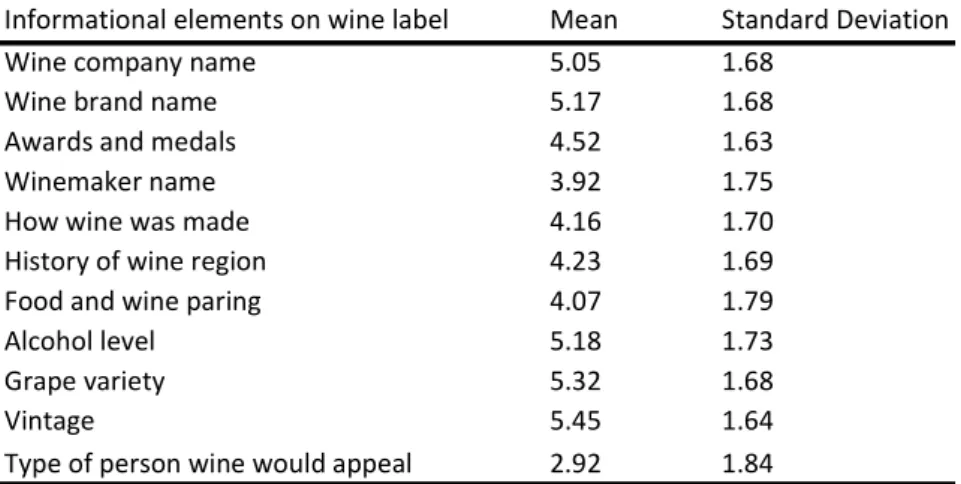
Concerning informational elements on wine labels, respondents considered “Vintage” (mean of 5.45), “Grape variety” (mean of 5.32) and “Alcohol percentage” (mean of 5.18) the most important elements of the wine label. In contrast, other elements such as “Type of person wine would appeal to” (mean of 2.92) and “Winemaker name” (mean of 3.92) were considered less important. The items: “Winemaker name”, “Food and wine paring” and “Type of person wine would appeal” had the higher standard deviations, indicating diversity in respondents’ answers (Table 7).
Figure 7. Respondents´wine purchase frequency
25
Informationalelementsonwinelabel Mean StandardDeviation
Winecompanyname 5.05 1.68
Winebrandname 5.17 1.68
Awardsandmedals 4.52 1.63
Winemakername 3.92 1.75
Howwinewasmade 4.16 1.70
Historyofwineregion 4.23 1.69 Foodandwineparing 4.07 1.79
Alcohollevel 5.18 1.73
Grapevariety 5.32 1.68
Vintage 5.45 1.64
Typeofpersonwinewouldappeal 2.92 1.84
Note: Scale of 1 “Little importance” to 7 “Very great importance”
In the study of Thomas & Pickering (2003), the items “Wine company” (mean of 5.12), “Wine brand name” (mean of 4.95) and “Awards and medals” (mean of 4.86) were considered the most important items. And the lowest scored item was the “Type of person the wine would appeal” (mean of 2.49). In the same study, consumers were also asked to mention other elements that they thought were important on wine labels, and the two elements that were mentioned the most were “Grape variety” and “Vintage year” – results that are in line with the present study.
4.2.2. Attitudes and perception of visual elements on wine packaging
Label design
The measurement of the attitudes towards the different wine labels’ design is summarised in Table 8. The results of Repeated Measure ANOVA are presented in Appendix 2. Wine with the traditional label design was significantly better rated, with qualities such as “Good”, “Complex” and “High quality,” than the wine with contemporary (p = .001) and novelty (p = .001) labels design. Furthermore, the differences between the evaluation of novelty and contemporary labels were not statistically significant for the adjective “Good” (p = .424) and “High quality” (p = .266). The difference between those labels was statistically significant (p = .004) only for the adjective “Complex”.
Also, the wine with the novelty label design was better rated regarding the adjective “Cheap” (mean of 2.80) than the wine with traditional (mean of 2.18) and contemporary (mean of 2.77) labels design. The differences between the evaluation of novelty and contemporary labels were not statistically significant for the adjective “Cheap” (p = .658).
Lastly, wine with the contemporary labels design was better rated regarding the adjective “Common” (mean of 2.78) than wine with traditional (mean of 2.35) and novelty (mean of 2.66) labels design.
26 The differences between the evaluation of contemporary and novelty labels were not statistically significant for the adjective “Common” (p = .135).
Overall, it can be concluded that the traditional label was more associated with the adjectives “Good”, “High quality” and “Complex”, while contemporary and novelty labels were more associated with the adjectives “Common” and “Cheap”, respectively. These results are in line with the findings from the study of Sherman & Tuten (2011).
Labels design Mean Standard Deviation Traditional Good 3.16 1.10 Complex 2.71 1.13 Cheap 2.18 1.07 High Quality 3.2 1.03 Common 2.35 1.16 Contemporary Good 2.30 0.99 Complex 2.18 1.00 Cheap 2.77 1.22 High Quality 2.36 0.91 Common 2.78 1.24 Novelty Good 2.25 1.05 Complex 1.99 1.02 Cheap 2.8 1.36 High Quality 2.29 1.01 Common 2.66 1.33
Note: Scale of 1 – "Doesn´t apply to the referred wine" and 5 – "Does apply to the referred wine"
Shape, size and type of closure
Table 9 presents the measurement of attitudes towards shape, size and type of closure. The results of Repeated Measure ANOVA can be seen in Appendix 3.
Cork was significantly better rated on the adjectives “Good”, “Complex” and “High quality” than screw caps (p = .001), bag-in-box, (p = .001) and StackTek (p = .001). Additionally, the differences among the evaluation of screw caps, bag-in-box and StackTek for the adjectives “Good”, “Complex” and “High quality” were also statistically significant (p < .05). Bag-in-box was significantly better rated on the adjectives “Cheap” and “Common” than cork (p = .001), screw caps (p = .001) and StackTek (p = .019). Also, the difference between the evaluation of screw caps and StackTek was not statistically significant for the adjectives “Cheap” (p = .240) and “Common” (p = .378).