Work Project presented as part of the requirements for the Award of a Masters Degree from NOVA – School
of Business and Economics
Consulting project for the Portuguese Water and Waste Services Regulation Authority
Optimization of the Organizational Model and Identification of the Benefits of an Aggregation of "Retail" Operators
Consulting lab carried out under the supervision of:
Professor Constança Monteiro Casquinho
22
ndof May 2016
Diana Martins de Oliveira Tomás
#2274
Luís Maria Rodrigues Andrade e Sousa
#2141
Mafalda Folgado Verol Marques
#2317
Marta Duarte Soares
#2444
Simão Mouzinho Latino Tavares
#2021
+
The Portuguese regulator of water supply and wastewater management is facing a challenge: municipalities are having difficulties in managing their services in a sustainable way, while providing good quality of service. By analyzing some best practices, it was visible that aggregations could be the solution. To bring this solution to the municipalities, an implementation plan was drawn with a series of guidelines to use in meetings with municipalities. Inside it there was also a selling package which consisted of several arguments for the target municipalities. The selling package culminated in a model that simulated the positive effects of an aggregation.
Abstract
2+
Acknowledgements
First of all we would like to thank our amazing advisor, Professor Constança Casquinho. Her passion about life and her strive through adversity were very motivating and
inspiring. Secondly we want to thank all Nova School of Business and Economics professors specially Professor Fábio Santos for all the work, devotion and extra-hours
spent guiding us.
We would also like to thank our demanding client in name of Dra. Ana Albuquerque and Dr. Orlando Borges for the amazing oportunity given and all the support; and all
ERSAR’s collaborators, specially Eng. Ana Rita Ramos, Dra. Rita Silva, Dra. Alexandra Cunha, Dra. Isabel Andrade, Dr. Luís Simas, Eng. João Rosa and Professor Poças
Martins, who were a day-to-day essential help, for their patience answering our questions and supervision during the project.
Furthermore, a special thank you to the different operators directors and interveners we met. We would like to mention Dr. Miguel Carrinho, Eng. Moura de Campos, Eng.
Fernando Vasconcelos, Dr. Carlos Paiva, Dr. Nuno Campilho and Dr. José Augusto Silva Santos for their indescribable generosity of sharing knowledge and time with us.
Finally we would like to mention our parents, families, friends and all who encouraged us through the whole project, for all the support and patience when times were not
easy and specially for the unconditional love you give us every day.
“Success is no accident. It is hard work,
perseverance, learning, studying, sacrifice and most of all, love of what you are doing or learning to do”
Pelé
+
Executive Summary -
CONTEXT
About ERSAR
About the Project
Created in 1997, ERSAR (The Water and Waste Services Regulation Authority) is the Portuguese Regulator of water supply, wastewater management and urban waste services acting over all 500 operators of the sector.
These services are regional natural monopolies, which harm competition. Consumers can not choose the operator of their preference nor the entity with better price-quality relation. Since it constitutes a market failure (there is no competition) there is the need for economic regulation to reduce inefficiencies. Thus, ERSAR is responsible for protecting users by ensuring the quality of service and for guaranteeing fair tariffs. However, this should be conducted by assuring a long term sector’s financial and environmental sustainability.
This project is a multidisciplinary work done in collaboration with different departments and experts within ERSAR, targeting “retail” operators (“baixas”) in Portugal.
The reorganization of multimunicipal concessions in wholesale (“altas”), created the opportunity to reorganize the “retail” operators, a fragmented, inefficient and indebted sector. Thus, together with UTA (Unidade Técnica de Apoio) – comprising managers, economists, jurists, engineers, auditors, specialized professors and ex-mayors – the team was able to study possible national aggregations between municipalities with existing good relations, specially created through CIM’s (Comunidades Intermunicipais) in order to ensure a fair and sustainable access to this essential service with better quality.
Entidade Reguladora dos Serviços de Águas e Resíduos tem nova imagem com assinatura da MyBrand. (2016). Retrieved May 18, 2016, from http://www.meiosepublicidade.pt/2016/03/entidade-reguladora-dos-servicos-de-aguas-e-residuos-tem-nova-imagem-com-assinatura-da-mybrand/
"ABASTECIMENTO DE ÁGUA INTERROMPIDO NA ZONA DO PINHAL NOVO." SetubalTV STV. 2015. Accessed May 18, 2016. http://setubaltv.com/abastecimento-de-agua-interrompido-na-zona-do-pinhal-novo/.
“Quem Somos - Apresentação da ERSAR”. ERSAR. 2016. Accessed May 18, 2016. http://www.ersar.pt/website/ViewContent.aspx?FolderPath=\Root\Contents\Sitio\MenuPrincipal\QuemSomos&Section=MenuPrincipal&SubFolderPath=
This was a highly challenging problem proposed by ERSAR in order to foster the reorganization of the drinking water supply and wastewater
sector
+
The main goal of the project was to give inputs for ERSAR’s strategy to transform this sector (in “baixas”) and make it sustainable in the long-term
Challenges
Aim and Activities
AIM: to create an approach and a plan to show municipalities that aggregation is the best solution for sector’s sustainable development. ACTIVITIES:
Understand Portuguese water supply and wastewater sector;
Analyze the different types of operators, major practices, constituents and main challenges and inefficiencies;
Identify national best practices, study their aggregation processes, efficiency practices and gains and apply them to pilot areas;
Assess strengths, weaknesses, opportunities and threats of a certain region and understand how to take advantage of them to create a sustainable aggregation;
Estimate cost savings in aggregations through the analysis of individual Profit and Losses Statements and aggregated ones;
Develop inputs for ERSAR’s strategy ,propose recommendations and an implementation plan.
CV
What are the “retail” operators’ current challenges and problems? How can they solve them?
Is an aggregation the best way to achieve efficiency, environmental sustainability and water quality?
How can ERSAR take advantage of Portuguese existing best practices to convince municipalities to aggregate?
How can ERSAR use the existing relations between municipalities to speed up the processes?
What is the best aggregation model for a certain region?
Is it possible to develop one aggregation model and apply it to all municipalities?
Is it possible to set an homogeneous tariff along the country?
+
Executive Summary -
SOLUTION
Solution
Reorganization of “Retail” Sector
Tariff’s dispersion across the country;
Unsustainability of the sector
Aggregation of “Retail” Operators
Why
Study of national Best Practices:
Analysis of a specific CIM;
Development of an Aggregation Model
Implementation Plan and Selling Package
adaptable to any aggregation
How
Through
Resulting in
Leading to
In order to solve the challenge we recommended an implementation plan to foster the sector’s reorganization
+
Executive Summary -
RECOMMENDATIONS
Recommendations
Total Added Value for the Client
RECOMMENDATIONS FOR ERSAR: Implementation Plan: All the steps before and after the creation of a
Municipal Company;
Specialized training to specific operators;
Enhanced use of an online platform to share experiences and
knowledge;
Bi-annual reports deliveries
RECOMMENDATIONS FOR MUNICIPALITIES:
Selling Package: Structured plan to convice municipalities to aggregate
CIM Douro: targeted recommendations regarding the type of
aggregation, specific legal requirements and how to reach financial and quality goals
Three sharp case studies about best practices in Portugal – two of them of succeeded aggregations and one about two municipalities with successful practices;
Detailed analysis of CIM Douro, analysis of their resources, current situation – quantitative and qualitative –, expected improvements from the aggregation and implementation plan;
Selling package and aggregation model for future aggregations;
Recommendations both for ERSAR and the regulated operators in order to increase efficiency and quality of the provided services;
By implementing our recommendations, ERSAR will be able to help municipalities reorganize themselves by giving them tools to facilitate the
aggregation processes
TABLE OF CONTENTS
LIST OF FIGURES
LIST OF ABBREVIATIONS, ACRONYMS AND INITIALS
GLOSSARY
+
List of FiguresTable of Contents
List of Abbreviations, Acronyms and Initials Glossary
1. Methodology
General Methodology Phase I – Diagnosis
Sector’s Overview
National Best Practices Analysis
Phase II – Analysis
Development of a Light Management model Determination and analysis of a Pilot
Phase III – Recommendations
Recommendations for ERSAR Recommendations for Municipalities 2. Phase I: Diagnosis
Wastewater Management sector’s overview Management Models’ Study
Best Practice Analysis – Águas do Ribatejo
Motivations for aggregation Historical Framework Geographical Framework
Share Capital and Assets Ownership
Management Model
Organization Financial Analysis Investments
Efficiency Measures Implemented
Results
Funding
Best Practice Analysis – Águas da Região de Aveiro
Motivations for aggregation Historical Framework Geographical Framework
Share Capital and Assets Ownership
Management Model
Financial Analysis Investments
Efficiency Measures Implemented Results
Funding
Best Practice Analysis – SIMAS de Oeiras e Amadora
Motivations for maintenance
Historical and Geographical Framework Share Capital and Assets Ownership
Management Model Organization Financial Analysis Investments Results Funding
3. Phase II: Analysis
Light Management Model Pilot Analysis Qualitative Analysis Region Operators SWOT Analysis Indicators Aggregation Model Introduction Data Calculations Output Ex-ante Situation Revenues COGS Personnel Expenses
Supplies and External Services Financial Expenses
Ex-post situation
Scenarios
4. Phase III: Recommendations
Recommendations for ERSAR
Implementation Model Other Recommendations
Recommendations for Municipalities
Selling Package Other Recommendations 5. Individual Reports 6. Appendix 7. References 9
+
Figure 1 – Water Supply and Wastewater supply chain Figure 2 – “Gross” Aggregated operators in 2014 Figure 3 – “Retail” Aggregated operators in 2014
Figure 4 – AdR Geographical and demographical Information Figure 5 – AdR Management Model and Organization
Figure 6 – AdR Investments plan Figure 7 – AdR Efficiency measures Figure 8 – AdR Indicators and evolution
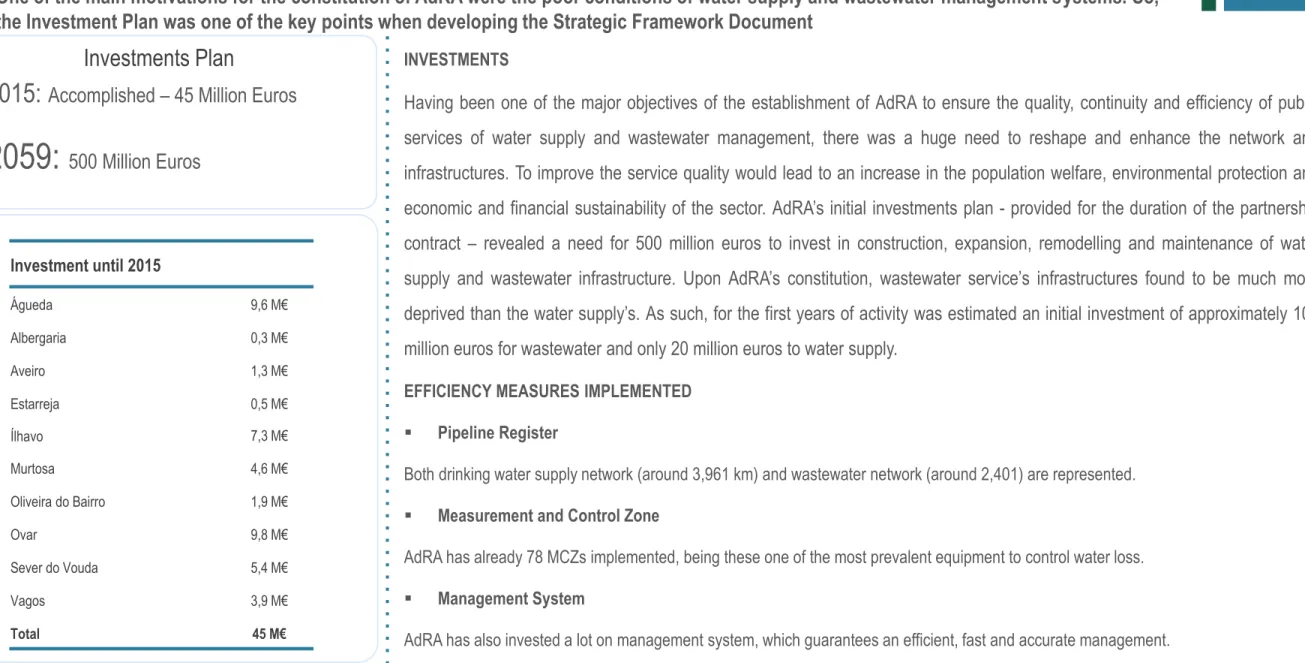
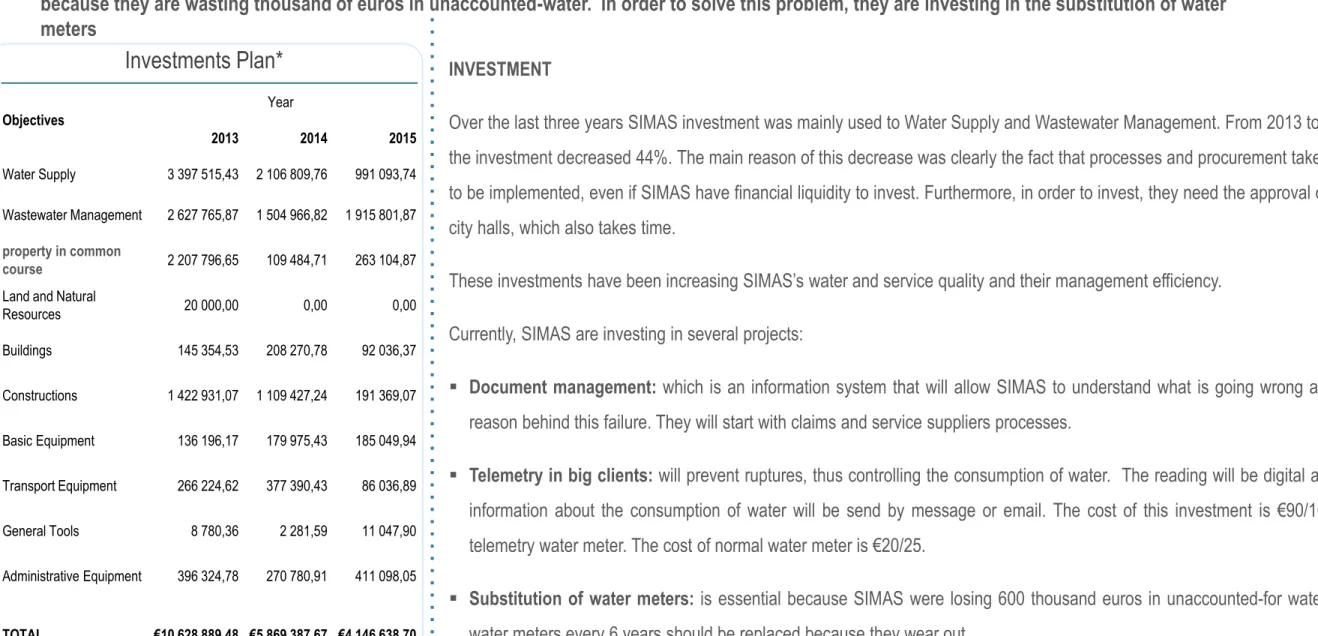
Figure 9 – AdRA Geographical and demographical Information Figure 10 – AdRA Management Model and Organization Figure 11 – AdRA Investments plan
Figure 12 – SIMAS Geographical and Demographical Information
Figure 13 – SIMAS Indicators and evolution
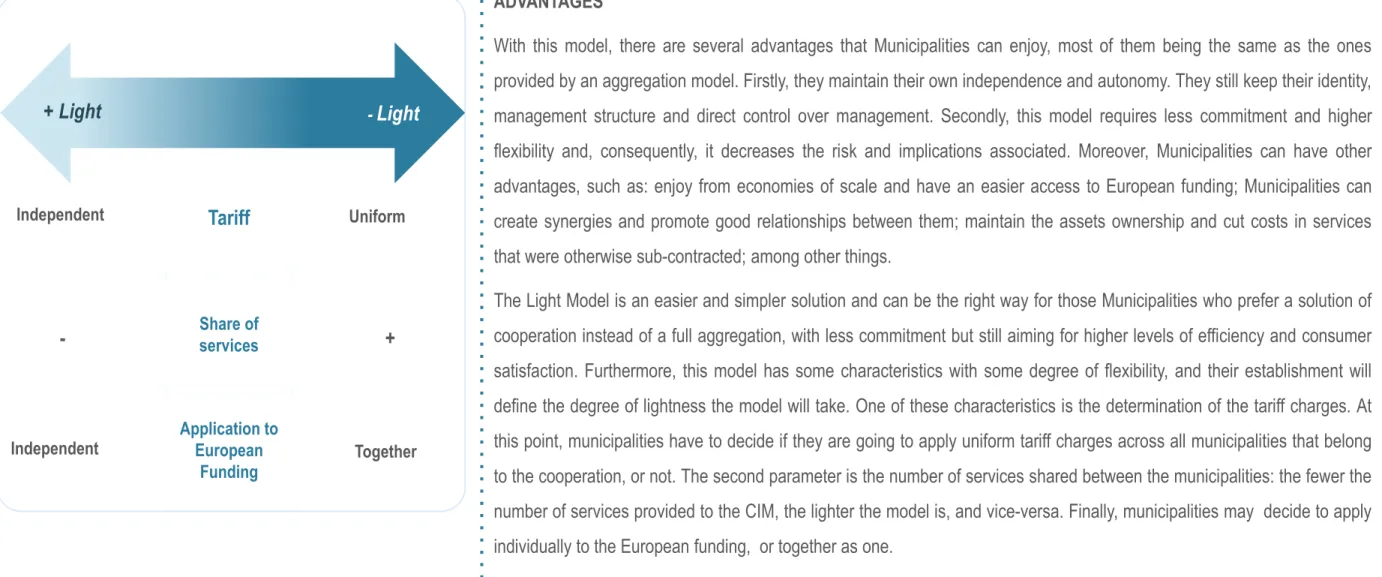
Figure 14a) – Light Management Model Demonstration Figure 14b) – Light Management Model Demonstration
Figure 15 – CIM Douro Geographical and Demographical Information Figure 16 – Operators economical and service information
Figure 17 – Aggregation Model Table of Contents
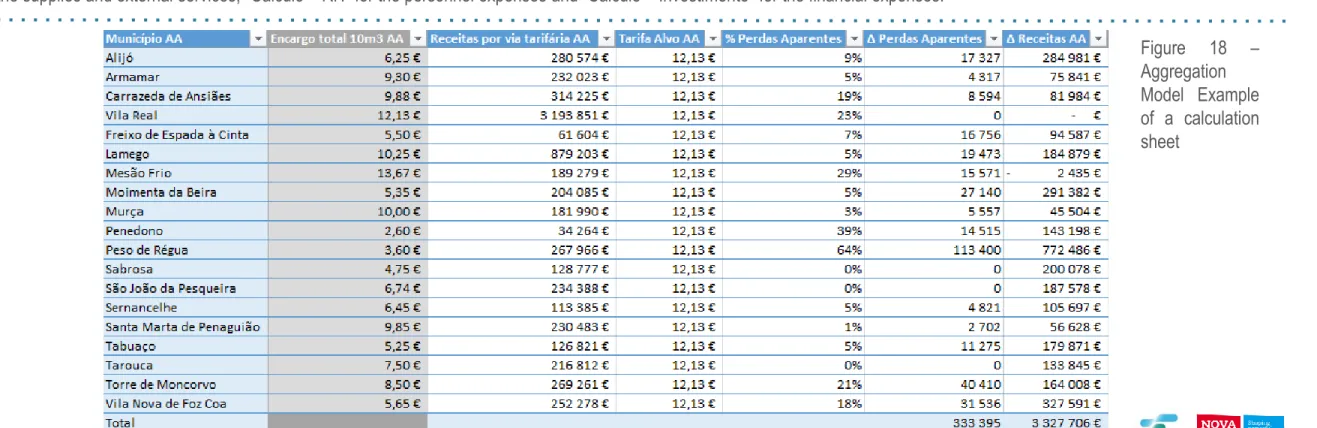
Figure 18 – Aggregation Model Example of a calculation sheet Figure 19 – Aggregation Model Inputs
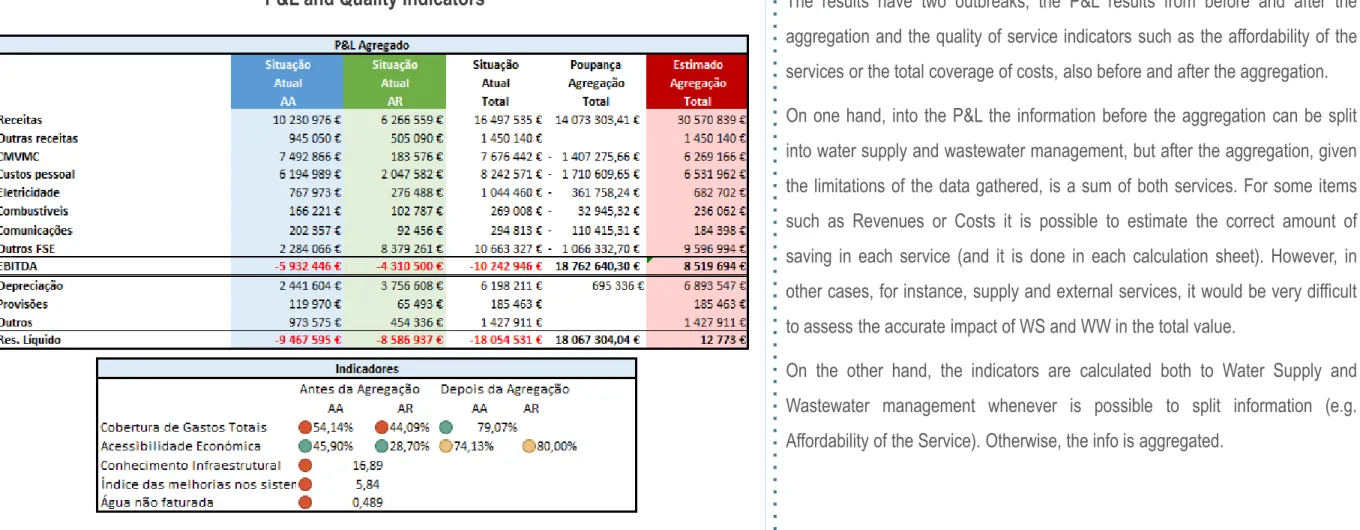
Figure 20 – Aggregation Model Municipalities Figure 21 – Aggregated P&L and Quality Indicators Figure 22 – Tariff charges per CIM Douro municipality
10
+
List of Abbreviations, Acronyms and Initials
11AdP – Águas de Portugal AdR – Águas do Ribatejo
AdRA – Águas da Região de Aveiro CAGR – Compound Annual Growth Rate CIM – Comunidade Intermunicipal EE – Pumping Stations
EPAL – Empresa Portuguesa das Águas Livres, SA
ERSAR – The Water and Waste Services Regulation Authority ETA – Water Treating Plants
ETAR – Wastewater Treating Plants MCZ – Measurement and Control Zone
P&L – Profit and Losses Statement
POSEUR – Programa Operacional Sustentabilidade e Eficiência no Uso de Recursos POVT – Programa Operacional Temático Valorização do Território
QREN – Quadro de Referência Estratégico Nacional
SIMAS – Serviços Intermunicipalizados de Oeiras e Amadora UWM – Urban Waste Management
WS or AA – Water Supply
+
12Abstractions: Location where the water is extracted from its natural source. There are superficial and
subterranean abstractions.
Acoustic Correlador: Device that is inserted into two points of the network to calculate the position of the
leak in the mains.
Acoustic Logger: The combination of a logger and a correlador acústico.
Adduction: The transportation of water from the abstractions to the treatment stations.
Adductors: Structures that transport the water from the abstractions to the treatment stations and to
reservoirs for the “Retail” distribution.
Aquamatrix: Commercial management system. It handles clients, invoices, service management. Integrated
approach to the technical and commercial sides of the business.
Association of municipalities: Several municipalities take part in a collaborative public management body
– the association of municipalities is the operator of the service.
Collectors: Pipes and chambers that constitute the infrastructures that lead the wastewater to the treatment
stations.
Company established in partnership with the state (municipal or State owned company): State and
municipalities participate in the share capital of the public body in charge of managing the partnership.
Concession: The concession contract states that the concessionaire has obligations when providing
services; the tariff has to be defined and actualized every year and the concessionary has the right to reset the economic and financial balance when there is shift in the exploitation of the service because of the shift in the legal norms. The maximum period of the contract is 30 years.
Delegation: The delegation of the services to companies predicts that these companies are in charge of the
management of the services. The delegation can be a partnership with state, a company totally owned by municipalities or a parish association. This model requires a business contract where the objectives, the politics and the prices of the company are stated. Also, the investments and the tariff charge have to be stated in the business contract that is subject to revision every five years.
Direct Management: The direct management of the services can be done by the municipalities,
municipalized, inter-municipalized services or association of municipalities; the difference between the municipalities services and the inter-municipalized services is the financial and administrative autonomy.
Domestic Connections of Wastewater Management: Portion of the pipes that makes the connection
between the plumbing and the collectors.
Domestic Connections of Water Supply: Portion of the pipes that makes the connection between the
plumbing and the mains.
Domestic Consumption: Consumption made by domestic clients.
Flowmeters: Devices capable of measure the flow of water passing through the mains. It is able to
characterize the level of consumption.
Geofone: Device used to identification of leaks in the mains through the pavement on the streets. It captures
the noise from the pipes leading to identification of leaks.
Glose: Platform used to manage operations and maintenance. Used to identify the assets of the
organization.
“Gross” or “Wholesale”: Gross activity of the water supply and wastewater management services. It covers
the abstraction, treatment, elevation and water storage.
+
13Inter-Municipalized services: Cooperation between two or more municipalities, shared autonomous
structure but without legal personality.
Logger: Device that is installed with any kind of flowmeter. The logger is used to store information captured
by the flowmeters.
Mains: Pipes that transport the water from the reservoirs to the final user.
Measurement and Control Zone: It is a delimited zone surrounding the pipelines that controls and
measures the flow of water passing through the mains, using flowmeters.
Municipal concessionaire: Public-private partnership (municipalities or other private utilities)
Municipal owned company in which there is no participation of the State (established under commercial law): Several municipalities may participate in the share capital of the concession. Private
companies may have minority share.
Municipality service: One municipality, the operator of the service is the municipality.
Non-domestic Consumption: Consumption made by non-domestic clients.
Parish or user’s association: Agreements or contract-programs between the municipality and parish or
users association.
Pipeline Register: Mapping of all the kilometers of mains and collectors and other infrastructures.
Pumping Stations: Installation that allows for the pumping of water to regions with higher altitudes or which
the network has not enough pressure to send the water.
Reservoirs: Infrastructure where water is stored.
“Retail”: Retail activity of the water supply and wastewater management services. It covers all the distribution of water and collection of wastewater from the consumers.
SIG: Geographical Information Systems. Open source software with internal developments. It is used for a
better data management.
Tariff charge: It is the value that the consumer pays for the water supply and wastewater management
services.
Tariff: It is the unit value applied to a measurement unit: per contract, per cubic meter. This tariff value is
defined by each operator. This value takes into account the costs of each activity per si, the investment costs and exploitation costs.
Telegestão: System that monitors and manages the equipment remotely. This allows for efficiency
improvements, better water quality control and a reduction of costs, electricity and water losses.
Treatment Stations: Installation that treats and cleans the water. There are treatment stations for the water
supply services and for the wastewater management services.
“Verticalization”: When the Operator does the “Gross” and “Retail” part of the business.
Wastewater Management Services: Services related to the collection and treatment of wastewater from the
general population.
Water meters: Instrument used to measure the volume of water consumed on that location.
Water Supply Services: Services related to the abstraction, treatment and distribution of drinking water to
the general population.
1. METHODOLOGY
GENERAL METHODOLOGY
PHASE I: DIAGNOSIS
PHASE II: ANALYSIS
PHASE III: RECOMMENDATIONS
+
Methodology –
GENERAL METHODOLOGY
PHASE I: DIAGNOSIS
February, 2
nd– March, 18
thPHASE II: ANALYSIS
March, 21
st– April, 26
thPHASE III: RECOMMENDATIONS
April, 26
th- May, 11
ndWater and Wastewater Sector’s
Overview
WS and WW gross operators
WS and WW retail operators
Financial Analysis
Management Models’ Study
National Best Practices Analysis
Águas do Ribatejo
Águas da Região de Aveiro
Sistemas Intermunicipais de Água e
Saneamento – Oeiras e Amadora
Development of a “Light”
Management Model
Advantages
Variables
Applicability
Determination and Analysis of a
Pilot
CIM Douro
Qualitative analysis
Aggregation model
Scenarios
Recommendations for ERSAR
Implementation Plan
Recommendations for
Municipalities
Selling Package
1. METHODOLOGY
GENERAL METHODOLOGY
PHASE I: DIAGNOSIS
PHASE II: ANALYSIS
PHASE III: RECOMMENDATIONS
+
Phase I –
DIAGNOSIS
WATER AND WASTEWATER SECTOR’S OVERVIEW
PURPOSE (why?): Study the sector to determine strengths and weakeness of main activities. Analyze different types of operators regulated by ERSAR
METHOD (how?): The main goal was to study the sector and to understand its main activities, players and modus operandi. It was also relevant to understand the distribution across the country and the evolution of the sector over the years. The team used primary and secondary research for these purposes.
AGENDA (what?):
17
INTRODUCTION
WS AND WW GROSS OPERATORS
WS AND WW RETAIL OPERATORS
Characterize the different services regulated by ERSAR;
Understand the difference between “Gross” and “Retail” Activities;
Map out the different steps of supply chain;
Understand the “Wholesale’ ” aggregation process;
Identify different types of players, relevance and distribution across the country;
Identifiy different types of players, relevance and distribution across the country;
FINANCIAL ANALYSIS Understand the current financial situation of operators by type of operator.
+
MANAGEMENT MODELS’ STUDY
PURPOSE (why?):Analyze different types of management models that a municipality may decide to adopt, in order to characterize the sector in Portugal.
METHOD (how?): This framework was a essential tool to understand how the country is distributed accordind to the management models, which of them
municipalities tend to adopt and their main particularities.
AGENDA (what?):
18
INTRODUCTION
QUALITATIVE AND
QUANTITATIVE ANALYSIS
Introduce theoretically the different management models (characteristics and definitions);
Develop a framework according to the type of management model, having as variables the management sub-model adopted, type of operator, ownership entity and type of service.
Assess the number of operators, municipalities and population covered by each type of service. It also included other particularities, such as the average coverage of total costs, financial autonomy, assets ownership and type of management (private or public).
+
NATIONAL BEST PRACTICES ANALYSIS
PURPOSE (why?): Study the successful cases in Portugal allowed us to know deeply what are the motivations, vantages, limitations and resistance of an
aggregation. Study the different management models and understand what are the characteristics and the outcomes of each model. This analysis allowed us to develop an aggregation Model to CIM Douro that can be adapted to other entities.
METHOD (how?): Visit the national best practices headquarters and meet with the different division chiefs.
AGENDA (what?):
19
MOTIVATIONS FOR THE AGGREGATION/MAINTENANCE HISTORICAL FRAMEWORK GEOGRAPHICAL FRAMEWORK MANAGEMENT MODEL ORGANIZATION CHART ECONOMIC SUSTAINABILITY EFFICIENCY MEASURES IMPLEMENTED
FUNDING AND INVESTMENT
Understand the major reasons of an aggregation;
Explain the different steps of the aggregation process;
Identify requirements established;
Understand the reasons of the municipalities that did not integrated the aggregation;
Identify different municipalities that integrated the aggregation;
Characterize the model used by the operator;
Identify the distribution of the collaborators through the divisions of the services;
Analyze the evolution of revenues, costs, tariffs, efficiency improvements, coverage of total costs;
Identify the major efficiency measures implemented after the aggregation;
Identify the major investments after the aggregation;
Analyze the funds received by the operators;
1. METHODOLOGY
GENERAL METHODOLOGY
PHASE I: DIAGNOSIS
PHASE II: ANALYSIS
PHASE III: RECOMMENDATIONS
+
DEVELOPMENT OF A LIGHT MANAGEMENT MODEL
PURPOSE (why?):Analyze this type of management model, to determine and understand its applicability and variables required to implement it.
METHOD (how?): The main goal was to define the characteristics, advantages and requirements of this model, in order to provide a step-by-step solution to
municipalities. It was also relevant to understand how the relations between the municipalities are made, as well as the services shared.
AGENDA (what?):
21
INTRODUCTION
MODEL ANALYSIS
Characterize the model and legal requirements;
Determine the variables that may change, contract parameters and penalizations to apply.
Define its applicability and advantages,
Analyze the type of service shared, by nature and area of operation.
+
Phase II –
ANALYSIS
DETERMINATION AND ANALYSIS OF A PILOT
PURPOSE (why?): Analyze the Douro region in order to understand its economic demographic characteristics and also to determine strengths, weakness, opportunities and threats of the region. Study the region water services management. This analysis will allow us to determine the best aggregation model for the region.
METHOD (how?): The main goal was to know the characteristics of the region, in order to provide the most appropriate aggregation model. The team interviewed over the phone all 19 municipalities in order to understand their resources and activities. The team also consulted industry and region experts.
AGENDA (what?):
22
QUALITATIVE ANALYSIS
AGGREGATION MODEL SCENARIOS
Understands the characteristics of the region – area, population, population density and purchasing power per capita;
Analyzes the water supply and wastewater management services;
SWOT Analysis
Analyzes the water and service indicators
Simulates the effects of an aggregation;
Studies several scenarios of the aggregation model;
+
AGGREGATION MODEL
PURPOSE (why?): Simulate the impact of an aggregation in CIM Douro, more specifically on the P&L of the Operator and its Quality of Service.
METHOD (how?): To create this model it was necessary to gather all the data, treat properly, and make the right calculations and assumptions to build the most accurate results. To gather the data, the visits to the best practices were very useful as to know how a well managed and efficient operator operates. The
Municipalities data was gathered on ERSAR’s portal and with direct contact with the Municipalities. The assumptions made were based upon the opinions of the technicians in ERSAR and based on our gathered expertise in the field. Finally the results were created in order to the user to see clearly the advantages and potential of an aggregation. AGENDA (what?): 23 FINANCIAL DATA GENERAL DATA TREAT DATA
OPERATIONAL REVENUES & EXPENSES FINANCIAL EXPENSES
ANALYZE RESULTS
Gather all the P&Ls from the 19 municipalities of CIM Douro and from the three best practices studied, Águas do Ribatejo, Águas da Região de Aveiro and SIMAS Oeiras e Amadora.
Gather all information regarding demographics, area, quality of service, tariff charges and others. Estimate missing data and unreliable data;
Eliminate unnecessary data.
Calculate possible efficiencies and economies of scale in following items: Sales, Cost of Goods Sold, Personnel Expenses, Supplies and External Services.
Calculate amount of amortization needed to pay the investments that the aggregation brings to operators. Display all the information in a clear manner;
Ellaborate different scenarios for ERSAR and Municipalities to choose from.
1. METHODOLOGY
GENERAL METHODOLOGY
PHASE I: DIAGNOSIS
PHASE II: ANALYSIS
PHASE III: RECOMMENDATIONS
+
RECOMMENDATIONS
PURPOSE (why?): Deliver final recommendations to ERSAR and the municipalities to motivate and promote the re-orgnization of the “retail” sector.
METHOD (how?): After studying the best practices in Portugal, and gathering the necessary information and knowledge from ERSAR and the operators that were visited, the team was now ready to draw some conclusions in the form of recommendations for ERSAR and the municipalities. These recommendations are in line with the problem identiied by the team and the client, which can be fixed by a re-orgnization of the sector.
AGENDA (what?):
25
GATHER THE INFORMATION AND KNOWLEDGE FROM BEST PRACTICES
AND OTHER OPERATORS ANALYZE ALL THE INFORMATION
RETRIEVED
PREPARE RECOMMENDATIONS FOR ERSAR
PREPARE RECOMMENDATIONS FOR THE MUNICIPALITIES
Gather information on the changes that the aggregation brought to the best practices; Gather information on the modus operandi of other municipalities;
Analyze and discuss about the information collected;
Discern on what changes can be replicated to other future aggregations;
Draw recommendations for ERSAR, in the form of an Implementation plan, to approach municipalities that can be future participants in an aggregation;
Draw additional recommendations for ERSAR to improve its results as the regulator of the sector;
Draw recommendations for the municipalities that will intake in future aggregations, including a selling package;
2. PHASE I: DIAGNOSIS
SECTOR’S OVERVIEW
BEST PRACTICE: ÁGUAS DO RIBATEJO
BEST PRACTICE: ÁGUAS DA REGIÃO DE AVEIRO
BEST PRACTICE: SIMAS OEIRAS E AMADORA
26
PHASE II: ANALYSIS
March, 21st– April, 26th
PHASE III: RECOMMENDATIONS
April, 26th- May, 11nd Development of a “Light” Management Model Advantages Variables Applicability
Determination and Analysis of a Pilot CIM Douro Qualitative analysis Aggregation model Scenarios Recommendations for ERSAR Implementation Plan Recommendations for Municipalities Selling Package PHASE I: DIAGNOSIS
Water and Wastewater Sector’s Overview WS and WW gross operators WS and WW retail operators Financial Analysis Management Models’ Study
National Best Practices Analysis
Águas do Ribatejo Águas da Região de Aveiro Sistemas Intermunicipais de Água e Saneamento – Oeiras e Amadora February, 2nd– March, 18th
+
The water and wastewater sector is of crucial importance in the Portuguese society. A true development of the country has to address the need
to make these services widely available across the country with acceptable standards concerning the quality of service provided
The sector includes three different services: Water Supply (WS), Wastewater (WW) and Urban Waste Management (UWM). This work project will focus only on the first two. Those services are essential to the quality of life of citizens, public wealth, economical activities and environment protection. Therefore, WS and WW should follow the principles of universal access, continuity and quality of service, efficiency and fair prices. The Water and wastewater sector is a natural monopoly in each region, which means that each municipality can only have one operator responsible for the services.
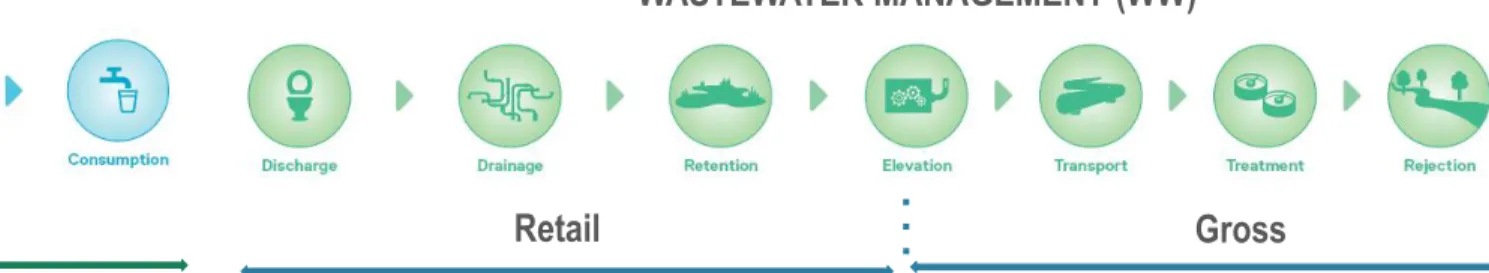
The services WS and WW comprise “Gross” and “Retail” services depending on the type of activity they perform (Figure 1). The “Gross” service for water supply includes all the processes before the distribution – abstraction, treatment, elevation and adduction - connecting the water environment to the “Retail” system. The latter connects the water to the end-users’ through storage and distribution. In the case of Wastewater, the “Gross” activity comprises discharges, drainage, retention and elevation while the “Retail” covers transportation, urban wastewater treatment and devolution to the environment.
Nowadays the regulator believes that a reorganization of the Retail system will have a positive impact on the sector due to operator’s scale gains. A higher integration level in the water and wastewater sector allows, possibly, economies of scale and scope. This will be possible in the water sector with the promotion of regional cooperation and aggregation that will allow to save costs both to operators (that are inefficient in most of the country) and possibly to the end-users (by charging fair but sustainable tariffs), to provide a better service (in terms of water quality and safety), gain scale to invest in infrastructures (mains and collectors rehabilitation and physical accessibility of the service) and protect the environment (proper treatment of collected wastewater).
27
Water supply and wastewater sector’s overview
Gross Retail Retail Gross
Figure 1 – Water Supply and Wastewater supply chain
WATER SUPPLY (WS) WASTEWATER MANAGEMENT (WW)
+
WATER SUPPLY AND WASTEWATER GROSS OPERATORS
The Portuguese “gross” system has suffered a major reorganization and nowadays, after the aggregation process all “gross” operators are companies (15 in WS and 19 in WW - Figure 2) with the multimunicipal concessions dominating the sector. The business community started the development in the middle 90’s. The first generation of aggregations occurred in the littoral and dense regions while the second generation happened in the rural areas.
The concessions embrace about 71% of total population and 79% of municipalities in WS; and about 97% of total population and 91% of municipalities in WW.
The WS state-owned companies have, as well, some power: even with only one operator (EPAL), the high density of the area transform this sub-management model the second more important with 25 municipalities and 1,8 million habitants.
There are also some municipalities without bulk services both in WS and WW. The water service includes 97 municipalities and 3,33 million people in this model and the wastewater has 94 municipalities and 2,9 million habitants, most of them located in the north and center of Portugal.
Finally, it is also relevant to enhance the State-municipality partnership (with Águas de Portugal) that provides the service to approximate 250 thousand people covering 23% of Portugal’s area, mainly in rural zones such as Alentejo.
28
There are several diversified types of players in this sector. At Government level, there is in general the Public Administration and the regulation
authority. The systems are managed by municipalities, associations of municipalities, municipal and intermunicipal companies, public
companies and private concessions or companies
Figure 2 – “Gross” Aggregated operators in 2014
WATER SUPPLY (WS) WASTEWATER (WW)
Water supply and wastewater sector’s overview
+
All operators involved in this sector need, reliable information about the water and wastewater sector and its evolution in Portugal to support
policymaking and strategic planning by the operators and to effectively assess the services offered to end-users
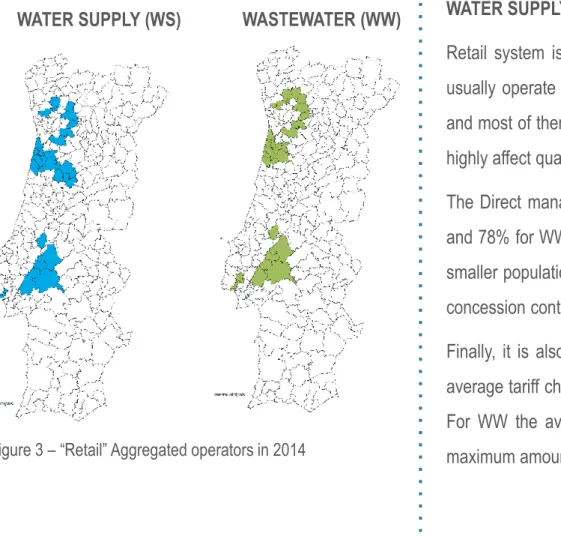
WATER SUPPLY AND WASTEWATER RETAIL OPERATORS
Retail system is characterized by a huge number of operators, 262 for WS and 264 for WW. These entities are small and usually operate only in one municipality. Usually these companies (specially in the rural areas) are not efficient economically and most of them are not able to invest the proper amount of money to rehabilitate mains and other infrastructures. This event highly affect quality of water and service provided to end-users.
The Direct management model has the biggest coverage percentage: 70% of total municipalities for WS (53% of population) and 78% for WW (61% of population).Since the biggest amount of population for this type of model prevails in rural areas with smaller population density, the remain management models prevail in littoral area or urban centers. Thus, both delegation and concession contain an elevated percentage of the population, but are present in a lower number of municipalities.
Finally, it is also relevant to overview economic performance, which in fact varies a lot across the country. The Portuguese average tariff charges for an average consumption of 10m³ for in WS is 9,2€ (16,05€ is the maximum and 0,75€ the minimum). For WW the average is 6,44€, way below WS, and we can find some operators that do not charge sanitation tariff - the maximum amount is 19,54€.
29
Water supply and wastewater sector’s overview
Figure 3 – “Retail” Aggregated operators in 2014
WATER SUPPLY (WS) WASTEWATER (WW)
+
All operators involved in this sector need reliable information about the water and wastewater sector and its evolution in Portugal to support
policymaking and strategic planning by the operators and to effectively assess the services offered to end-users
FINANCIAL ANALYSIS
When analyzing the financial performance of retail operators it is important to take into account how it depends a lot on the verticalization and level of outsourcing. In fact an operator that explores both gross and retail will entail lower COGS but probably higher electricity expenses when compared with a non-verticalized operator. The level of outsourcing is also relevant, because companies with lower levels of personnel expenses usually spend more money in supplies and external services (e.g.: specialized jobs or conservation and reparation). One important note is that reliability of data is one of the biggest challenges for ERSAR because most of operators do not account correctly financial information.
Coverage of Total Costs:
The coverage of total costs is one of the most relevant indicators and yet very deficient: only 11% of WS’s operators and 7% of WW’s present efficient results (good evaluation under ERSAR criteria – 1,0;1,1). Around 60% of the WS’s operators are in deficit and this deficit increases to 80% when wastewater is the sector analysed. The remaining ones present coverage of total costs’ values above the maximum accepted by the regulator and therefore should re-evaluate their tariffs;
In Water Supply this economic indicator is evaluated as “Good” in almost all municipalities for every management model except from municipalities services where most operators are not able to cover their costs with revenues. The Wastewater service presents lower levels of coverage, due to lower tariffs on average and this is reflected in high needs of investment that are not bridged.
Personnel Expenses:
On average Municipality Service is the management model with higher expenses with personnel far distant from the others. This is one of the results that highlights the inefficiency of this type of management model. The most efficient one is Intermunicipalized service. However, this result is biased since there are only two operators governed by this management model.
30
Water supply and wastewater sector’s overview
0,77 1,13 1,22 1,08 1,10 0,66 0,85 0,98 0,91 1,15 0,00 0,50 1,00 1,50 Municipality Service Concession Delegation Municipalized Service Intermunicipalized Service
Average of Coverage of Total Costs per
Management Model
AR AA 191,00 24,00 24,00 17,00 2,00 0,00 50,00 100,00 150,00 200,00 250,00 Municipality Service Concession Delegation Municipalized Service Intermunicipalized ServicePersonnel Costs per Covered Population
+
In Portugal, Municipalities are responsible for municipal systems, its management and operation can be done under three different management
models. The direct management by the municipal services is the most common
MANAGEMENT MODELS’ STUDY
In Portugal, the ownership of the water supply, wastewater management and waste management services belong to the State or the Municipaliities. The State is responsible for the multimunicipal systems and the Municipalities are in charge of the municipal systems. The operators are the responsible entities for the management and operation of the municipal systems, and may decide between three different management models: direct management, delegation and concession, and are able to promote public partnerships, or public-private partenerships. For the “retail” part of the business, the system are generally all municipal.
In the case of municipal ownership, the direct management model can be done through municipalized or inter-municipalized services, municipality services and association of municipalities. The delegation can be attributed to a company established in partnership with the state, to a municipal owned company, and to a parish or users association. Finally, the concession is always attributed to a municipal concessionaire.
According to the appendix 1 that shows all the management models over the country, it is patent that most of the municipalities adopted a direct management model through municipal services. However, these services are the only operator in Portugal that show a negative (lower than 1) average coverage of total costs. In most of the cases of delegation and concession, the assets still remain in the ownership of the municipalities after the contract expires, but its management is made by the operators.
Furthermore, the best practices in Portugal decided to adopt an intermunicipal model solution, and this might be the solution for efficient municipalities. Águas da Região de Aveiro, SIMAS and Águas do Ribatejo adopted a delegation model to a company established in partnership between the State and Municipalities, a direct management model through a inter-municipalized services, and a delegation model to a inter-municipal company, respectively.
2. PHASE I: DIAGNOSIS
SECTOR’S OVERVIEW
BEST PRACTICE: ÁGUAS DO RIBATEJO
BEST PRACTICE: ÁGUAS DA REGIÃO DE AVEIRO
BEST PRACTICE: SIMAS OEIRAS E AMADORA
32
PHASE II: ANALYSIS
March, 21st– April, 26th
PHASE III: RECOMMENDATIONS
April, 26th- May, 11nd Development of a “Light” Management Model Advantages Variables Applicability
Determination and Analysis of a Pilot CIM Douro Qualitative analysis Aggregation model Scenarios Recommendations for ERSAR Implementation Plan Recommendations for Municipalities Selling Package PHASE I: DIAGNOSIS
Water and Wastewater Sector’s Overview WS and WW gross operators WS and WW retail operators Financial Analysis Management Models’ Study
National Best Practices Analysis
Águas do Ribatejo Águas da Região de Aveiro Sistemas Intermunicipais de Água e Saneamento – Oeiras e Amadora
+
In 2003 Municipalities found themselves in concerning situation, in need of funding to pay for the investments that were needed to provide the
service with sustainability and quality that the consumers require
MOTIVATIONS FOR THE AGGREGATION
There were three major reasons for the aggregation of Lezíria do Tejo: a huge concern regarding the economical and financial sustainability of the service, which required a large investment that, in turn, required funding.
HISTORICAL FRAMEWORK
A longstanding process started in 2003 led the “Drinking water supply and Wastewater management Intermunicipal System of Lezíria do Tejo” to the creation of the intermunicipal company Águas do Ribatejo - 2007.
By the time of aggregation, all the region’s municipalities were welcome. However, a few requirements were still established: Control of their systems in “Gross” and “Retail”;
Economic viability for the system ; Geographical proximity;
Interest shown by municipalities.
Nowadays, the aggregation comprises municipalities of Almeirim, Alpiarça, Benavente, Chamusca, Coruche, Salvaterra de Magos and Torres Novas, with good relations with each other, and which are governed by a principle of municipal solidarity.
FUNDING
Funding to cover existing investment needs; At the time, the aggregation was the only option for
municipalities to get EU funds.
INVESTMENT
Infrastructure (construction and restructuring); Technical Experts (engineers, operating technicians); Information Systems (Infrastructure management
systems)
SERVICE MANAGEMENT SUSTAINABILITY
Economic sustainability through the balance of intra and intermunicipal accounts;
Drinking water supply and Wastewater management services’ coverage;
Compliance with legal requirements on drinking water quality.
Best Practice Analysis –
ÁGUAS DO RIBATEJO
33“Quem somos - Mensagem do Presidente” Águas do Ribatejo. Accessed May 18, 2016 from http://www.aguasdoribatejo.com/artigo.aspx?lang=pt&id_object=392&name=Mensagem-do-Presidente “Quem somos - Síntese Histórica.” Águas do Ribatejo. Accessed May 18, 2016 http://www.aguasdoribatejo.com/artigo.aspx?lang=pt&id_object=397&name=Sintese-Historica
+
The aggregation occurred in 2007 with the majority of the municipalities of Ribatejo being part of it, and welcoming Torres Novas in 2011. Rio
Maior, Azambuja, Cartaxo and Santarém did not join for different reasons. Golegã abandoned the process
150 000
46,9
Geographical Area
Population
3 200 km
2Population Density
GEOGRAPHICAL FRAMEWORK
Almost all municipalities belonging to CIM Lezíria do Tejo integrated the aggregation, excluding Santarém and Cartaxo due to political and administrative motives – the first have created its own Municipal Company and the second has concessioned its services to a private operator - and Rio Maior and Azambuja as they were already aggregated in “gross” activities. Golegã abandoned the process few months later of its beginning and decided to maintain a direct management model, managed directly by the City Council. Torres Novas was the last municipality to join the aggregation, only in 2011.
SHARE CAPITAL AND ASSETS OWNERSHIP
AdR – Águas do Ribatejo E.M. SA, is an Intermunicipal Company, established in December 2007 as a public liability company. Its share capital – 6 871 681,00€ - is 100 % public and owned by seven municipalities of Santarém (district), being the shareholder composition based on each municipality’s population. The share capital was totally composed with assets: each municipality gave the company several infrastructure (reservoirs, treatment plants, pumping stations) to make up their participation value, receiving in exchange a certain number of shares.
The assets acquired during the 40 years of partnership belong to the company and at the end of the partnership revert to municipalities. Assets that already existed before the company’s creation are managed by AdR during the partnership period but are turned back to municipalities at its end.
Torres Novas 25% Benavente 19% Almeirim 16% Salvaterra de Magos 15% Coruche 13% Chamusca 7% Alpiarça 5%
Best Practice Analysis –
ÁGUAS DO RIBATEJO
Shareholder Composition
34
Entidade Reguladora dos Serviços de Águas e Resíduos. ERSAR's Portal. Retrieved from https://portal.ersar.pt/
“Quem somos – Natureza e Atribuições.” Águas do Ribatejo. Accessed May 18, 2016. http://www.aguasdoribatejo.com/artigo.aspx?lang=pt&id_object=395&name=Natureza-e-Atribuicoes
+
The municipalities of Ribatejo opted for a delegation model to an Intermunicipal Company. Águas do Ribatejo is a without bulk service company,
covering the water supply and wastewater management services
MANAGEMENT MODEL
Initially, the operator signed individual delegation agreements with all municipalities - 2008-, later on, those were replaced by a single delegated management contract settled between the seven municipalities and the Intermunicipal Company. This business formula enables the integrated management of drinking water supply and Wastewater management in the aggregated Municipalities. This allows them to achieve economies and efficiency scales and investment capacity which would be more expensive or even impossible if taken individually by each municipality.
Águas do Ribatejo is a without bulk service company which means that it provides both gross and retail services.
ORGANIZATION
AdR BackOffice is centred in Salvaterra de Magos, which is, geographically a central municipality of the region, but the operation - maintenance and customer support - remains dispersed. The Board of Directors includes three mayors and the company has 170 employees spread over six directions
Delegated Management Model to an Intermunicipal
Company
Holder
Operator Company with State and municipalities’ owned
capital
Municipalities or Association of Municipalities
Municipalities’ partnership + State Municipality Municipality Intermunicipal Company
Intermunicipal Solution
Board of Directors 3 Network Management 48 General 5 Administration and finance 13 Planning and works 7 Comercial 48 Production and treatments 49Águas do Ribatejo Organization Chart
Function’s Distribution
Best Practice Analysis –
ÁGUAS DO RIBATEJO
35Employees 170 Managers 6 Responsible for Work 12 Senior Technicians and Doctors 29 Workers and Operators 78 Administration and Comercial 45
“Quem somos - Organização.” Águas do Ribatejo. Accessed May 18, 2016. http://www.aguasdoribatejo.com/artigo.aspx?lang=pt&id_object=394&name=Organizacao
+
1,04 1,10 1,12 1,05 5,5 € 9,5 € 11,5 € 16,5 € 17,2 € 17,2 € 4,3 € 6,9 € 7,7 € 9,7 € 10,6 € 10,0 € 2009 2010 2011 2012 2013 2014 €3,69 €4,67 €4,84 €5,06 Fixed Tariff (10m3)Costs have been growing fastly in AdR, but they are more than compensanted with the increase in Revenues. The huge decrease in losses is
the result of an high invesment in infrastructures and their quality
REVENUES COSTS EFFICIENCY IMPROVEMENTS COVERAGE OF TOTAL COSTS
2011 2014 52% 43% 35% 39% 38% 34% Losses 28,6 € 26,4 € 22,0 €
Setor Serviços Municipais Águas do Ribatejo
Personnel Expenses per Population covered in 2014 (Thousands) 1,00 2014 2009 2009 2014
Positive financial results can be explained through a sustainable tariff over the years, the consistent reduction of losses and efficiency in personnel expenses;
Since 2011 AdR presents consistently a solid coverage of total costs, having in 2014 values above national average and specially above municipality services.
Revenues main items (2014): Tariff WS: 6.712.499€ Tariff WW: 7.557.018€ Subsidies: 2.808.829€
Revenues’ evolution explanation:
AdR started the operation in the middle of 2009 originating a higher increase in 2010’s revenues; Torres Novas joined AdR in 2011, resulting in a scale increase both in 2011 and 2012;
One of the main concerns of AdR is keeping a sustainable tariff;
Losses decrease since 2009 except in 2012;
Costs’ evolution explanation:
AdR started the operation in the middle of 2009 originating a higher increase in 2010’s costs;
Torres Novas joined AdR in 2011, resulting in a scale increase both in 2011 and 2012;
Since 2009 AdR replaced and built new infrastructures
which increase the maintenance costs and
investments.
Costs main items (2014): Personnel: 3.273.960€ Electricity: 1.704.829€
Maintenance and Repair Services: 1.075.747€ COGS: 890.172€
Values in million €
0,95
0,72
1,05
Setor Serviços Municipais Águas do Ribatejo
Coberage of Total Costs (2014)
36
Best Practice Analysis –
ÁGUAS DO RIBATEJO
+
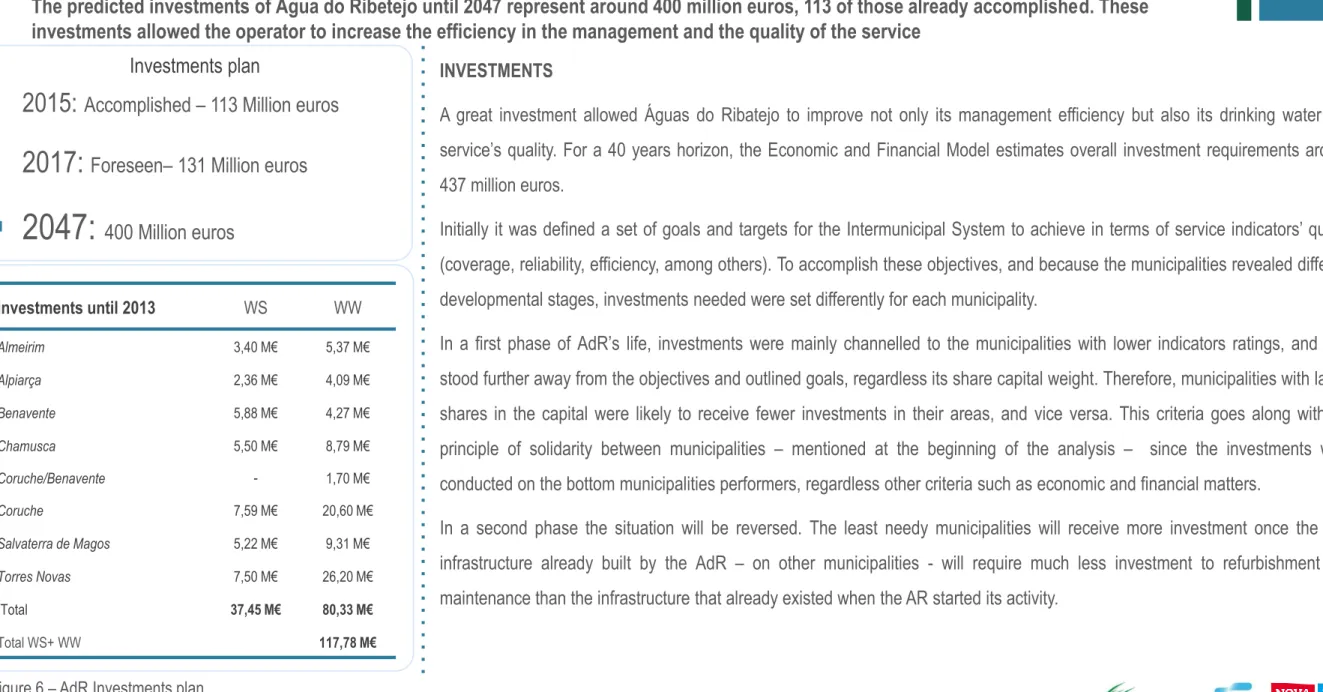
The predicted investments of Água do Ribetejo until 2047 represent around 400 million euros, 113 of those already accomplished. These
investments allowed the operator to increase the efficiency in the management and the quality of the service
INVESTMENTS
A great investment allowed Águas do Ribatejo to improve not only its management efficiency but also its drinking water and service’s quality. For a 40 years horizon, the Economic and Financial Model estimates overall investment requirements around 437 million euros.
Initially it was defined a set of goals and targets for the Intermunicipal System to achieve in terms of service indicators’ quality (coverage, reliability, efficiency, among others). To accomplish these objectives, and because the municipalities revealed different developmental stages, investments needed were set differently for each municipality.
In a first phase of AdR’s life, investments were mainly channelled to the municipalities with lower indicators ratings, and thus stood further away from the objectives and outlined goals, regardless its share capital weight. Therefore, municipalities with larger shares in the capital were likely to receive fewer investments in their areas, and vice versa. This criteria goes along with the principle of solidarity between municipalities – mentioned at the beginning of the analysis – since the investments were conducted on the bottom municipalities performers, regardless other criteria such as economic and financial matters.
In a second phase the situation will be reversed. The least needy municipalities will receive more investment once the new infrastructure already built by the AdR – on other municipalities - will require much less investment to refurbishment and maintenance than the infrastructure that already existed when the AR started its activity.
Investments until 2013 WS WW Almeirim 3,40 M€ 5,37 M€ Alpiarça 2,36 M€ 4,09 M€ Benavente 5,88 M€ 4,27 M€ Chamusca 5,50 M€ 8,79 M€ Coruche/Benavente - 1,70 M€ Coruche 7,59 M€ 20,60 M€ Salvaterra de Magos 5,22 M€ 9,31 M€ Torres Novas 7,50 M€ 26,20 M€ Total 37,45 M€ 80,33 M€ Total WS+ WW 117,78 M€
Investments plan
2015: Accomplished – 113 Million euros
2017:
Foreseen– 131 Million euros
2047:
400 Million euros
Best Practice Analysis –
ÁGUAS DO RIBATEJO
37“Quem somos - Plano de investimentos.” Águas do Ribatejo. Accessed May 18, 2016. http://www.aguasdoribatejo.com/artigo.aspx?lang=pt&id_object=396&name=Plano-de-Investimentos
+
The investments were used to acquire information systems to support several areas of Águas do Ribatejo, install new water meters, and invest
in infrastructures, whether by building new ones or rehabilitating the already existing
So, those who initially received less attention will get more investment in the future, specifically the refurbishment and modernization of infrastructure.
EFFICIENCY MEASURES IMPLEMENTED
Pipeline Register
The drinking water supply network (around 2,000 km) is already totally represented with also other infrastructures (reservoirs , EE, ETA , among others) in SIG, with network distribution, materials, diameters, ages, location, accessories.
In the case of wastewater management (around 1,000 km), there is no information in SIG yet. However, the entire network is represented in plants with information on materials, diameters, ages and accessories (partial) and other infrastructure (ETARs, EE, etc).
Measurement and Control Zone
2015 was an important year for MCZ’s implementation. currently there are 23 MCZ 's already implemented and 14 under implementation and this is a process to extend over this and the next few years
System Functionality Investment Telegestão Monitor, control and remotely manage equipment 600 mil euros1
Glose Operation and Maintenancemanagement 30 mil euros Software
Gestão do Controlo Analítico
Analytical Control 5 mil euros
Primavera Procurement, accounting, treasury, human resources 20 mil euros Aquamatrix Commercial management –billing, CRM 80 mil euros2
SIG Software open source with internal development
Acquired Management System
Ano 2009 2010 2011 2012 2013 2014 2015 Inst. 1 585 4891 5961 - - - -Subst. 1 296 3 377 6 551 7 660 6 177 6 068 5 157
Number of water meters
Best Practice Analysis –
ÁGUAS DO RIBATEJO
38+
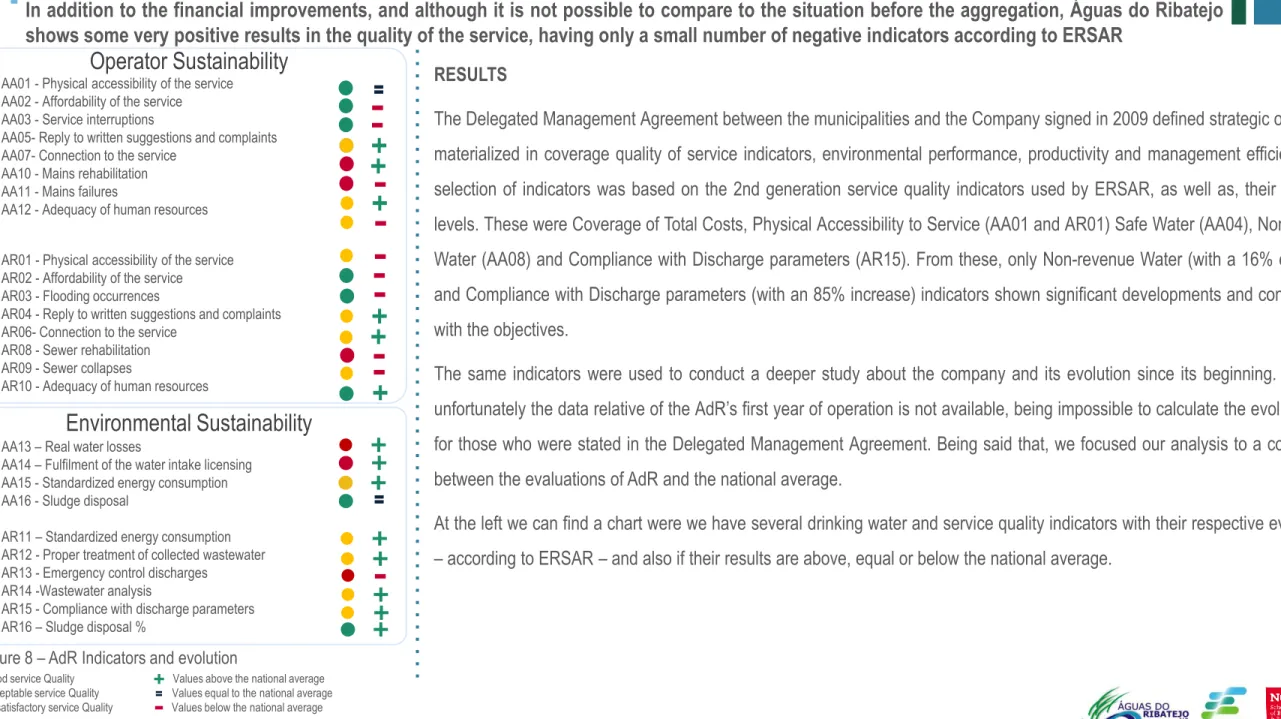
In addition to the financial improvements, and although it is not possible to compare to the situation before the aggregation, Águas do Ribatejo
shows some very positive results in the quality of the service, having only a small number of negative indicators according to ERSAR
RESULTS
The Delegated Management Agreement between the municipalities and the Company signed in 2009 defined strategic objectives, materialized in coverage quality of service indicators, environmental performance, productivity and management efficiency. The selection of indicators was based on the 2nd generation service quality indicators used by ERSAR, as well as, their reference levels. These were Coverage of Total Costs, Physical Accessibility to Service (AA01 and AR01) Safe Water (AA04), Non-revenue Water (AA08) and Compliance with Discharge parameters (AR15). From these, only Non-revenue Water (with a 16% decrease) and Compliance with Discharge parameters (with an 85% increase) indicators shown significant developments and convergence with the objectives.
The same indicators were used to conduct a deeper study about the company and its evolution since its beginning. However, unfortunately the data relative of the AdR’s first year of operation is not available, being impossible to calculate the evolution held for those who were stated in the Delegated Management Agreement. Being said that, we focused our analysis to a comparison between the evaluations of AdR and the national average.
At the left we can find a chart were we have several drinking water and service quality indicators with their respective evaluations – according to ERSAR – and also if their results are above, equal or below the national average.
Operator Sustainability
AA01 - Physical accessibility of the service AA02 - Affordability of the service
AA03 - Service interruptions
AA05- Reply to written suggestions and complaints AA07- Connection to the service
AA10 - Mains rehabilitation AA11 - Mains failures
AA12 - Adequacy of human resources AR01 - Physical accessibility of the service AR02 - Affordability of the service
AR03 - Flooding occurrences
AR04 - Reply to written suggestions and complaints AR06- Connection to the service
AR08 - Sewer rehabilitation AR09 - Sewer collapses
AR10 - Adequacy of human resources
Environmental Sustainability
AA13 – Real water losses
AA14 – Fulfilment of the water intake licensing AA15 - Standardized energy consumption AA16 - Sludge disposal
AR11 – Standardized energy consumption AR12 - Proper treatment of collected wastewater AR13 - Emergency control discharges
AR14 -Wastewater analysis
AR15 - Compliance with discharge parameters AR16 – Sludge disposal %
Best Practice Analysis –
ÁGUAS DO RIBATEJO
39Good service Quality Values above the national average Acceptable service Quality Values equal to the national average Unsatisfactory service Quality Values below the national average
Figure 8 – AdR Indicators and evolution
+
The aggregation played a crucial role in the raising of external funds as it was not possible for a municipality to apply individually to the
Cohesion Fund. Until now, Águas do Ribatejo have already gathered more than 75 million euros from funding
FUNDING
Funding needs represented one of the major drivers of aggregation. Obtaining funding was the only possibility to cover existing investment needs. And at the time of AdR’s creation, an aggregation was the only way to obtain funds.
Before QREN 2007-2013, it was not possible for a municipality singly to apply to the Cohesion Fund - financial instrument of the European Union that guaranteed the largest share of support to investments in drinking water supply and wastewater management, and financed all AdR’s investments. Despite AdR’s formal constitution took place only in December 2007, the process began long before that, and the aggregation of the Lezíria do Tejo allowed the municipalities to apply to this fund, resulting - in 2004 – in a substantial amount around 28 million euros. Following the exit of Santarém and Cartaxo this application was subject of reprogramming - in 2007/2008 - and the execution of investments (WS and WW) began in 2008 and have been completed in 2011.
The second, third and fourth applications were approved by POVT in 2009, 2010 and 2011. Águas do Ribatejo benefited from amounts around 22 million euros (wastewater management investments), 14.5 million euros (Drinking water supply investments) and 2.2 million euros (Drinking water supply investments, only in Torres Novas which integrated AdR later) respectively. The implementation of all investments completed in 2015.
At the end of 2015 / early 2016, there were approved by POSEUR under the Portugal 2020 program, four applications for wastewater management investments, with funding around 9.6 million euros.
Best Practice Analysis –
ÁGUAS DO RIBATEJO
40“POVT – Candidaturas.” POVT. Accessed May 18, 2016. http://www.povt.qren.pt/ “QREN - Quadro de Referência Estratégico Nacional.” Accessed May 18. http://www.qren.pt/ “POSEUR – Documentação” POSEUR. Accessed May 18, 2016. https://poseur.portugal2020.pt/
2. PHASE I: DIAGNOSIS
SECTOR’S OVERVIEW
BEST PRACTICE: ÁGUAS DO RIBATEJO
BEST PRACTICE: ÁGUAS DA REGIÃO DE AVEIRO
BEST PRACTICE: SIMAS OEIRAS E AMADORA
41
PHASE II: ANALYSIS
March, 21st– April, 26th
PHASE III: RECOMMENDATIONS
April, 26th- May, 11nd Development of a “Light” Management Model Advantages Variables Applicability
Determination and Analysis of a Pilot CIM Douro Qualitative analysis Aggregation model Scenarios Recommendations for ERSAR Implementation Plan Recommendations for Municipalities Selling Package PHASE I: DIAGNOSIS
Water and Wastewater Sector’s Overview WS and WW gross operators WS and WW retail operators Financial Analysis Management Models’ Study
National Best Practices Analysis
Águas do Ribatejo Águas da Região de Aveiro Sistemas Intermunicipais de Água e Saneamento – Oeiras e Amadora
+
The main motivations for the aggregation in the region of Aveiro were the environmental issues around the Ria and the need for a financially
sustainable business. The good relations between the municipalities was a great contribution for the success of the aggregation
MOTIVATIONS FOR THE AGGREGATION
As well as it happened for Águas do Ribatejo, there were three major reasons for the aggregation of the municipalities of Aveiro region: a concern with economic and financial sustainability of the service and environment, being Aveiro a region with a lot of focusing around the Ria. This sustainability required a large investment which, in turn, required funding.
HISTORICAL FRAMEWORK
The need for the development of drinking water supply and wastewater management services was quite remarkable which was revealed on the municipalities’ initiative for the aggregation. Its success can be explained by the good relations existent between municipalities which had to have gathered together in the past to solve problems for regional development and planning matters. The environmental issue around the Ria de Aveiro united the region municipalities on several occasions: at the end of the 80s, the municipalities faced a big pollution problem on Ria de Aveiro, which led to the creation of the Ria’s Association of Municipalities. Later on, in 1997, municipalities created SIMRIA1– and Integrated Sanitation System of Ria Municipalities1. It was also created a
Regional Sanitation System and Municipal System in ”gross” services2- Carvoeiro Vouga and the concession still exists and has
been assigned to a private. This Municipal System explores the water source in the Vouga river, and aims the protection of the aquifer in the area - non-renewable aquifer.
Thus, the aggregation in the “retail” occurred in 2009, through a Public Partnership Agreement. In that same year nine municipalities joined the aggregation, and the tenth joined only in 2010.
FUNDING
Aggregation allowed municipalities to fulfil the necessary requirements for access to funds that, in turn, still allow the achievement of various investments.
INVESTMENT
Before the aggregation, the level of infrastructure in Wastewater Management was very underdeveloped; It was necessary to improve the service quality, reduce
water losses and infiltration in network at a regional scale and not just in certain municipalities.
ECONOMIC AND ENVIRONMENTAL SUSTAINABILITY
In Aveiro county, environmental issue is very important; Municipalities realized that drinking water sector could
benefit from operators with larger scale and aggregation would allow a more efficient management of the service.