PERCEPTIONS TOWARDS HEALTHY DIET OF THE PORTUGUESE
ACCORDING TO AREA OF WORK OR STUDIES
Ana Cristina FERRÃO
1*, Paula CORREIA
2, Manuela FERREIRA
2, Raquel P. F. GUINÉ
2 1Instituto Politecnico de Viseu Escola Superior Agraria de Viseu, Departamento de Indústrias Alimentares,Quinta da Alagoa, Estrada de Nelas, Ranhados, Viseu, 3500-606, Portugal
2CI&DETS/CERNAS Research Centres, Polytechnic Institute of Viseu, Campus Politécnico, Repeses, Viseu, 3500-606, Portugal
Received: Jun 14, 2018
Accepted: Jan 3, 2019 Original scientific article
Introduction: A healthy diet is crucial for the maintenance of health. Therefore, the aim of this work is to evaluate the perceptions towards a healthy diet among the participants with work or studies in areas related to diet and nutrition and those who did not.
Methods: Anonymous questionnaire data was collected in a cross-sectional study on a non-probabilistic sample of 902 participants living in Portugal.
Results: The results showed that the participants’ perceptions were, in general, compliant with a healthy diet. However, significant differences were found between gender (p=0.004), between the different civil state groups (p=0.016), between the participants who were responsible for buying their own food and those who were not and also regarding the living environment. The variable area of work or studies also showed significant differences (p=0.001), so that people who had work or studies related to agriculture obtained a higher score. Regarding this variable, the mean values of nutrition and agriculture areas were not statistically different between them, but were statistically different from the mean values of psychology and health areas. The participants who had work or studies in areas showing diet and nutrition-related issues achieved a higher mean score (0.72±0.35) when compared to the participants who did not (0.58±0.30).
Conclusion: However, despite the results, it is important to continue developing campaigns that better communicate nutritional aspects, so that people can increase their knowledge on this subject.
Uvod: Zdrava prehrana je ključnega pomena za ohranjanje zdravja. Zato je cilj te študije oceniti dojemanje zdrave prehrane med v raziskavi sodelujočimi zaposlenimi in študenti, ki so profesionalno povezani s področjem prehrane, in tistimi, ki to niso.
Metode: Anonimni podatki iz vprašalnika so bili zbrani v medsektorski študiji z verjetnostnim vzorčenjem 902. sodelujočih, ki prebivajo na Portugalskem.
Rezultati: Rezultati so pokazali, da je dojemanje zdrave prehrane med sodelujočimi v študiji na splošno v skladu z zdravo prehrano. Pokazale pa so se izrazite razlike med spoloma (p = 0,004), med različnimi skupinami glede na zakonski stan (p = 0,016), med sodelujočimi, ki so odgovorni za nakup lastne hrane, in tistimi, ki to niso, ter glede na bivalno okolje. Različna področja dela ali študija so prav tako pokazala izrazite razlike (p = 0,001), kar pomeni, da imajo osebe, ki so zaposlene na področju kmetijstva ali študirajo kaj v zvezi s prehrano, na tem področju boljše rezultate. Na podlagi te spremenljivke se povprečne vrednosti iz področja kmetijstva statistično ne razlikujejo med seboj, vendar se statistično razlikujejo od povprečnih vrednosti s področja psihologije in zdravstva. Sodelujoči, ki so profesionalno kakorkoli povezani s prehrano, so dosegli višje povprečne rezultate (0,72 ± 0,35) v primerjavi z ostalimi (0,58 ± 0,30).
Zaključek: Kljub tem rezultatom je pomembno, da nadaljujemo s promocijo zdrave prehrane in ljudi izobražujemo in ozaveščamo o pomenu zdrave prehrane.
ABSTRACT Keywords: food areas, healthy diet, nutrition knowledge, perceptions, survey, Portugal IZVLEČEK Ključne besede: področje prehrane, zdrava prehrana, znanje o prehrani, dojemanje prehrane, vprašalniki, Portugalska
*Corresponding author: Tel. + 351 232 446 640; E-mail: [email protected]
DOJEMANJE ZDRAVE PREHRANE PORTUGALCEV GLEDE NA NJIHOVO
PODROČJE DELA ALI ŠTUDIJA
1 INTRODUCTION
Healthy eating is one of the major factors that contributes to preventing people becoming overweight or obese, as well as a number of non-communicable chronic diseases (NCDs), such as heart diseases, type II diabetes and cancer (1). Eating patterns should consist of various combinations of foods that may differ in macronutrient, vitamin, and mineral compositions. Therefore, in order to follow a healthy diet it is important to emphasise the intake of vegetables, fruits, and whole grains, and to include the consumption of low-fat dairy products, poultry, fish, legumes, non-tropical vegetable oils and nuts. On the other hand, the intake of sweets, sugar-sweetened beverages and red meats should be limited (2).
According to the World Health Organization (3), smoking, physical inactivity, unhealthy diet, and alcohol are strongly associated and causally linked to the incidence of most NCDs. However, choosing to have a healthy diet is not a simple task, because people’s food choices constitute more than a simple matter about food nutritional value (4). People’s food choices are influenced by many factors, namely biological, health, emotional, social, convenience, price, ethical concerns and nutrition knowledge, among others (5, 6). Nutritional knowledge is influenced by different sociodemographic characteristics, such as age, gender, level of education, and socio-economic status (7). According to the Social Cognitive Theory (8), knowledge is one of the important determinants that contributes to change behaviour. Several studies suggested that there is a positive association between higher nutrition knowledge and the adoption of healthier dietary patterns (9, 10), as well as lower rates of obesity (11–13). However, not all studies have found an association between nutrition knowledge and healthier eating habits (14). Nevertheless, increasing people’s nutrition knowledge is still an important health strategy (15). Since the information about Portuguese nutrition knowledge is limited, it is crucial to perform more studies in this area in order to develop and implement more effective programs to encourage the choice of a healthier diet.
This study is included in the multinational project entitled “Psycho-social motivations associated with food choices and eating practices (EATMOT)” which intends to perform research about the different psychological and social motivations that determine people’s eating patterns in relation to their choices or eating habits.
The main goal of this particular study is to compare the perceptions towards a healthy diet between the participants who had work or studies in areas that addressed diet and nutrition-related issues and those who did not have. The study also analyses in what way other sociodemographic factors could influence the
2 MATERIALS AND METHODS 2.1 Instrument
For this study, a questionnaire was purposely created to take into consideration a literature review of other existing instruments (16–22). The questionnaire included two parts destined to collect information about several important issues:
Part I – Sociodemographic data (1. Age; 2. Gender; 3. Highest level of education completed; 4. Living environment; 5. Civil state; 6. Present professional activity; 7. Area of the professional activity or studies; 8. “Are you responsible for buying the food you eat?”); Part II – Perceptions about a healthy diet (1. “A healthy diet is based on calorie count”; 2. “We should never consume sugary products”; 3. “Fruit and vegetables are very important for a practice of healthy eating”; 4. “A healthy diet should be balanced, varied and complete”; 5. “We can eat everything, as long as it is in small quantities”; 6. “I believe that food produced in a biological way is healthier” and 7. “We should never consume fat products”).
In order to measure the perceptions towards a healthy diet, a scale ranging from -2 to +2 was used, which can be interpreted as follows: [-2.0 ; -1.5] perceptions not at all compliant with a healthy diet; [-1.5 ; -0.5] perceptions not compliant with a healthy diet; [-0.5 ; 0.5] perceptions poorly compliant with a healthy diet; [0.5 ; 1.5] perceptions compliant with a healthy diet; [1.5 ; 2.0] perceptions fully compliant with a healthy diet. Then, an average of the scores obtained for all the items included in part II of the questionnaire was calculated.
2.2 Data Collection
A descriptive cross-sectional study on a non-probabilistic sample of 902 participants was undertaken. The data was collected from September 2017 to January 2018, among the Portuguese population. The questionnaires were applied online, after informed consent, only to adults (aged 18 or over). All ethical issues were verified when formulating and applying the questionnaire, which was approved by the Ethical Committee with reference no. 04/2017.
2.3 Statistical Analysis
For exploratory analysis of the data, several basic descriptive statistical tools were used, for example, the mean and standard deviation. In all tests, the level of significance considered was 5% (p<0.05) and for all data analyses the SPSS software from IBM Inc. (version 24) was used.
In order to compare the means of two groups, the Student´s t-test for independent samples was used and for the comparison of the means of three or more groups one-way ANOVA was used. In the case of ANOVA, to assess the differences between groups the post-hoc Tukey HSD test was used. The Tukey’s test, also known as the Tukey’s HSD (Honestly Significant Difference) test is a statistical test to find out which means are significantly different from each other, and consists of a single-step multiple comparison procedure, coupled to ANOVA (23). In this test, the difference between means is evaluated to see whether or not it is greater than the standard error (24– 26).
3 RESULTS AND DISCUSSION 3.1 Sample Characterization
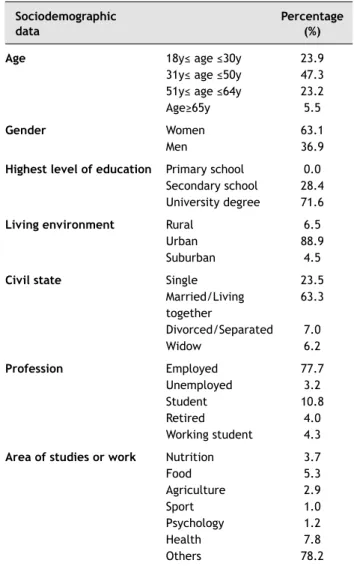
Table 1 summarises the demographical data for the sample being studied. This work involved 902 participants aged a minimum of 19 years and a maximum of 80 years, being on average 42±13 years, from which 63.1% were women and 36.9% were men. The average age of men, 44±14 years, was higher than that of women, 41±13 years. As for age, the participants were classified into categories according to: young adults (18≤ age ≤30), corresponding to 23.9%; average adults (31≤ age ≤50), accounting for 47.3%; senior adults (51≤ age ≤64), representing 23.2%; and finally elderly (≥65), which accounted for 5.5% of the sample.
Concerning the level of education, 71.6% of the participants had a university degree, 28.4% had completed secondary school, and none had the primary school as the highest level of education achieved.
Regarding the civil state, most of the participants were married or lived together as a marital couple (63.3%), 23.5% were single, 7.0% were divorced or separated and 6.2% were widowed.
As for the living environment, 88.9% of the participants lived in an urban area, 6.5% lived in rural areas and 4.5% lived in a suburban area.
Regarding the profession, most of the participants were employed (77.7%), 10.8% were students, 4.3% were working students, 4.0% were retired and 3.2% were unemployed.
Table 1. Sociodemographical characterization. Sociodemographic
data Percentage(%)
Age
Gender
Highest level of education
Living environment
Civil state
Profession
Area of studies or work
18y≤ age ≤30y 31y≤ age ≤50y 51y≤ age ≤64y Age≥65y Women Men Primary school Secondary school University degree Rural Urban Suburban Single Married/Living together Divorced/Separated Widow Employed Unemployed Student Retired Working student Nutrition Food Agriculture Sport Psychology Health Others 23.9 47.3 23.2 5.5 63.1 36.9 0.0 28.4 71.6 6.5 88.9 4.5 23.5 63.3 7.0 6.2 77.7 3.2 10.8 4.0 4.3 3.7 5.3 2.9 1.0 1.2 7.8 78.2
Concerning the participants’ professional activity or field of studies, the majority of the participants, 78.2%, did not have any professional activity or field of studies related to any of the options suggested (nutrition, food science, agriculture, sport, psychology, activities related to other health areas), 7.8% had a professional activity or field of studies related to other health areas, 5.3% had a professional activity or field of studies related to food, 3.7% had a professional activity or field of studies related to nutrition, 2.9% had a professional activity or field of studies related to agriculture, 1.2% had a professional activity or field of studies related to psychology and only 1.0% had an activity or studies in the sport area. In general, 20.6% of the participants had a professional activity or field of studies related to areas that addressed diet and nutrition-related issues, against 79.4% who did not. When seen by gender, a higher percentage of women, 24.6%, had a professional activity or field of studies related to that area when compared to men (15.3%).
When the participants were asked if they were responsible for buying their own food, 97.2% answered yes against only 2.8% that answered no, having a similar percentage for both men and women, 97.0% and 97.4%, respectively.
3.2 Perceptions Towards a Healthy Diet 3.2.1 Individual’s Characteristics
For the sample at study, the mean score for the participants’ perceptions towards a healthy diet was equal to 0.61±0.31, meaning that, in general, the participants’ perceptions were compliant with a healthy diet.
Table 2 presents the results for the relations between an individual’s characteristics and their perceptions towards a healthy diet and, as it can be observed, the mean scores were similar for all age groups and were between 0.5 and 1.0, which means that for those participants the perceptions were compliant with a healthy diet. The results of the ANOVA test revealed that there were no significant differences in the perceptions towards healthy eating among age groups. This finding is consistent with another study, in which it was also shown that nutritional knowledge was not associated with age (27).
Regarding gender, it was found that both men and women had perceptions compliant with a healthy diet, with a higher mean score for women (0.63±0.33) when compared to men (0.57±0.28). As was expected, there were found to be significant differences between genders. Previous studies also suggested that women tended to have a higher nutritional knowledge than men (28, 29).
As for the civil state, all groups had mean values between 0.5 and 1.5, corresponding to perceptions compliant with a healthy diet in all cases. The results of the ANOVA test showed that there were significant differences between the civil state groups. In fact, living arrangements and marital status have been shown to have a significant effect on a person’s health and mortality (30) and, generally, married people tend to have better health profiles than other people, including those who are divorced, separated or widowed (31–33).
Table 2. Relations between an individual’s characteristics and their perceptions towards a healthy diet (scale from -2=perceptions not at all compliant with a healthy diet to +2=perceptions fully compliant with a healthy diet).
1ANOVA for comparison of 3 or more groups (Level of significance 5%).
Mean values with the same letter are not statistically different (p<0.05).
2Student’s t-test for independent samples for comparison of 2 groups (Level of significance 5%).
Variable Mean±SD p
Age group
Gender Civil state
Highest level of education Is responsible for buying the food Living environment
18y≤ age ≤30y 31y≤ age ≤50y 51y≤ age ≤64y Age≥65y Women Men Single Married/Living together Divorced/Separated Widowed Secondary school University Yes No Rural Urban Suburban 0.61±0.31a 0.61±0.31a 0.61±0.33a 0.54±0.26a 0.63±0.33 0.57±0.28 0.66±0.33a 0.60±0.31a 0.55±0.31a 0.55±0.21a 0.61±0.31 0.61±0.31 0.60 ±0.31 0.88±0.30 0.83±0.35b 0.58±0.30a 0.86±0.29b 0.4851 0.0042 0.0161 0.9522 0.0002 0.0001
Regarding the level of education, it was observed that there were no significant differences between the participants who had a university degree and those who had secondary school as their terminal education. In both cases, the mean score was equal to 0.61±0.31, meaning that for those participants the perceptions were compliant with a healthy diet. This finding is not consistent with the ones obtained in previous studies, where it was found that a higher level of education usually corresponds to a better nutritional knowledge (27, 34).
The results of the Student’s t-test showed that there were significant differences between the participants who were responsible for buying their own food and the participants who were not, with the participants who were not responsible being the ones that obtained the highest mean score (0.88±0.30). However, in both cases the participants’ perceptions were compliant with a healthy diet.
Concerning the living environment, with a higher mean score came the participants who lived in suburban areas (0.86±0.29), followed by the participants who lived in rural areas (0.83±0.35) and finally the ones who lived in urban areas (0.58±0.30), meaning that for those participants the perceptions were compliant with a healthy diet. Furthermore, there were found to be significant differences in the perceptions towards healthy eating among the participants that lived in different areas.
3.2.2 Professional Characteristics
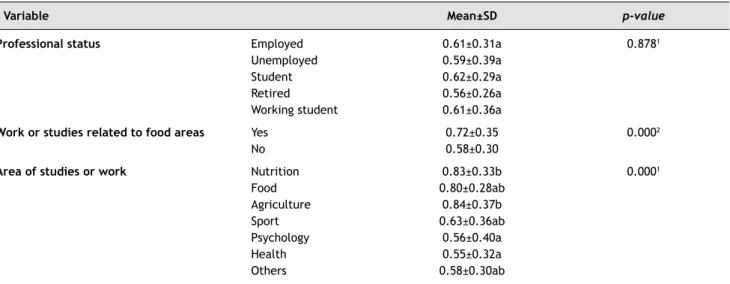
Table 3 presents the relations between professional characteristics and the perceptions towards a healthy diet and, as can be observed, the scores obtained for the perceptions towards a healthy diet according to the professional status were 0.62±0.29 for students, 0.61±0.31 for employed participants, 0.61±0.36 for working students, 0.59±0.39 for unemployed participants and 0.56±0.26 for retired, which means that the participants in all of these professional groups had perceptions compliant with a healthy diet. However, no significant differences were found. According to scientific evidences, an unhealthy diet and adverse effects on health are generally associated with lower incomes, lower education or working in lower status (35, 36). Others studies suggested that students are only slightly aware of nutrition issues and their knowledge and attitudes are average (37).
The results also revealed that the participants who had work or studies in areas where diet and nutrition-related issues are addressed had a higher mean score than the participants who did not have (0.72±0.35 and 0.58±0.30, respectively). As it was expected, significant differences were found between these two groups concerning the perceptions towards a healthy diet. Nevertheless, in both cases the participants’ perceptions were compliant with a healthy diet.
Table 3. Relations between professional characteristics and the perceptions towards a healthy diet (scale from -2=perceptions not at all compliant with a healthy diet to +2=perceptions fully compliant with a healthy diet).
Variable Mean±SD p-value
Professional status
Work or studies related to food areas Area of studies or work
Employed Unemployed Student Retired Working student Yes No Nutrition Food Agriculture Sport Psychology Health Others 0.61±0.31a 0.59±0.39a 0.62±0.29a 0.56±0.26a 0.61±0.36a 0.72±0.35 0.58±0.30 0.83±0.33b 0.80±0.28ab 0.84±0.37b 0.63±0.36ab 0.56±0.40a 0.55±0.32a 0.58±0.30ab 0.8781 0.0002 0.0001
1ANOVA for comparison of 3 or more groups (Level of significance 5%).
Mean values with the same letter are not statistically different (p<0.05).
As for the area of studies or work, the participants who had work or studies related to agriculture were the ones obtaining the highest score (0.84±0.37), followed by the participants who had work or studies related to nutrition (0.83±0.33), the participants who had work or studies related to food (0.80±0.28), the participants who had work or studies related to sport (0.63±0.36), the participants who had work or studies related to other areas (0.58±0.30), the participants who had work or studies related to psychology (0.56±0.40) and finally the participants who had work or studies related to health areas (0.55±0.32). Nevertheless, in all cases the participants’ perceptions were compliant with a healthy diet. Furthermore, significant differences were found among the areas of study/work. More specifically, the mean values of nutrition and agriculture areas were statistically different from the mean values of psychology and health areas. Kris-Etherton et al. (38) reviewed the status of nutrition education for healthcare professionals, namely physicians, in the United States, United Kingdom, and also Australia. They concluded that most healthcare professionals are not adequately trained to address diet and nutrition-related issues with their patients. On the contrary, according to the results of the study by Alissa et al. (39), most medical students are aware about the importance of a healthy diet. In another study by Peltzer et al. (40), it was observed that there was no association between risk awareness and health risk behaviour among health science students and there was an inverse association among non-health science students.
4 CONCLUSION
This study allowed for the obtaining of important results about people’s perceptions towards a healthy diet in a sample of the Portuguese population, namely, in general, the participants’ perceptions were compliant with a healthy diet. There were no significant differences in healthy diet perceptions’ scores regarding age group, level of education, and professional status. On the other hand, there were significant differences among gender, civil state, the fact that the participants were responsible for buying their own food or not, the living environment and the area of studies or work.
Regarding the area of work/studies, the highest score achieved was for the participants who had work or studies in agriculture areas and the lowest for the ones who had work/study in health areas. The mean values obtained for nutrition and agriculture areas were not statistically different between them, but they were statistically different from the scores obtained for psychology and health areas.
Overall, the results suggested that the participants who had work or studies in areas where diet and nutrition-related issues are addressed are more aware about some nutritional aspects of their diet than the participants who did not.
However, there were no mean scores equal or higher than 1.50, which means that in none of the cases the participants’ perceptions were fully compliant with a healthy diet. Therefore, it is crucial to continue developing health promotion projects that allow for increasing people’s nutrition knowledge.
CONFLICTS OF INTEREST
The authors declare that no conflicts of interest exist.
ACKNOWLEDGEMENT
This work was prepared in the ambit of the multinational project EATMOT from CI&DETS Research Centre (IPV – Viseu, Portugal) with reference PROJ/CI&DETS/CGD/0012.
ETHICAL APPROVAL
Received from the Ethical Committee with the reference no. 04/2017.
REFERENCES
1. Schermel A, Mendoza J, Henson S, Dukeshire S, Pasut L, Emrich TE, et al. Canadians’ perceptions of food, diet, and health – a national survey. Plos One. 2014;9:e86000. doi: 10.1371/journal. pone.0086000.
2. Eckel RH, Jakicic JM, Ard JD, Jesus JM de, Miller NH, Hubbard VS, et al. 2013 AHA/ACC guideline on lifestyle management to reduce cardiovascular risk: a report of the American College of Cardiology/ American Heart Association Task Force on Practice Guidelines. J Am Coll Cardiol. 2014;63(25 Part B):2960–84. doi: 10.1016/j. jacc.2013.11.003.
3. Burden: mortality, morbidity and risk factors. In: World Health Organization. Global status report on noncommunicable diseases. Geneva: WHO, 2011:176.
4. Sun Y-HC. Health concern, food choice motives, and attitudes toward healthy eating: the mediating role of food choice motives. Appetite. 2008;51:42–9. doi: 10.1016/j.appet.2007.11.004.
5. Cunha LM, Cabral D, Moura AP, de Almeida MDV. Application of the food choice questionnaire across cultures: systematic review of cross-cultural and single country studies. Food Qual Prefer. 2018;64:21–36. doi: 10.1016/j.foodqual.2017.10.007.
6. Kullen CJ, Iredale L, Prvan T, O’Connor HT. Evaluation of general nutrition knowledge in australian military personnel. J Acad Nutr Diet. 2016;116:251–8. doi: 10.1016/j.jand.2015.08.014.
7. Barreiro-Hurlé J, Gracia A, de-Magistris T. Does nutrition information on food products lead to healthier food choices? Food Policy. 2010;35:221–9. doi: 10.1016/j.foodpol.2009.12.006.
8. Bandura A, National Inst of Mental Health. Prentice-Hall series in social learning theory. Social foundations of thought and action: a social cognitive theory. Englewood Cliffs: Prentice-Hall, 1986. 9. Bukenya R, Ahmed A, Andrade JM, Grigsby-Toussaint DS, Muyonga J,
Andrade JE. Validity and reliability of general nutrition knowledge questionnaire for adults in Uganda. Nutrients. 2017;9:172. doi: 10.3390/nu9020172.
10. Hendrie GA, Coveney J, Cox D. Exploring nutrition knowledge and the demographic variation in knowledge levels in an Australian community sample. Public Health Nutr. 2008;11:1365–71.doi: 10.1017/S1368980008003042.
11. Bonaccio M, DiCastelnuovo A, Costanzo S, De Lucia F, Olivieri M, Donati MB, et al. Nutrition knowledge is associated with higher adherence to Mediterranean diet and lower prevalence of obesity: results from the Moli-sani study. Appetite. 2013;68:139–46. doi: 10.1016/j.appet.2013.04.026.
12. De Vriendt T, Matthys C, Verbeke W, Pynaert I, De Henauw S. Determinants of nutrition knowledge in young and middle-aged Belgian women and the association with their dietary behaviour. Appetite. 2009;52:788–92. doi: 10.1016/j.appet.2013.04.026. 13. Grosso G, Mistretta A, Turconi G, Cena H, Roggi C, Galvano F.
Nutrition knowledge and other determinants of food intake and lifestyle habits in children and young adolescents living in a rural area of Sicily, South Italy. Public Health Nutr. 2013;16:1827–36. doi: 10.1017/S1368980012003965.
14. Jones AM, Lamp C, Neelon M, Nicholson Y, Schneider C, Wooten Swanson P, et al. Reliability and validity of nutrition knowledge questionnaire for adults. J Nutr Educ Behav. 2015;47:69–74. doi: 10.1016/j.jneb.2014.08.003.
15. Hartmann C, Keller C, Siegrist M. Compensatory beliefs, nutrition knowledge and eating styles of users and non-users of meal replacement products. Appetite. 2016;105:775–81. doi: 10.1016/j. appet.2016.07.013.
16. Aikman SN, Crites SL, Fabrigar LR. Beyond affect and cognition: identification of the informational bases of food attitudes. J Appl Soc Psychol. 2006;36:340–82. doi: 10.1111/j.0021-9029.2006.00011.x. 17. Jackson B, Lynne Cooper M, Mintz L, Albino A. Motivations to eat:
scale development and validation. J Res Personal. 2003;37:297–318. doi: 10.1016/S0092-6566(02)00574-3.
18. Lindeman M, Väänänen M. Measurement of ethical food choice motives. Appetite. 2000;34:55–9. doi: 10.1006/appe.1999.0293. 19. Renner B, Sproesser G, Strohbach S, Schupp HT. Why we eat what we
eat: The Eating Motivation Survey (TEMS). Appetite. 2012;59:117–28. doi: 10.1016/j.appet.2012.04.004.
20. Roininen K, Lähteenmäki L, Tuorila H. Quantification of consumer attitudes to health and hedonic characteristics of foods. Appetite. 1999;33:71–88. doi: 10.1006/appe.1999.0232.
21. Steptoe A, Pollard TM, Wardle J. Development of a measure of the motives underlying the selection of food: the food choice questionnaire. Appetite. 1995;25:267–84. doi: 10.1006/ appe.1995.0061.
22. van Strien T, Frijters JER, Bergers GPA, Defares PB. The Dutch Eating Behavior Questionnaire (DEBQ) for assessment of restrained, emotional, and external eating behavior. Int J Eat Disord. 1986;5:295–315.
23. Guiné RPF, Almeida IC, Correia AC, Gonçalves FJ. Evaluation of the physical, chemical and sensory properties of raisins produced from grapes of the cultivar Crimson. J Food Meas Charact. 2015;9:337–46. doi: 10.1007/s11694-015-9241-8.
24. Guiné RPF, Henriques F, Barroca MJ. Influence of drying treatments on the physical and chemical properties of cucumber. J Food Meas Charact. 2014;8:195–206. doi: 10.1007/s11694-014-9180-9. 25. Rodrigues Â, Correia P, Guiné R. Physical, chemical and sensorial
properties of healthy and mixture breads in Portugal. J Food Meas Charact. 2014;8:70–80. doi: 10.1007/s11694-013-9166-z.
26. Santos SCRVL, Guiné RPF, Barros A. Effect of drying temperatures on the phenolic composition and antioxidant activity of pears of Rocha variety (Pyrus communis L.). J Food Meas Charact. 2014;8:105–12. doi: 10.1007/s11694-014-9170-y.
27. Carrillo E, Varela P, Fiszman S. Influence of nutritional knowledge on the use and interpretation of Spanish nutritional food labels. J Food Sci. 2012;77:H1–8.doi: 10.1111/j.1750-3841.2011.02479.x. 28. Gracia A, Loureiro M, Nayga RM. Do consumers perceive benefits
from the implementation of an EU mandatory nutritional labelling program? Food Policy. 2007;32:160–74. doi: 10.1016/j. foodpol.2006.04.002.
29. Misra R. Knowledge, attitudes, and label use among college students. J Am Diet Assoc. 2007;107:2130–4. doi: 10.1016/j.jada.2007.09.001. 30. Robards J, Evandrou M, Falkingham J, Vlachantoni A. Marital status,
health and mortality. Maturitas. 2012;73:295–9. doi: 10.1016/j. maturitas.2012.08.007.
31. Elwert F, Christakis NA. Widowhood and race. Am Sociol Rev. 2006;71:16–41. doi: 10.1177/000312240607100102.
32. Kang J, Kim J, Lee M-A. Marital status and mortality: does family structure in childhood matter? Soc Sci Med. 2016;159:152–60. doi: 10.1016/j.socscimed.2016.05.010.
33. Mineau GP, Smith KR, Bean LL. Historical trends of survival among widows and widowers. Soc Sci Med. 1982. 2002;54:245–54. 34. MacArthur RL, Wang YH, Feng X. Influence of age and education on
nutritional knowledge and dietary choices among Chinese consumers in Shenyang, China. Malasyan J Nutr. 2016;22:17–28.
35. Mayén A-L, Marques-Vidal P, Paccaud F, Bovet P, Stringhini S. Socioeconomic determinants of dietary patterns in low- and middle-income countries: a systematic review. Am J Clin Nutr. 2014;100:1520–31. doi: 10.3945/ajcn.114.089029.
36. Tang KL, Rashid R, Godley J, Ghali WA. Association between subjective social status and cardiovascular disease and cardiovascular risk factors: a systematic review and meta-analysis. BMJ Open. 2016;6. doi: 10.1136/bmjopen-2015-010137.
37. Lowry R, Galuska DA, Fulton JE, Wechsler H, Kann L, Collins JL. Physical activity, food choice, and weight management goals and practices among U.S. college students. Am J Prev Med. 2000;18:18– 27. doi: 10.1016/S0749-3797(99)00107-5.
38. Kris-Etherton PM, Akabas SR, Douglas P, Kohlmeier M, Laur C, Lenders CM, et al. Nutrition competencies in health professionals’ education and training: a new paradigm. Adv Nutr. 2015;6:83–7. doi: 10.3945/ an.114.006734.
39. Alissa EM, Alsawadi H, Zedan A, Alqarni D, Bakry M, Hli NB. Knowledge, attitude and practice of dietary and lifestyle habits among medical students in King Abdulaziz University, Saudi Arabia. Int J Nutr Food Sci. 2015;4:650. doi: 10.11648/j.ijnfs.20150406.18. 40. Peltzer K, Pengpid S, Yung TKC, Aounallah-Skhiri H, Rehman R.
Comparison of health risk behavior, awareness, and health benefit beliefs of health science and non-health science students: an international study. Nurs Health Sci. 2016;18:180–7. doi: 10.1111/ nhs.12242.