João Tiago
Viana de Matos
Aplicação de cromatografia líquida bidimensional a
misturas complexas
Application of two-dimensional liquid chromatography
to complex mixtures
Dissertação apresentada à Universidade de Aveiro para cumprimento dos requisitos necessários à obtenção do grau de Mestre em Química - Especialidade em Química Analítica e Qualidade, realizada sob a orientação científica do Doutor Armando da Costa Duarte, Professor Catedrático do Departamento de Química da Universidade de Aveiro, e da Doutora Regina Maria Brandão de Oliveira Duarte, Investigadora Auxiliar do Centro de Estudos do Ambiente e do Mar (CESAM) da Universidade de Aveiro.
O Júri
Presidente Prof. Doutor Artur Manuel Soares da Silva
professor Catedrático do Departamento de Química da Universidade de Aveiro
Prof. Doutora Teresa Alexandra Peixoto da Rocha Santos
professora Associada do Instituto Piaget de Viseu
Prof. Doutor Armando da Costa Duarte
professor Catedrático do Departamento de Química da Universidade de Aveiro
Doutora Regina Maria Brandão de Oliveira Duarte
investigadora Auxiliar do Centro de Estudos do Ambiente e do Mar (CESAM) da Universidade de Aveiro
Agradecimentos A realização desta dissertação não seria possível sem a ajuda e colaboração de diversas pessoas, a quem endereço os meus mais sinceros agradecimentos, nomeadamente:
Aos meus orientadores, Doutor Armando da Costa Duarte e Doutora Regina Maria Brandão de Oliveira Duarte, pelo tempo, disponibilidade e compreensão demonstrada ao longo de todo o trabalho desta dissertação.
À minha família por todo o apoio e suporte financeiro que me deram ao longo dos meus estudos.
Aos meus colegas e amigos que sempre me apoiaram e ajudaram nos bons e maus momentos.
A todas as outras pessoas que direta ou indiretamente contribuíram para a realização deste trabalho.
Palavras-chave Cromatografia líquida compreensiva bidimensional; Separações multidimensionais; Deteção de picos; Pureza de picos bidimensionais; Função de resposta cromatográfica bidimensional; Misturas orgânicas complexas; Impressão digital de vinhos.
Resumo A utilização de sistemas avançados de cromatografia, nomeadamente a cromatografia bidimensional acoplada a detetores multidimensionais, permite obter grandes quantidades de dados que necessitam de especiais cuidados ao serem processados, de modo a caracterizar e quantificar, tanto quanto possível, os analitos em estudo. Esta dissertação começa por identificar as principais tendências, estudos necessários e lacunas das metodologias de processamento de dados multidimensionais obtidos em cromatografia compreensiva bidimensional. Para além de vários conceitos da cromatografia unidimensional que ainda não foram testados no modo bidimensional, verifica-se a premência para a melhoria e desenvolvimento de algoritmos e software para processamento dos dados de cromatografia compreensiva bidimensional.
Assim, este trabalho apresenta uma nova função de resposta cromatográfica bidimensional (CRF2D), a qual é testada para estimar o índice de qualidade da separação de misturas orgânicas complexas por cromatografia líquida compreensiva bidimensional. Esta função baseia-se no conceito de “pureza de picos” da cromatografia líquida unidimensional, o qual foi redefinido para o modo bidimensional. A nova CRF2D também inclui outros critérios de qualidade da separação, nomeadamente o número de picos bidimensionais do cromatograma e o tempo de análise. O desempenho da CRF2D foi comparado com o de uma métrica de resolução já existente, usando para o efeito cromatogramas simulados. A capacidade da nova função para qualificar o grau total de separação que é obtido sob diferentes condições cromatográficas foi avaliada através de um estudo de uma mistura de quatro compostos aromáticos.
Finalmente, o conhecimento obtido no decorrer desta dissertação foi usado para desenvolver um protocolo para a análise de três amostras portuguesas de vinho tinto, usando um sistema de cromatografia líquida compreensiva bidimensional acoplado a um detetor de fotodíodos e a um detetor de fluorescência, de forma a obter a respectiva impressão digital cromatográfica bidimensional. As impressões digitais foram quantificadas usando a CRF2D, cujos resultados foram utilizados para comparar as amostras de vinho tinto.
Keywords Comprehensive two-dimensional liquid chromatography; Multidimensional separations; Peak detection; dimensional peak purity; Two-dimensional chromatographic response function; Complex organic mixtures; Wine fingerprinting.
Abstract The operation of advanced chromatographic systems, namely comprehensive two-dimensional chromatography coupled to multidimensional detectors, allows achieving a great deal of data that need special care to be processed in order to characterize and quantify as much as possible the analytes under study. This dissertation starts by identifying the main trends, research needs and gaps on the techniques for data processing of multidimensional data sets obtained from comprehensive two-dimensional chromatography. Apart from using other concepts from one-dimensional chromatography, which have not been tested for two-dimensional chromatography, there is still room for new improvements and developments in algorithms and software for dealing with two-dimensional comprehensive chromatographic data.
Therefore, this work presents a new two-dimensional chromatographic response function (CRF2D) for the estimation of the quality index of separation in comprehensive two-dimensional liquid chromatography of complex organic mixtures. This objective function is based on the concept of peak purity for one-dimensional liquid chromatography, which has been redefined for comprehensive two-dimensional liquid chromatography. The new CRF2D also includes other separation quality criteria, namely the number of two-dimensional peaks appearing in the chromatogram and the analysis time. The performance of the developed CRF2D was compared to an existing resolution metric, using simulated chromatograms. The capability of the new function to qualify the overall separation degree that it is attained under different chromatographic conditions was further assessed through a comprehensive two-dimensional liquid chromatography study of a mixture of four aromatic compounds.
Finally, the knowledge obtained along this dissertation was used to develop a procedure to analyse three Portuguese red wine samples by comprehensive two-dimensional liquid chromatography coupled to a diode array and a fluorescence detectors, in order to obtain a two-dimensional chromatographic fingerprinting. The overall quality of chromatographic separation was quantified using the CRF2D, and the red wine samples were compared taking into account the obtained CRF2D values.
Table of contents
Table of contents ... XIII List of figures ...XVII List of tables ... XXI List of abbreviations ... XXIII
I Aims and structure of dissertation ... 1
1.1. Introduction ... 2
1.2. Aim of the work ... 3
1.3. Dissertation structure ... 4
II Trends in data processing of comprehensive two-dimensional chromatography ... 5
2.1. Introduction ... 6
2.2. Data acquisition and handling in comprehensive two-dimensional chromatography ... 8
2.2.1. Data pre-treatment ... 10
2.2.1.1. Modulation and interpolation of data ... 10
2.2.1.2. Data representation and visual features ... 13
2.2.1.3. Background and noise signal ... 13
2.2.1.4. Correction of shifts in retention time of peaks ... 16
2.3. Peak detection in comprehensive two-dimensional chromatography ... 18
2.3.1. Two-step peak detection algorithm ... 19
2.3.2. Inverted watershed algorithm ... 22
2.3.3. Multi-way chemometric methodologies ... 24
2.3.3.1. Parallel factor analysis model ... 24
2.3.3.1.1. Generalized rank annihilation method ... 26
2.3.3.1.2. Parallel factor analysis alternating least squares ... 27
2.3.3.2. Target finder algorithms for PARAFAC-ALS ... 28
2.3.3.2.1. Window target testing factor analysis ... 28
2.3.3.2.2. DotMap algorithm ... 29
2.3.3.3. Multivariate curve resolution with alternating least squares ... 30
2.4. From one-dimensional to two-dimensional chromatography: an extension of the concept of resolution ... 31
2.4.1.1. Retention time in two-dimensional chromatography ... 31
2.4.1.2. The concept of peak vicinity ... 32
2.4.2. Resolution in two-dimensional chromatography ... 35
2.4.2.2. The valley-to-peak ratio in two-dimensional chromatography 36
2.4.2.3. Measuring the resolution ... 38
2.5. Data analysis software ... 41
2.6. Conclusions ... 42
IIIA new chromatographic response function for assessing the separation quality in comprehensive two-dimensional liquid chromatography ... 43
3.1. Introduction ... 44
3.2. Development of a two-dimensional chromatographic response function ... 47
3.2.1. Two-dimensional peak detection ... 47
3.2.2. Assessment of the quality of separation between peaks: the concept of peak purity revisited ... 50
3.2.2.1. Two-dimensional peak fitting ... 52
3.2.2.2. Measurement of two-dimensional peak volume for assessing the peak purity ... 54
3.2.2.3. Measurement of the volume of a two-dimensional peak for assessing peak purity ... 56
3.2.3. Global model of the two-dimensional chromatographic response function for application in complex mixtures ... 59
3.3. Experimental... 60
3.3.1. Reagents and solutions ... 60
3.3.2. Instrumentation and chromatographic conditions ... 61
3.3.3. Software ... 62
3.4. Results and discussion ... 63
3.4.1. Application of the two-dimensional chromatographic response function to simulated chromatograms ... 63
3.4.2. Application of the two-dimensional chromatographic response function for assessing the separation quality of complex mixtures ... 68
3.5. Conclusions ... 73
IVApplication of a two-dimensional chromatographic response function for red wine fingerprinting ... 75
4.1. Introduction ... 76
4.2. Experimental... 78
4.2.1. Wine samples ... 78
4.2.2. Reagents and solutions ... 79
4.2.3. Excitation-emission matrix fluorescence spectroscopy of wine samples 79 4.2.4. Instrumentation and chromatographic conditions ... 80
4.2.5. Software ... 80
4.3. Results and discussion ... 81
4.3.1. Excitation-emission matrix fluorescence spectroscopy ... 81
4.3.2. Two-dimensional liquid chromatography analysis ... 83
4.3.2.1. Data pre-treatment ... 83
4.3.2.2. Two-dimensional chromatographic profiles based on the diode array detector ... 84
4.3.2.3. Two-dimensional chromatographic profiles based on the fluorescence detector ... 89
4.3.2.4. Application of the two-dimensional chromatographic response function to red wine samples ... 91
4.4. Conclusions and research needs ... 94
V Final remarks ... 95
References ... 97
Annexes ... i
Description of the wine samples ... ii
Chromatograms of sample A ... iii
Chromatograms of sample B ... iv
Fig. I-1. Number of published items in each year (A) and citations in each year (B) for the search terms of “Comprehensive two-dimensional chromatography” (solid line), “Comprehensive two-dimensional liquid chromatography” (dashed line), and “Comprehensive two-dimensional liquid chromatography chemometrics” (dotted line). The search has been made in all databases of the science search engine ISI web of knowledge (http://apps.isiknowledge.com,
6-Oct-11). 2
Fig. II-1. Representation of (A) one-dimensional chromatography (one-way data) two-dimensional chromatography (two-way data); (B) two-two-dimensional chromatography coupled with a multichannel detector (three-way data); and, (C) two-dimensional chromatography coupled with a multichannel detector
with sample replicates (four-way data). 8
Fig. II-2. Representation of a simulated data set for LC × LC: (A) raw data from the detector positioned at the end of the second column; (B) layout of the sliced one-dimensional chromatograms defined by the modulation time; (C) contour plot of a two-dimensional chromatogram after smoothing; and, (D) three dimensional plot of a two-dimensional chromatogram after smoothing. 11 Fig. II-3. Representation of a simulated data set for LC × LC-DAD chromatographic
data with expansion of a section between 84 and 98min. 12 Fig. II-4. Representation of a simulated 2D chromatogram and its component parts (A):
analytical signal (B), background (C) and noise (D) (visualization inspired by
Amigo et al. (2010)]). 14
Fig. II-5. Properties of a chromatographic peak assumed to be Gaussian (A), its first-order derivative (B), and its second-first-order derivative (C). 20 Fig. II-6. Schematic representation of peak regions of adjacent 1D peaks for different
scenarios in a chromatographic map (visualization inspired by Peters et al.
(2007a)). 21
Fig. II-7. Representation of a peak-maxima profile (A) and its corresponding two-dimensional chromatogram after merging (B) (visualization inspired by
Peters et al. (2007a)). 21
Fig. II-8. Schematic representation of a PARAFAC model with 3 components peak
(visualization inspired by Bro (1997)). 25
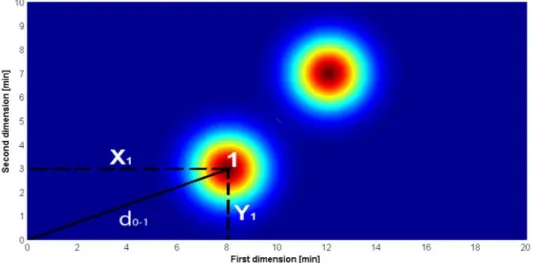
Fig. II-9. Determination of Euclidean distance for peak 1 in a two-dimensional
chromatographic map. 32
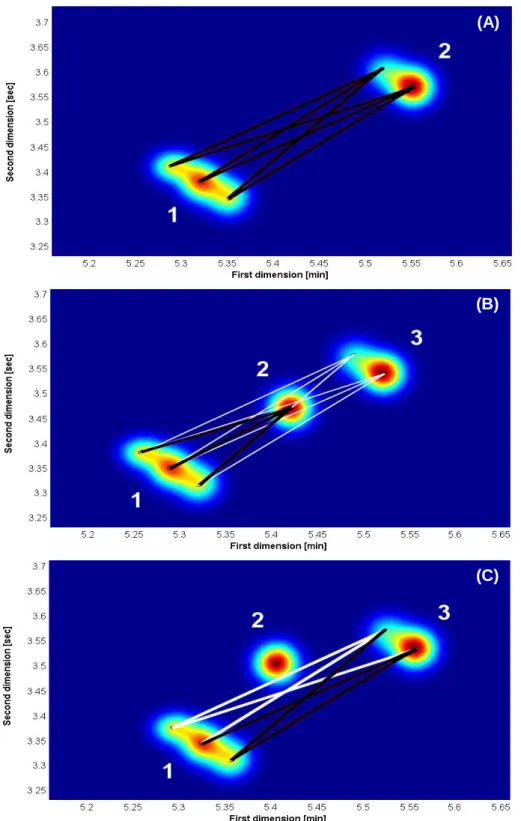
Fig. II-10. Representation of peak vicinity in three scenarios: (A) without an interfering peak; (B) with an interfering peak; and, (C) with a partial interference of another peak (visualization inspired by Peters et al. (2007b)). 34
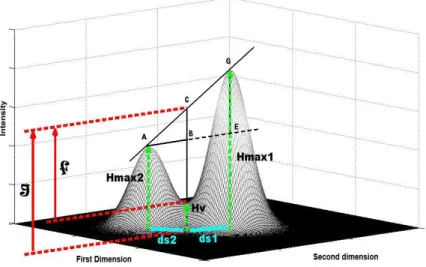
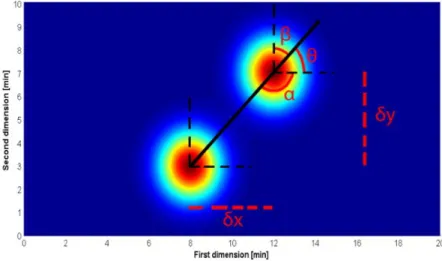
Fig. II-11. Determination of the saddle point in Gaussian peaks (A) and differentiation between saddle point and minimal point in non-Gaussian peaks (B) (visualization inspired by Peters et al. (2007b)). 35 Fig. II-12. Schematic diagram of an aid for calculation of the valley-to-peak ratio
between two overlapping peaks in two-dimensional chromatography. 37 Fig. II-13. Representation of a two-dimensional chromatogram zone for the estimation
of resolution using Equation (23). 40
Fig. III-1. Basis for definition of the algorithm for detection of two-dimensional peaks
as regional maxima. 47
Fig. III-2. Computer simulation of overlapping one-dimensional chromatographic peaks: (A) composite chromatogram (solid line) and its deconvolution (dotted line) highlighting the existence of overlapped peaks; (B) second-order
derivative of the composite chromatogram. 48
Fig. III-3. Contour plot and three-dimensional surface plot of two two-dimensional chromatographic peaks highly overlapped ((A) and (B), respectively) and the sum of their second partial derivatives ((C) and (D), respectively). 49 Fig. III-4. Representation of a portion of a two-dimensional simulated chromatogram,
with three peaks (A, B and C) and two saddle points (SAB and SBC). 50
Fig. III-5. Representation of a one-dimensional chromatogram (thick line) with the representation of the one-dimensional peaks that can explain this shape (dashed line); the shadowed regions represent the degree of interference
between two peaks. 53
Fig. III-6. Representation of a two-dimensional peak simulated by an Extreme value
peak fuction. 55
Fig. III-7. Venn diagrams representing the overlapping of two two-dimensional peaks
(A and B). 56
Fig. III-8. Venn diagrams representing the overlapping of three two-dimensional peaks
(A, B, and C). 57
Fig. III-9. Venn diagrams representing the overlapping of four two-dimensional peaks
(A, B, C and D). 58
Fig. III-10. Simulated chromatograms used to demonstrate the performance of the developed CRF2D. Si,j refers to the saddle point between peaks i and j. Refer to Table III-1 for further information on these simulations. 65
Fig. III-11. Two-dimensional chromatograms of mixtures of four aromatic compounds obtained with different amounts of ACN in the mobile phase of the first dimension: 20% (A), 40% (B), 60% (C) and 80% (D). The retention time axes were expanded for a better visualization of each 2D chromatogram, and
the detected peaks are identified by a number. 69
Fig. IV-1. Schematic representation of mainland Portugal with the Douro (red), Dão
(blue), and Alentejo (yellow) wine regions. 79
Fig. IV-2. Contour map (A) and three-dimensional graph (B) representation of the EEM
fluorescence spectrum of sample A. 82
Fig. IV-3. Contour map (A) and three-dimensional graph (B) representation of the EEM
fluorescence spectrum of sample B. 82
Fig. IV-4. Contour map (A) and three-dimensional graph (B) representation of the EEM
fluorescence spectrum of sample C. 83
Fig. IV-5. Representation of the LC × LC-DAD at 279 nm for the wine sample A (A),
wine sample B (B), and wine sample C (C). 85
Fig. IV-6. Two-dimensional chromatographic sections of sample B at different wavelengths: 259 nm (A), 263 nm (B), 267 nm (C), 271 nm (D), 275 nm (E),
279 nm (F), 283 nm (G), and 287 nm (H). 86
Fig. IV-7. Representation of the LC × LC-FLD at excitation/emission wavelengths of 230/320 nm for the wine sample A (A), wine sample B (B), and wine sample
C (C). 90
Fig. IV-8. Representation of the simulated chromatogram corresponding to the LC × LC-DAD chromatogram obtained at 279 nm for the wine sample A (A), wine
List of tables
Table III-1. Resolutions, purity and response function values calculated for the ten
simulated chromatograms shown in Fig. III-10. 67
Table III-2. Individual peak purity and CRF2D values for the four two-dimensional
chromatograms presented in Fig. III-11. 72
Table IV-1. Information regarding each studied wine sample. 78 Table IV-2. Emission and excitation wavelengths of each identified peak in the wine
samples and their respective fluorescence intensity. 81 Table IV-3. Two-dimensional peak location and relative intensity for sample A. 87 Table IV-4. Two-dimensional peak location and relative intensity for sample B. 87 Table IV-5. Two-dimensional peak location and relative intensity for sample C. 88 Table IV-6. Individual peak purity and CRF2D values for the three red wine samples. 92
List of abbreviations
ALS Alternating least squares
APTLD Alternating penalty trilinear decomposition ATLD Alternating trilinear decomposition
AU Arbitrary unit(s)
CE Capillary electrophoresis
CRF Chromatographic response function
CRF2D Two-dimensional chromatographic response function
DAD Diode array detector
DOC Controlled denomination of origin DTLD Direct trilinear decomposition FLD Fluorescence detector
GC One-dimensional gas chromatography
GC × GC Comprehensive two-dimensional gas chromatography GRAM Generalized rank annihilation method
HPLC High-performance liquid chromatography IKSFA Iterative key set factor analysis
LC One-dimensional liquid chromatography
LC × LC Comprehensive two-dimensional liquid chromatography
MS Mass spectrometer
EEM Excitation-emission matrix. MCR Multivariate curve resolution PARAFAC Parallel factor analysis
SWATLD Self-weighted alternating trilinear decomposition TOFMS Time-of-flight mass spectrometry
WTTFA Window target testing factor analysis %RSD Percentage of relative standard deviation
I
Aims and structure of dissertation
1.1. Introduction
Nowadays, the increasing need for dealing with complex mixtures from different science fields, (i.e. genomic, proteomic and metabolomics), and the lower potential of one-dimensional separation techniques to differentiate complex mixtures has raised the urgency for developing new separation methods, mostly based on comprehensive two-dimensional chromatographic techniques. This demand is supported by the increasing number of publications and citations in the last 12 years focusing on this issue, as shown in Fig. I-1.
Fig. I-1. Number of published items in each year (A) and citations in each year (B) for the search terms of “Comprehensive dimensional chromatography” (solid line), “Comprehensive
two-dimensional liquid chromatography” (dashed line), and “Comprehensive two-two-dimensional liquid chromatography chemometrics” (dotted line). The search has been made in all databases of the
science search engine ISI web of knowledge (http://apps.isiknowledge.com, 6-Oct-11). 0 50 100 150 200 250 P u b li s h e d i te m s Years 0 1000 2000 3000 4000 5000 6000 C it at io n s Years (A) (B)
For the purposes of this research work, and after refining the search results for the topic "comprehensive two-dimensional liquid chromatography" (LC × LC), it is possible to verify that this technique follows a trend similar to that shown in Fig. I-1, with the prospect of further evolving in the upcoming years. Nevertheless, the current volume of publications using this technique can still be considered relatively low taking into account its own potential. On the other hand, the major drawback normally associated with the application of these techniques is the handling and processing of the multi-dimensional chromatographic data. Usually, the type of data obtained and, consequently, all data treatment, including algorithms and methodologies developed for this purpose, are common to most of the comprehensive two-dimensional techniques (in some cases with minor modifications). However, the amount of work performed in this field is still insufficient and in most cases the published works are too complex for most users. Consequently, much work is still needed in this field of research.
1.2. Aim of the work
Given the gaps that still exist in the field of data processing for LC × LC, specially for dealing with complex mixtures, one of the main goal of this research work is to make an attempt to address this problem. Therefore, the first specific objective of this dissertation was to review the studies that have been developed in this area and to identify some of the limitations of the existing tools for data processing.
Another specific objective was to develop all the concepts and tools necessary to build a new chromatographic response function (CRF) for assessing the separation quality in LC × LC, and to demonstrate the application of this new mathematical model in simulated and real two-dimensional chromatograms.
Finally, the third specific objective entailed the optimization of the chromatographic conditions of an LC × LC system and, alongside the knowledge acquired in the previous tasks, develops a methodology for fingerprinting Portuguese red wine samples.
The work of this dissertation originated two scientific papers, one entitled “A new chromatographic response function for assessing the separation quality in comprehensive two-dimensional liquid chromatography”, which was accepted in the Journal of Chromatography A, and another one entitled “Trends in data processing of comprehensive two-dimensional chromatography: state of the art”, which was submitted to a special issue in “Chemometrics in Chromatography” on Journal of Chromatography B.
1.3. Dissertation structure
This dissertation is organized into five chapters, starting with a general description of the dissertation and a contextualization of the scientific relevance and specific objectives of the research work (Chapter I). Chapter II reviews the trends in data processing for application into the different two-dimensional chromatographic techniques, including data acquisition and handling, peak detection and quantification, measurement of overlapping of two-dimensional peaks, and data analysis software. In Chapter III, a new chromatographic response function is proposed aiming at evaluating the quality of chromatographic separation in two-dimensional chromatography, followed by its application into the LC × LC analysis of complex organic mixtures. This third chapter also revisits the existing concepts for peak detection and measurement of resolution, and presents new approaches to qualify the degree of chromatographic separation. Based on the concepts previously developed, Chapter IV presents a procedure for the LC × LC analysis of three Portuguese red wine samples and further comparison of their chromatographic fingerprint. Finally, Chapter V presents the main conclusions drawn from the current study and suggestions for future research.
II
Trends in data processing of comprehensive
two-dimensional chromatography
2.1. Introduction
The development of several one-dimensional separation techniques, such as gas chromatography (GC), liquid chromatography (LC), and capillary electrophoresis (CE), led to the generalized idea by the end of the twentieth century, that these techniques could be just finely tuned in order to solve all the practical problems in Analytical Chemistry (Stoll et al., 2007). However, the need for analysis of increasingly complex samples with a large number of compounds, highlighted the limitations of such techniques, and prompted the development of technologies with a much higher separation capacity in order they could take full advantage of coupling them to advanced detection systems, such as mass spectrometry and nuclear magnetic resonance spectroscopy.
The need for improving the analytical figures of merit associated to the research explosion in proteomics and metabolomics, and the ever increasing requirements for adequate identification and quantification of proteins, glycoproteins and metabolite products has prompted a need to push separation techniques to their limits. Furthermore, even when one-dimensional chromatography could produce acceptable results, they do not have the separation power to deal with complex samples, and their use in such cases would mean spending a lot of time for analysis (Guiochon et al., 2008, Stoll et al., 2007). The obvious response to this lack of separation power of one-dimensional techniques is the development of multidimensional chromatographic systems using two or more independent separation mechanisms.
Multidimensional separation can be understood as a separation system capable of discriminating the components from a mixture, using different separation mechanisms which are connected but do not interact among themselves, that is, they should be completely independent from each other. There are two modes of operation of multidimensional chromatography: heart-cutting and comprehensive. In the heart-cutting mode, only some selected fractions are transferred from the first into the second separation system, and the results become two separate one-dimensional data sets. On the other hand, a multidimensional chromatography is comprehensive when all fractions separated in the first separation system are successively injected into further separation systems,
comprising a fully automated methodology and providing complete chemical information of the whole sample in the different chromatographic dimensions.
As reviewed by Phillips and Beens (1999), the comprehensive multidimensional chromatography became more relevant after the development of comprehensive two-dimensional gas chromatography (GC × GC), more than a decade after the development of a first LC × LC by Erni and Frei (1978). Although the data sets resulting from GC × GC have received more attention than those resulting from any other comprehensive two-dimensional chromatographic technique, they are formally equivalent and most of the work developed for GC × GC can be applied with small modifications to other chromatographic combinations, such as LC × LC, LC × GC, and LC × CE.
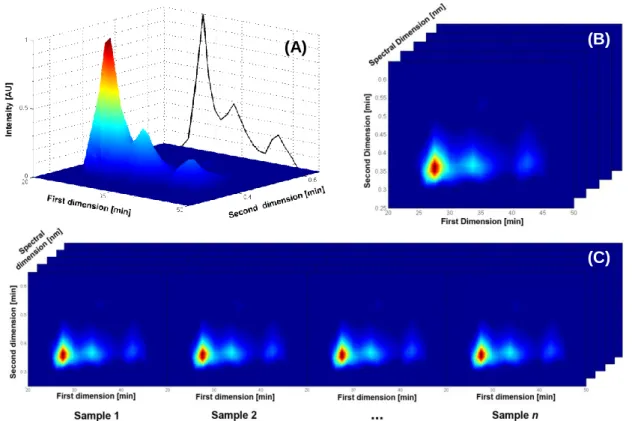
The data collected from advanced chromatographic systems designed for the analysis of complex samples contain huge amounts of information that need complex processing algorithms in order to take advantage of such powerful analytical systems. For instance, analysis of a sample with n replicates in a two-dimensional chromatographic system coupled to a multichannel detector, such as a diode array detector (DAD) or a mass spectrometer (MS) can produce quadrilinear data sets. Fig. II-1 shows how dimensionality of data sets may increase with increasing analytical dimensions: the data structure starts as one-way (Fig. II-1A) associated to one-dimensional chromatography coupled to a single channel detector, and it evolves to a two-way structure associated to a two-dimensional chromatography coupled to a single channel detector, then reaches a three-way structure (Fig. II-1B) associated to a two-dimensional chromatography coupled to a multichannel channel detector, and finally attains a four-way data structure (Fig. II-1C) obtained from n replicates in a two-dimensional chromatography system coupled to a multichannel detector.
In this chapter it is intended to discuss the state of the art in data processing for multidimensional data sets obtained in different types of two-dimensional chromatography, from the pre-treatment until the quantification of the identified chromatographic peaks. The discussion will lead to the identification of the main trends in data processing of comprehensive two-dimensional chromatography and it will pinpoint the gaps and research needs that should be tackled in this field.
Fig. II-1. Representation of (A) one-dimensional chromatography (one-way data) two-dimensional chromatography (two-way data); (B) two-dimensional chromatography coupled with a multichannel detector (three-way data); and, (C) two-dimensional chromatography coupled with a multichannel detector with sample replicates (four-way data).
2.2. Data acquisition and handling in comprehensive
two-dimensional chromatography
The massive amount of data generated from the current high-resolution analytical instrumentation requires the use of computerized assistance for data processing and transformation. The two-dimensional chromatography is no exception, and the use of informatics tools has become essential for transforming the raw analytical data into fit for purpose information. The two-dimensional chromatography produces a considerable amount of data in a relatively short time when applied to the separation of complex mixtures. Such an enhancement in performance provides an order-of-magnitude increase in peak separation capacity, when compared to one-dimensional chromatography.
(A) (B)
Handling of two-dimensional chromatography data is a challenging task namely in Analytical Chemistry. The acquisition of data in real time from two-dimensional chromatography coupled to detectors, such as DAD or MS, generates huge data files, that can reach more than 10 million data points which may lead to considerable problems in storage and processing (Guiochon et al., 2008, Porter et al., 2006). The greatest challenges lies in producing automatic tools capable of processing and converting the data matrix under useful forms without losing control on the analysis of samples for obtaining raw data, and transformation of data into useful chemical information. The scarcity of software available for data acquisition and handling in two-dimensional chromatography, especially in LC × LC, is one of the most significant impediments for a generalized adoption of these separation techniques.
There are three general approaches that can be used to deal with the two-dimensional chromatographic data. The first approach, and since the two-two-dimensional chromatograms can be considered as a set of consecutive one-dimensional chromatograms, is to deal with those chromatograms individually using all the data treatment tools already extensively developed for one-dimensional chromatography; the second approach is to deal directly with the two or higher order dimensional matrix after a previous step of data modulation; and finally, the third approach is to transform the data in an image file (also after a data modulation step) and follow further image treatment and processing. The first approach can take advantage of a full body of knowledge already designed and extensively studied for one-dimensional chromatography and the availability of a large amount of software ready for use. However, considering the long-time of analysis compared to the very short time necessary for modelling, there are a large number of one-dimensional chromatograms, and consequently there is too much time spent on each individual chromatogram. On the other hand, when dealing with two or higher order data matrix, as it is the case of the second approach, it requires knowledge and expertise on complex chemometric algorithms. This is a developing field, and the evolving work is very promising, especially for dealing with three or higher order dimensional data. Finally, and despite the use of imaging tools to deal with two-dimensional chromatograms may look like a misfit, this third approach has been in fact translated into commercially available software showing excellent results (Reichenbach et al., 2003, 2004, 2005, 2009)
2.2.1. Data pre-treatment
In a typical experiment of two-dimensional chromatography, the massive amounts of data acquired in both dimensions create large data files, which need to be processed in order to become useful. These data sets are extremely important in chemical analysis, and require the use of computational systems to process and extract the maximum chemical information possible. However, this processing requires different approaches and methodologies depending on the different ends or goals set by the analyst. Therefore, in order to accomplish this task, it becomes necessary a transformation of the data into a more suitable form, in accordance with the aim of the analytical work (Guiochon et al., 2008).
In general terms, the most common operations and important methodologies in data processing and pre-treatment in order to become possible the representation, detection and quantification of peaks are, the removal and correction of background, the attenuation of the signal noise, the correction of uncontrolled shifts in retention time, the identification and removal of signal artifacts, and the resolution of overlapping peaks (Guiochon et al., 2008, Reichenbach et al., 2004, Stoll et al., 2007).
2.2.1.1. Modulation and interpolation of data
The first step in data processing of comprehensive two-dimensional chromatography is to extract the experimental data from the detector response and build the corresponding dimensional chromatogram. In the first applications of two-dimensional separations, namely the development of LC × LC by Erni and Frei (1978), two detectors were used for measuring the analytical signals at the end of each chromatographic column. Nowadays, due to both the comprehensive methodology of the analysis and the available software, the experimental signal is only measured at the end of the second column. Consequently, in order to transform the output of the detector positioned at the end of the second column into a two-dimensional chromatogram, it is necessary to slice the output according to the modulation time of the switching valve, and
re-organize each sliced chromatogram along the time axis of the volume separated in the first column in this same modulation time.
Fig. II-2. Representation of a simulated data set for LC × LC: (A) raw data from the detector positioned at the end of the second column; (B) layout of the sliced one-dimensional chromatograms defined by the modulation time; (C) contour plot of a two-dimensional chromatogram after smoothing; and, (D) three dimensional plot of a two-dimensional chromatogram after smoothing.
(B) (A)
(C)
Fig. II-2A shows a simulated output from detector positioned at the end of a two-dimensional separation system, with a modulation time of 2 minutes. Since the modulation time is known, then the application of the slicing methodology above mentioned is straightforward, and the resulting Fig. II-2B shows the same data set but now under a form of a two-dimensional chromatogram. After data modulation, it may be necessary to smooth the chromatogram by interpolation of data points between one-dimensional chromatograms mainly along the first dimension in order to obtain a two-dimensional chromatogram as shown in Fig. II-2C and Fig. II-2D.
Nowadays, the availability of multichannel detectors coupled to chromatographic systems allows obtaining a range of spectral data instead of a single intensity reading, and therefore the operator can have an additional dimension in the data array related to the spectral information. Prior to the slicing of the chromatograms according to the modulation time, the operator faces already a two-way data array that should be taken into account. A two-way example of this experimental data, acquired in a LC × LC-DAD, is represented in Fig. II-3, with an experimental modulation time of 1.25 min and wavelength information from 215 to 300nm. Therefore, to convert the experimental data into usable chemical information it is necessary, for each wavelength signal, to divide the data according with the modulation time for building a three-dimensional data matrix. Recently, Allen and Rutan (2011) compared five different interpolation methods, including linear interpolation followed by cross correlation, piecewise cubic Hermite interpolating polynomial, cubic spline, Fourier zero-filling, and Gaussian fitting, and the authors concluded that these methods performed equally well.
Fig. II-3. Representation of a simulated data set for LC × LC-DAD chromatographic data with expansion of a section between 84 and 98min.
2.2.1.2. Data representation and visual features
For representation of a two-dimensional data matrix either the contour colour coded plot or the three-dimensional plot are the types of graphs that easily allow visualizing and understanding the distribution of peaks in a chromatogram. As shown in Fig. II-2C, such a graph does not provide quantitative information but it is an excellent visualization tool which becomes the first essential step for further processing of the data obtained. The use of a colour coded scale for peak intensity allows an immediate qualitative assessment of the different peaks and respective heights. Fig. II-2D uses the same data as in Fig. II-2C for simulating a typical two-dimensional chromatogram, and the three-dimensional plot provides already quantitative information, thus becoming the best approach to observe, analyse, and comment the visual features of three-dimensional peaks shape and form (Guiochon et al., 2008, Reichenbach et al., 2011). When dealing with higher order data dimensions, it is not possible to produce conventional contours and three-dimensional plots, since a two-dimensional chromatographic system coupled to a multichannel detector will produce a four dimensional data array.
2.2.1.3. Background and noise signal
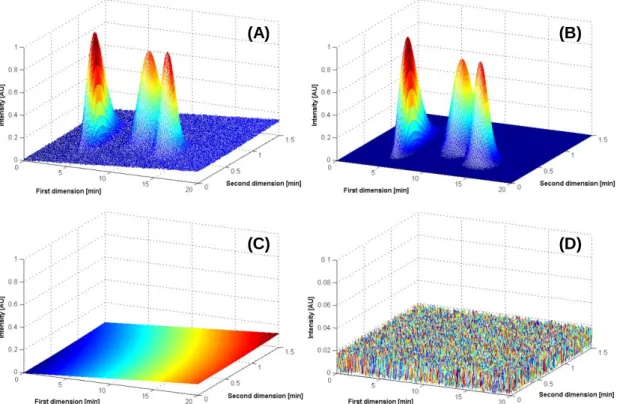
As in any other analytical methodology (Amigo et al., 2010), it is possible to separate the two-dimensional chromatographic experimental data signal (Fig. II-4A) in to three major parts: the analytical signal, the background signal, and the noise. The analytical signal, as depicted in Fig. II-4B, gives the chromatographic response of the analyte obtained for a particular set of experimental conditions and a particular detector free off any traces of noise and background effects. The background, represented in Fig. II-4C, is associated with the systematic response from the chromatographic system not related to the analyte. Finally, the noise, represented in Fig. II-4D, is associated with random variations and it is usually related to the sensitivity of the detector.
Fig. II-4. Representation of a simulated 2D chromatogram and its component parts (A): analytical signal (B), background (C) and noise (D) (visualization inspired by Amigo et al. (2010)]).
The background signal and the noise can cause many problems, particularly for quantification, since they can change both the shape and the elution time of peaks. This background drift can be caused by changes in the composition of mobile phase when in gradient mode, variation of pressure and temperature, and fluctuations caused by the injection valve. When the signal-to-noise ratio is low, it becomes difficult in practice to separate between noise and background, but in order to achieve a clear analytical signal with a flat baseline, it is necessary to identify and eliminate the interferences caused by noise and background signal. Although the noise interference can be usually reduced using smoothing algorithms, the strong background drifts are either difficult to resolve. One of the easiest ways to deal with the background interference is performing a "mean centering" of the data, but only in the presence of a relatively stable background. Another possible way is to subtract a “blank” chromatographic run obtained in the same instrumental conditions, but even so this strategy may not be very accurate due to possible changes in eluent spectrum (Zhang et al., 2007) and differences in noise between chromatograms. For overcoming the drawbacks of using simple strategies in two-dimensional chromatography,
(A) (B)
(D) (C)
more complex algorithms have been proposed for removing the background signal and noise.
Zeng et al. (2011) apply to each one-dimensional peak of a two-dimensional chromatogram a baseline correction and a moving windows average method for data smoothing. On the other hand, Zhang et al. (2007) suggested the use of the trilinear decomposition method to remove the three-dimensional background drift in two-dimensional chromatography coupled with multichannel detectors (in this case a LC × LC coupled to a DAD system). The authors (Zhang et al., 2007) used the background drift and the analytical signal as factors for building a factor model by applying an alternating trilinear decomposition (ATLD) algorithm to the raw dataset in order to extract the background factor, and then subtract it from the raw dataset. The ATLD algorithm showed adequate properties of convergence and robustness to the excess of factors used, although others chemometric methods such as parallel factor analysis (PARAFAC), self-weighted alternating trilinear decomposition (SWATLD) and alternating penalty trilinear decomposition (APTLD) algorithms can be used with similar results (Zhang et al., 2007). Finally, this methodology removes the background drift without the loss of peak information in entire spectral region and without the need for replicates and “blank” chromatograms.
An alternative technique is the use of image treatment software to estimate and remove the background from images files of two-dimensional chromatograms, as suggested and applied by Reichenbach et al. (2003) for GC × GC. This algorithm takes advantage of the following structural and statistical properties of the background from the images of two-dimensional chromatograms: dead-bands that are regions without analytical signal; the mean of background level does not change much when compared to the characteristic peak widths; and, the noise present has the same statistical properties of the random white noise. This background-removal algorithm has been included in the GC Image and LC Image software packages, which has been reported in several works (Reichenbach et al., 2003, 2004, 2005, 2009).
2.2.1.4. Correction of shifts in retention time of peaks
One of the most crucial steps in any chromatography, either one-dimensional or multidimensional, is to ensure the precision in the determination of retention time for each and every peak. This run to run time deviations are often observed in the chromatographic analysis, and can be easily identified by the comparison to the patterns of variation between replicates or standards. Due to the high sensitivity of the analytical methods, a poor precision of the retention times, when not corrected, can generate enormous deviations in the most of the chromatographic detection and quantification techniques actually used.
The fluctuations in retention time of peaks are always present in two-dimensional chromatographic systems and can be originated from variations in temperature and pressure, degradation of the stationary phase, and matrix effects. For data processing to be sucessful, there is a need to ensure that the retention times between replicates are repeatable and reproducible, the time axes are synchronized, and the peaks are properly aligned. This alignment or warping can be accomplished by using different algorithms. Fraga et al. (2001) suggested an alignment technique of the retention times based on minimizing residuals in the generalized rank annihilation method GRAM which was addressed by Prazen et al. (1998) for second-order hyphenated chromatography, namely GC-MS. On the other hand, van Mispelaar et al. (2003) suggested a correlation-optimized shifting, based in an inner-product correlation associated with selected regions of the GC × GC data. This algorithm uses a two-dimensional chromatogram reference to align all selections and as this alignment is performed, the inner-product correlation is calculated in order to identify the best-fit position. Johnson et al. (2004) described an algorithm based on windowed rank minimization alignment with interpolative stretching between the windows. In this work (Johnson et al., 2004) the algorithm was used to deal with shifted GC × GC retention times during the quantification of naphthalene in jet fuel, and it produced better results than in the case where quantification of the chromatograms was not pre-aligned. Pierce et al. (2005) reported the application of a comprehensive two-dimensional retention time alignment algorithm that allows a warping in both chromatographic dimensions using a novel indexing scheme, and preserves the separation
information in both dimensions. The algorithm was applied by Pierce et al. (2005) to GC × GC but it can be applied to any two-dimensional separation system with a gain on the retention time precision and also restoring the trilinearity of the data without losing quantitative information. Zhang et al. (2008) developed a two-dimensional Correlation Optimized Warping Algorithm, (2D-COW) to align data obtained from two-dimensional gas chromatography coupled to time-of-flight mass spectrometry (GC × GC-TOFMS). This powerful and flexible algorithm stretches and compresses a local sample segment of the two-dimensional chromatogram in order to maximize the correlation from the sample relatively to the two-dimensional chromatogram reference. Such calculations allow interpolating the warp non-grid points from the shifted grid points in order to align the chromatograms. When using image based software, the method for automatically aligning chromatograms developed by Hollingsworth et al. (2006) can be applied, as in the case of Nelson et al. (2006) and Wardlaw et al. (2008) to study the weathering of an oil spill and oil seepage, and Cordero et al. (2010) to compare coffee samples. Unfortunately, all these methodologies and algorithms cannot deal with three- or higher-way data sets, as those obtained from two-dimensional chromatography coupled to multichannel detectors. As the degree of hyphenation of several detectors to two-dimensional chromatography increases, the more urgent becomes the search for more sophisticated techniques for correction of shifts in retention times of peaks. Recently, Allen and Rutan (2011) developed an algorithm especially suited to LC × LC-DAD that allow to deal with four-way data with satisfactory results. Another issue that it is necessary to take into account in two-dimensional chromatography is the different time scale between the second dimension and the modulation period. Since the two-dimensional chromatogram is generated from a one-dimensional signal array, it is fundamental to make sure that there are not two-one-dimensional peaks “wrapped-around” (Micyus et al., 2005), i.e., the maximum range of a peak retention time in the second dimension is lower than the modulation period. One way to deal with this problem, which is quite common in chromatography of complex mixtures, is an algorithm capable of finding the absolute retention times in these cases as suggested by Micyus et al. (2005). In this algorithm, after the detection of “wrapped-around” two-dimensional peaks, a series of chromatograms are re-analysed by an integer fraction of original modulation period and shifts of the retention of the second dimension are used to determine the absolute retention times.
2.3. Peak detection in comprehensive two-dimensional
chromatography
After data pre-treatment, the most critical step in the analysis of two-dimensional chromatograms is probably the detection of a two-dimensional peak. In the past decade, many authors dedicated to develop algorithms capable of detecting two-dimensional peaks, especially for applications in GC × GC. A large part of these methodologies are a direct consequence of the already developed algorithms for one-dimensional chromatography since, in first instance, the two-dimensional separations can be understood as an upgrading of the classical column chromatography by just adding another column as a second dimension. However, with the evolution of the concept of two-dimensional chromatography, associated to the increasing use of multichannel detectors and the consequent production of a huge amount of data, it is foreseeable an augment of methodologies and algorithms that can deal with these data more efficiently in a global manner, rather than adding up one-dimensional chromatograms.
Conceptually, the peak detection algorithms can have two main purposes: in non-targeted analysis, the algorithms should be capable of identifying two-dimensional peaks in complex mixtures without any pre-information from de sample, such as the two-step peak detection algorithm (Peters et al., 2007a) and the watershed algorithm (Reichenbach et al., 2004); in targeted analysis, the algorithms need a complete or a regional two-dimensional chromatographic reference, and the peak detection is made by comparison with this standard, such as the GRAM method (Sanchez and Kowalski, 1986). Several authors, who have developed algorithms for two-dimensional peak detection, have also developed methods for quantification, since most of the analytical work involves not only the screening of peaks but also their quantification. Finally, it is important a word of caution regarding the choice of an algorithm because it may have to take into account several factors such as speed of analysis, accuracy of results, and components of interest, depending on the specific work involved.
2.3.1. Two-step peak detection algorithm
One of the most important contributions to the actual state of the art in two-dimensional chromatography has been produced by Peters et al. (2007a), namely when suggesting new methodologies and important concepts for detection and resolution of peaks in GC × GC. Theoretically, the methodology can also be applied to LC × LC with minor modifications, if any at all. For the specific case of peak detection, Peters et al. (2007a) developed an algorithm that deals with this problem in two main steps: firstly, already known methods developed for peak detection in one-dimensional chromatography are applied to detect the peaks one dimension at a time; secondly, some criteria are used to decide which peaks of the first dimension correspond to the same compound in the second dimension, that is, some criteria are set up for the process of merging the peaks from the first dimension with the peaks of the second dimension that are all produced by the same compound .
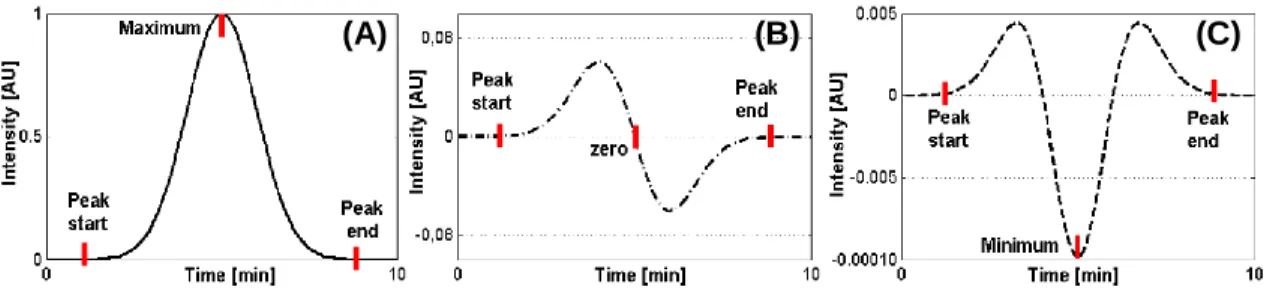
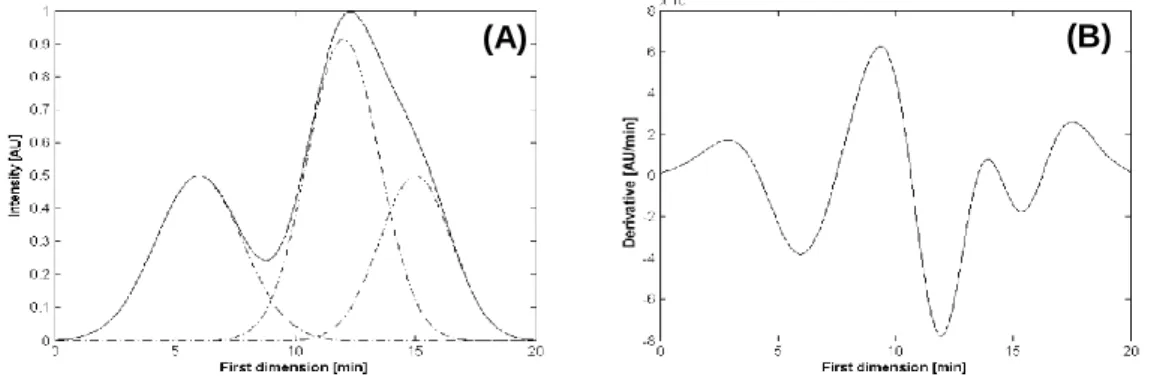
The raw data acquired in comprehensive two-dimensional chromatography is constituted by a set of one-dimensional chromatograms, each corresponding to a single injection in the second column. Once the obtained data has been organized in a two-dimensional matrix, it becomes possible to analyse all chromatograms using one-dimensional peak detection techniques. The two-step algorithm (Peters et al., 2007a) detects one-dimensional peaks based on the properties of the derivatives of the peaks computed by the Savitsky-Golay (1964) method. From the original chromatogram and from the first- and second-order derivatives, it is possible to characterize the properties of chromatographic peaks, namely the height, and the peak starting-point and end-point (peak region). As shown in Fig. II-5A, the starting-point and the end-point of a one-dimensional peak correspond to the first and last point above zero, respectively, in the first-order derivative (Fig. II-5B). Although, in practice the first derivative often does not reach zero, such a problem can be overcome by defining a minimal value to quantify (Peters et al., 2007a). On the other hand, when the value of zero for the first-order derivative coincides with the minimum of the second-order derivative (Fig. II-5C), then it means that the original chromatographic peak has reached the maximum value.
Fig. II-5. Properties of a chromatographic peak assumed to be Gaussian (A), its first-order derivative (B), and its second-order derivative (C).
After defining the peaks in the previous step, it is possible to apply an algorithm following some pre-defined criteria, in order to merge the one-dimensional peaks in the two dimensions. This algorithm produces a cluster with a collection of one-dimensional peaks in the consecutive chromatograms that belong to the peak of the same compound (Peters et al., 2007a). Ideally, the same peak in consecutive chromatograms will elute always at the same time, but sometimes such synchronization may not happen due to several operational variables, namely in GC × GC (Peters et al., 2007a) such as control and timing of cooling and heating programmes, non-linearity of distribution of isotherms, and non-instantaneous re-injections in to the second column. The process of peak merging starts off with the first peak appearing in the first chromatogram obtained in the second-dimension and the attempt of finding all the merging combinations with all the peaks found in the subsequent chromatograms of the second-dimension. Then, the overlap criterion and the unimodality criterion are applied to test whether it is possible to merge these peaks. Finally, the procedure repeats itself until all the merging combinations are tested (Peters et al., 2007a).
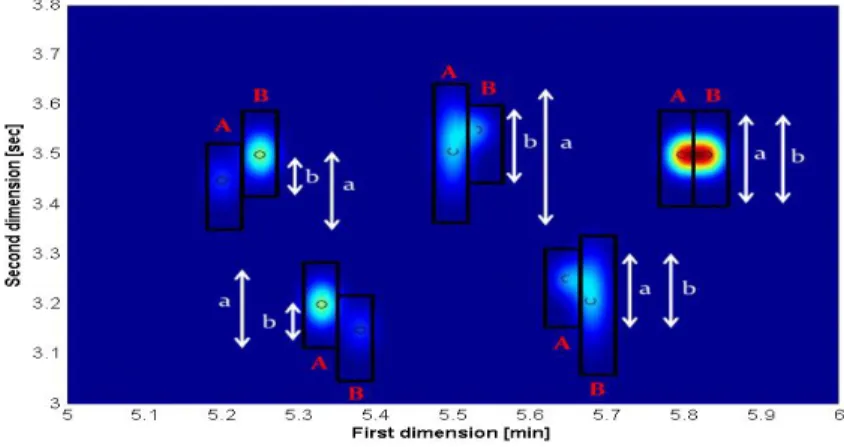
For checking whether there is any overlap of the peak region (where the peak starts and ends) in a chromatogram, the overlap criterion examines the degree of overlap of two peak regions, one from the existent two-dimensional cluster (peak A in Fig. II-6) and the other from the candidate to be merged (peak B in Fig. II-6). The ratio of overlap, in percentage, is calculated according to the following equation, as suggested by Peters et al. (2007a): % 100 a b OV (1) (A) (B) (C)
where b is the length of the region where the two peaks overlap and a is the length of the peak region of peak A (Fig. II-6).
Fig. II-6. Schematic representation of peak regions of adjacent 1D peaks for different scenarios in a chromatographic map (visualization inspired by Peters et al. (2007a)).
After that, it is necessary to define a threshold for the acceptability of the candidate peak. If the ratio of overlap is greater than this threshold than the peak can be subjected to the next criterion; otherwise, the peak cannot be merged and the algorithm continues to the next candidate (Peters et al., 2007a).
The basis for the application of unimodality criterion, as suggested by Peters et al. (2007a), is the analysis of the peak-maxima profile in the first chromatographic dimension, between the peaks checked for merging in two-dimensional clusters. As an example, Fig. II-7A shows the peak maxima profile for the two-dimensional chromatogram shown in Fig. II-7B. The observation of Fig. II-7A, allows concluding that there are two maxima, peak B and peak D, since each two-dimensional cluster can show only one maximum.
Fig. II-7. Representation of a peak-maxima profile (A) and its corresponding two-dimensional chromatogram after merging (B) (visualization inspired by Peters et al. (2007a)).
(B) (A)
Finally, it is necessary to take into special consideration the handling of the closest maxima, that is, when more than one peak has been identified at the same retention time in first dimension. In such case, it becomes necessary to compare the retention time of the candidates of the second dimension, and the candidate peak with the retention time closest to the last peak of the two-dimensional cluster is then the peak to be merged.
After the application of the two-step algorithm, Peters et al. (2007a) also describe an integration tool for the quantification of target two-dimensional peaks: the one-dimensional peaks that were used to build the target two-one-dimensional peak, are integrated using a trapezoidal method and then summed in order to achieve the quantification of target analytes. The methodology based on summation of second dimension chromatograms has been also used by Pól et al. (2006) and Kivilompolo and Hyötyläinen (2007) for the quantification of LC × LC data. A slightly different approach based on peak volume calculation for two-dimensional contour plots has been suggested by Kivilompolo et al. (2008).
In order to overcome the problem related to overlapped peaks, Peters et al. (2007a) also suggested two alternatives: a) to integrate the area under the curve from the peak start to a perpendicular line that splits the overlapped peaks in the valley point; and b) to subtract the area under the line connecting the peak start to the valley point from the total area under the curve, as above mentioned. This method is easy to implement, and does not require any user input, which makes it ideal for quantification of complex mixtures separated by two-dimensional chromatography. However, for chemometric resolution and quantification of four-way data Balley and Rutan (2011) showed the need for more sophisticated algorithms (section 2.3.3.3)
2.3.2. Inverted watershed algorithm
A completely different approach for peak detection in two-dimensional chromatography is the use of software able to deal with two-dimensional data set using image analysis tools to extract the required information. To perform this task, Reichenbach et al. (2004) suggests the use of an inverted version of the watershed algorithm, also
known as the drain algorithm. This algorithm, which can also be used as a topographical tool, assumes that the surface of analysis has its highest point at a “mountain”. When it “rains” in the “mountain”, the water tends to go down throughout the cliff, and producing puddles of water surrounding the various “mountains”. This algorithm is capable of foreseeing the movements of this rain and consequently delineates the peaks from an image (Reichenbach et al., 2004). Conceptually, the algorithm finds the highest peak and after that it will identify the neighbouring pixels until reaching the background (Latha et al., 2011). After the detection is complete, each two-dimensional peak identified is, in fact, a group of pixels. Unfortunately, the inverted watershed algorithm is very sensitive to noise and artifacts, which can cause a multi-peak detection in a single peak situation. However the application of smoothing tools to the image of the two-dimensional chromatogram may reduce the effects of these artifacts.
Once the peak detection is accomplished, then the statistical properties of the peak, such as the number of pixels (area of the peak) and the sum of pixels (volume of the peak), can be used to measure the characteristics of the two-dimensional peaks, such as symmetry, orientation or eccentricity and also to obtain quantitative information. Finally, Reichenbach et al. (2004, 2009) suggest the use of an algorithm for chemical identification by template matching. This algorithm uses the statistical properties of the peak to compare the sample peaks with statistical properties of several peak templates in order to find a match. While this algorithm can be used for peak detection and integration in two-dimensional chromatography, a study carried out by Vivó-Truyols and Janssen (2010) has shown that the probability of failure of this algorithm under normal conditions in GC × GC is around 15–20% when compared with the two-steps algorithm suggested by Peters et al. (2007a). Such a high percentage value could be a discouraging factor for a wider use of such method in Analytical Chemistry. However, Latha et al. (2011) tested 1000 cases for each set of parameter values, in order to compare the detection performance in both algorithms after a skew correction for various parameters, such as, different levels of noise, peak widths, and retention-time. The experiments allowed concluding that after a skew correction, the inverted watershed algorithm showed better results than the two-step algorithm. Furthermore, the accuracy of both algorithms decreases as the peak width and the noise increase, even after shift correction. Therefore, there is a need for improving the noise suppression techniques in order to achieve better results in both detection algorithms.
2.3.3. Multi-way chemometric methodologies
The increasing hyphenation of multi-array detectors such as DAD and MS detector to chromatographic systems, has brought the need for developing and/or adapting more sophisticated techniques, even for the one-dimensional chromatographic systems, in order to identify and resolve the overlapped peaks in the resulting multidimensional data structures (Amigo et al., 2010). One of the legacies of one-dimensional chromatography to deal with those types of data structures is the adoption of chemometric methods for the discrimination of samples, depending on the patterns of both the chromatographic retention times and the spectral characteristics (Porter et al., 2006). There is a general trend to use more and more complex chemometric algorithms to extract information from the experimental data sets, wich can attain very high dimensions and contain huge amount of data points, namely when using multichannel detectors and sample replicates. Many of these methods and their variants have already been successfully applied to two-dimensional chromatography (both LC × LC and GC × GC); as such are the cases of the Generalized Rank Annihilation Method (GRAM), Parallel Factor Analysis – Alternating Least Squares (PARAFAC-ALS), and Multivariate Curve Resolution – Alternating Least Squares (MCR-ALS).
This family of chemometric deconvolution techniques are already widely used to deal with overlapped signals from data acquired by two-dimensional chromatography coupled to various detectors in quantitative analysis of complex samples. Their application may not be straightforward, because they are based on advanced mathematical concepts and therefore some caution should be exerted before direct application such tools from the chemometric field.
2.3.3.1. Parallel factor analysis model
The PARAllel FACtor analysis (PARAFAC) model has its origins in psychometrics sciences, but it has long been exploited in chemometrics and related areas to
deal with the increased complexity of the multi-way data sets. This is an iterative and powerful method that has already been proven useful in deconvolution and quantification in two-dimensional-chromatography (Bruckner et al., 1998, 2000a, Fraga et al., 2000b, 2001, 2005, Hoggard and Synovec, 2007, 2008, Latha et al., 2011, Porter et al., 2006, 1999a, Prazen et al., 1999b, Sinha et al., 2003, 2004a, 2004b, van Mispelaar et al., 2003, Xie et al., 2003). The PARAFAC model applied to a three-way data array can be described as follows: E z y x R
n n N n n 1 (2)where R, in two-dimensional chromatography, is the instrumental response matrix, xn is the second dimension chromatographic profile of each factor (N), yn is the first dimension chromatographic profile of each factor (N), zn is the detector response for each factor (N), and E is the error matrix with same size of R matrix (Hoggard and Synovec, 2007). Fig. II-8 shown a schematic representation of a PARAFAC model for 3 factors (N=3).
Fig. II-8. Schematic representation of a PARAFAC model with 3 components peak (visualization inspired by Bro (1997)).
Several algorithms have been described for finding the parameters xn, yn, and zn and consequently fitting the PARAFAC model. These algorithms can be classified in three groups (Tomasi and Bro, 2006): a) non-iterative eigenvalue-based methods, such as Generalised Rank Annihilation method (GRAM) and the Direct Trilinear Decomposition method (DTLD); b) alternating algorithms, such as the Alternating Least Squares (PARAFAC-ALS) and the Self Weighted Alternating Trilinear Decomposition (SWATLD); and c) derivative-based methods. The GRAM and PARAFAC-ALS algorithms have been the most extensively discussed and applied to two-dimensional chromatography.