Master Thesis:
The Commercial Viability of the Arctic Shipping Routes
Author:
Alexander Nilsen
Hand-in date: 11th of June 2013
Supervisor: Susana Frazao Pinheiro
Programme:
Master of Science in Business Administration Major in General Management
Thesis seminar:
Entrepreneurship and Development
This thesis is a part of the MSc programme at Universidade Católica Portuguesa. The school takes no responsibility for the methods used, results found and conclusions drawn.
Acknowledgment
Writing this thesis has been an interesting and educational experience. The process has provided me with a better and sound analytical skills, as well as insight in an industry I personally find very interesting. This dissertation could however not have been completed without the support and advice from people whom have helped me along the way.
I would like to express my upmost gratitude towards my supervisor Susana Frazao Pinheiro for here guides, availability and constructive feedback through the process of writing this thesis.
Secondly I would share my appreciation of the support and encouragement from the people whom I have been living with and studied with.
Last but not least, I want to express my gratitude to my family for their constant support and for having confidence in my abilities throughout my studies.
Abstract
(Keyword: Global warming, sea ice, Arctic Shipping routes, Cost comparison, Time Comparison, Commercial viability.)
It is commonly held that the Arctic Ocean and Arctic routes, presents an alternative to the traditional shipping routes through the Suez- and Panama- Channel, which is less time and cost consuming. This thesis strives to uncover weather or not this is the case by assessing the environmental developments, the distance and time characteristics of each defined route, as well as the individual costs associated with each route. The results from the alternative Arctic routes are then compared with the traditional routes. The results show that, though the distance between most of the ports of departure and arrival are in most cases shorter or considerable shorter, in extent presenting a decrease in the voyage time. Current sea ice conditions on the other hand only allow for the commercial shipping operations along the Northern Sea Route (NSR). The cost comparison proves that the NSR only become profitable with the implementation of the know industry practise of slow speed. The result is important as it has the prospective possibility to alter the commercial shipping traffic around the world, connecting major parts of the world with a less costly and faster way of trade.
In Portuguese
(Palavra-chave: Aquecimento global, gelo marinho, rotas de navegação do Ártico, comparação de custos, comparação de tempos, viabilidade comercial)
É geralmente aceite que o Oceano Ártico e as rotas do Ártico, constituem uma alternativa às rotas de navegação tradicionais, através dos canais do Suez e do Panamá, por serem menos despendiosas em termos de tempo e custos. Esta tese procura aferir da vericidade dessa suposição através da avaliação dos progressos ambientais, da distância e do tempo de cada uma das rotas definidas, assim como dos custos individuais associados com cada rota.
Os resultados das rotas alternativas do Ártico são depois comparados com os custos das rotas tradicionais mostrando que no primeiro caso a distância entre os portos de partida e chegada é na maioria dos casos inferior ou consideravelmente inferior, resultando numa diminuição no tempo de viagem. Por outro lado, as condições actuais do gelo marítimo permitem apenas as operações ao longo da rota do Mar do Norte (NSR).
A comparação de custos mostra que a NSR apenas se tornará lucrativa com a implementação da conhecida prática de navegação em slow speed. Os resultados são importantes uma vez que ilustram o potencial que estas rotas tem de alterar o tráfego comercial marítimo mundial, ligando a maior parte dos portos de forma mais barata e rápida.
Acronyms
TSR: Transpolar Sea Route NSR: Northern Sea Route NWP: North West Passage NEP: North East Passage H&M: Hull and Machinery P&I: Protection and indemnity DWT: Dead Weight Tonnage SCNT: Suez Channel Net Tonnage NRT: Net Registered Tonnage TUE: Twenty-foot equivalent Unit MYI: Multi Year Ice
Table of Contents
Acknowledgment ... ii
Abstract ... iii
Acronyms ... iv
Table of Tables ... vii
Table of Figures ... viii
Introduction ... 1
Research Question ... 2
Literature Review ... 3
The Arctic Geography... 3
Global Warming ... 5
Sea Ice ... 5
Sea Ice projections ... 7
Shipping routes ... 8
The Historical and traditional shipping routes ... 9
The Northwest Passage ... 9
The Northern Sea Route ... 10
The Northeast Passage... 10
The Transpolar Sea Route ... 10
Prospective Shipping Activity along the Arctic Shipping Routes ... 11
World shipping activity and projected demand ... 12
Slow speed ... 13
Arctic Restrictions and Vessel Requirement ... 14
Regional Issues ... 15
Data collection ... 16
Distance... 16
Vessel data ... 18
Voyage time ... 21
Fuel and Lubrication costs ... 23
Insurance ... 23
Maintenance ... 25
Depreciation ... 26
Transit cost ... 26
Calculation ... 29
Results ... 30
Cost Analysis without additional cost and risk of an arctic transit ... 30
Cost Analysis with additional cost and risk of an arctic transit ... 32
Slow speed ... 33
Analysis and Discussion... 37
Prospective... 39 Research Limitations ... 41 Future research ... 41 Conclusion ... 42 Bibliography ... 44 Annex – Excel ... 48
Appendix 1 - Expected Oil & Gas Reserves ... 53
Appendix 2 – Google Earth plotting ... 54
Table of Tables
Table 1 ... 17 Table 2 ... 20 Table 3. ... 22 Table 4 ... 25 Table 5 ... 27 Table 6 ... 28 Table 7 ... 30 Table 8 ... 31 Table 9 ... 32 Tabel 10 ... 33 Table 11 ... 34 Table 12 ... 34 Table 13 ... 35 Table 14 ... 36 Table 15 ... 38Table of Figures
Figure 1: Earth Rotation Axis ... 3
Figure 2: The Arctic Ocean ... 4
Figure 3: Sea Ice extent (a) September (b) March... 6
Figurer 4: Season Max/Min ice cover: ... 6
Figurer 4: Season Max/Min ice cover: ... 7
Figure 5: Arctic Routes: ... 8
Figure 6: World Shipping Activity ... 9
Figure 7: GCM Simulation. ... 11
Figure 8: Shipping flow ... 13
Showing the international shipping flow and trade values. ... 13
Figure 9: Displaying the Rotterdam: Tokyo routes. ... 18
Global warming has been a hot topic within international politics, press and research the last few decades, where one of the issues receiving much attention has been the Arctic and Antarctic regions, which as of a consequence of the global warming is experiencing major changes to. The surveying and data collection of the Arctic and northern areas started in 1979. Where a clear and consistent data is confirming that snow and ice during summer and winter in the northern hemisphere is disappearing with an exponential rate.
Nations and explorers have for decades been drawn towards the inhospitable regions of the north, as it was to start with though that the north could connect the continents of the earth in trade, where the first exploration set out to explore the Arctic region in 325 B.C. With technology and building techniques that came with the industrial revolution and late advances in the 1800’s, the northern areas where rigorously explored until the beginning of the 1900’s. The Soviet Union was the first once to commercially use the Arctic Ocean as a method of transporting goods and supplies, though only possible during the summer months.
With time, the arctic has become a more attractive area, and the prospects of opening the Arctic Ocean for commercial shipping have never been more present. The question remains is whether it is profitable in comparison to the traditional routes.
Research Question
Are the climate changes in the Arctic Ocean presenting alternative commercially viable shipping routes in comparison to the historically traditional shipping routes?
Literature Review
The Arctic Geography
The Arctic is the region surrounding the North Pole, geographically regarded as the region above the Arctic Circle at 66°(degrees)33”(minuets) North, though definitions such as treeline and permafrost may also be used. Throughout this paper the Arctic will be defined as the area within the Arctic Circle.
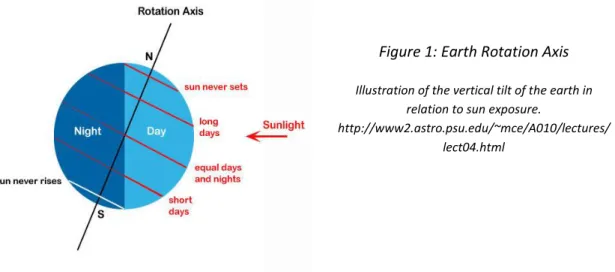
This region is exposed to harsh climate conditions. Because of the rotational tilt and gravitational pull of the sun, the region has months at end with continues sun light exposure during the summer, as well as months with complete darkness during the winter. This only occurs above Arctic Circle or below the Antarctic Circle, therefor making the geographical definition of 66°33” an important one (National snow and ice data center), indicated in Figure 1 by the first, upper red circle.
The Arctic is a vast geographical region, dominated by the Arctic Ocean, surrounded by continental landmasses in the outskirts. Even though the area is dominated by the Arctic Ocean, most of the ocean’s surface is solidified in ice, and the extent of the ice cover varies in accordance with the season. In addition the earth’s horizontal tilt and rotation leaving the region les exposed to the amount of sunlight/sunrays present along the equator (Figure 1). Because of the tilt the energy from the sun needs to pass through a larger mass of atmosphere, where it becomes relatively thicker, than along the equator. This effect of all these factors leaves the Arctic colder than most other places on Earth (Arctic Uoguelph, 2013). These lower temperatures allows for the creation snow and ice (Arctic Monitoring and Assessment Programme (AMAP), 2011).
The Arctic Ocean has four geographical points of entry via the sea. First is the entrance through the Norwegian Sea between Norway and Iceland, in close proximity to the second entrance through the
Figure 1: Earth Rotation Axis Illustration of the vertical tilt of the earth in
relation to sun exposure.
http://www2.astro.psu.edu/~mce/A010/lectures/ lect04.html
Greenland Sea between Greenland and Iceland. Third is the David Strait between Canada and Greenland, and forth is the Baring Strait between USA (Alaska) and Russia, the only entrance from the pacific into the Arctic Ocean (Figure 2).
The Arctic region is one of the few areas on earth that is not dominated by humans. Still the area is subject to major climate alterations due to human activity. Never the less, the region is off massive political interest, where the main stakeholders are USA, Canada, Russia, Sweden, Finland, Iceland, Norway and Denmark as the governing stat of Greenland (Arctic Monitoring and Assessment Programme (AMAP), 2011, p. 80). The interest is largely founded in the oil and gas reserves expected to be found in the area (Appendix 1). All these stakeholders are represented in the Arctic Council, which is an intergovernmental forum facilitating communications between the members, aligned efforts such as research, legislation and regulation of activity of the area (Arctic Council, 1996).
During the winter season, the lack of sunlight sets the stage for the formation of snow and ice, which occur at freezing point of 0 degree Celsius (Helmenstine) and -1.9 in salt water (noaa.gov, 2013), in combination with traditionally cold summers, the conditions have led to the development of multiyear ice (MYI).
The features of snow, ice and frozen surroundings in and around the North and South Pole have led to the development of the science field of Cryosphere. The understanding of these elements, are Figure 2: The Arctic Ocean
This is a map over the Arctic region, containing regional name definitions.
(http://portal.inter-map.com/#mapID=49&groupID=30 4&z=1.2&up=864687.1&left=68874 1.7, 2013)
crucial in the projections and preservation of the region (Arctic Monitoring and Assessment Programme (AMAP), 2011, p. 18).
Because of global warming “the extent and duration of snow (and Ice) cover have decreased throughout the Arctic” (Arctic Monitoring and Assessment Programme (AMAP), 2011, p. 19). Areas that traditionally would have been frozen or covered with snow and ice are now diminishing, and the areas that once were covered have significantly decreased over the past 30 years, hitting a record in the summer of 2012. The record of 2012 is about 1/3 of the average measured between 1979 and 2000 (Arctic Monitoring and Assessment Programme (AMAP), 2011, p. 34).
Global Warming
With the Industrial revolution, the human impact on the earth and climate increased substantially, and it sparked the beginning of what would become known as climate changes and global warming (nasa.gov, 2013). The amount of carbon dioxide has increased with 38% and methane with 148% since the beginning of the industrial revolution (nasa.gov, 2013). The “average surface temperature rose 0.6 to 0.9 degrees Celsius between 1906 and 2005” (nasa.gov, 2013). The definition of global warming is wildly agreed upon as “the recent and on-going global average increase in temperature near the earth’s surface” (United States Environmental Protection Agency, 2013), which in extent have led to the diminishing of ice and snow at poles (Arctic Monitoring and Assessment Programme (AMAP), 2011).
Sea Ice
As the earth revolves around the sun, the tilt creates seasonal effects on the earth, resulting in a dynamic expansion and contraction of the sea ice (Arctic Monitoring and Assessment Programme (AMAP), 2011, p. 38). Large quantities of ice and snow appear white or with no colour at all, and because of this feature it absorb very little for the energy from the sun (National Snow & Ice Data Center, (c) 2013), the melting is attributed to external factors such as air, land and the sea itself (National Snow & Ice Data Center, (c) 2013). The summer temperatures in vast parts of the arctic are around the average temperature of 10 degrees Celsius, known as the isotherm (Arctic Monitoring and Assessment Programme (AMAP), 2011, p. 28).
The summer temperatures are a big factor to the diminishing of the frozen areas in the Arctic. The sea ice cover has seen dramatic changes during the last 30 years. The sea ice cover is today under continuous surveillance, where the March sets the peak and September sets the low of the sea ice cover. The results from March and September are then measured up against the data from 1979, and previous years to determine the latest developments.
From the data illustrations above, where we can observe that the sea ice cover in the arctic is diminishing. The largest changes can be observed during September. The melting of the sea ice itself accelerate the further melting of the sea ice, as cold water sinks, making space for warmer water that continues the melting process. This effect is a part of the ocean currents that is believed to have great importance in the world’s environmental and ecosystem. The warmer water that replaces the melt-water from the sea ice arrives through ocean currents via currents from the Atlantic and Pacific (National Snow & Ice Data Center, (c) 2013). Though the sea ice is diminishing on an overall yearly average, the ice cover around the Baring straight and sea seems to be expanding, though this is only during the winter, Figure 3.
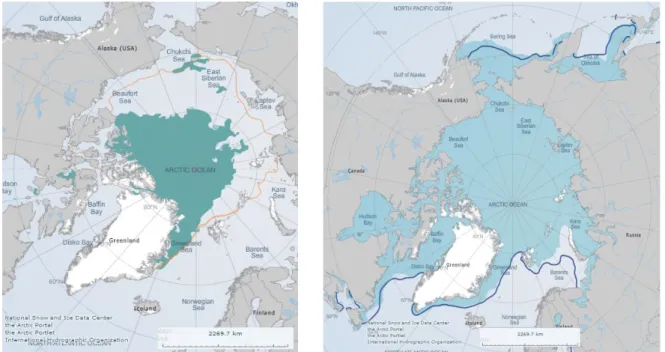
Data on the sea ice cover only dates back to 1979. From the data all but one trend is clear, and it is that the sea ice is diminishing both during the summer and winter (D.Perovich, 2012) (Heygster, 2011). The melting of the sea ice can be observed in figure 3 (a) (b), where most of the recent years of data have beaten the previous minimum records. The data extracted form figure 3(b) shows that the sea ice coverage in the Arctic is contracting on average 2.6% during the winters and 13% during the summers per decade (D.Perovich, 2012).
Sea ice is found in four forms, young ice witch is less than 30 cm in thickness, first year ice that can attain a thickness of 1 meter. Multiyear/old ice is two or several layers of seasonal ice, compacting and strengthening the ice. The fourth is icebergs that originate form glaciers, which are very dense
Figure 3: Sea Ice extent (a) September (b) March
The left picture shows the sea ice extend during September 2012, compared to the average, orange line, from 1979-2000. The right picture shows the sea ice cover during March 2012, versus the average 1979-2000 blue line average http://portal.inter-map.com/#mapID=49&groupID=304&z=1.0&up=1900409.8&left=2001105.4
and strong (Arctic Marine Shipping Assessment 2009 Report, 2009, p. 26). The deterioration of the sea ice also diminishes the creation of new multi-year ice (MYI), because it has to become sufficiently cold for the ice and snow to get a new foothold. The sea ice cover in September is the MYI for the upcoming winter season, where we can observe from figure 3(b), there is further more positive correlation between the amount of MYI and the sea ice cover during the winter (Arctic Monitoring and Assessment Programme (AMAP), 2011, p. 40).
Sea Ice projections
Because of these statistical observations, multiple attempts have been made to simulate the future sea ice cover. The simulations are known as Global climate models (GCM), and there extent of the simulations very, though the results of a diminishing sea ice cover as shown in Figure 4 is consistent. The models are based on collected data, which then are subjected to exogenous factors such as if there is an increase or decrease in the emission of greenhouse gasses. All the modulations reviewed for this thesis are all based on a semi positive, implying a reduction in the emission of greenhouse gases (Arctic Council, 2009) (Arctic Monitoring and Assessment Programme (AMAP), 2011) (Smith & Stephenson, 2012). The GCM’s are conducted in a semi positive future scenario, as a radical change is unlikely to occur, which is the only scenario in which a positive outcome would be possible. Secondly an increase in greenhouse gases would only increase the melting of the sea ice cover (Arctic Council, 2009) (Arctic Monitoring and Assessment Programme (AMAP), 2011).
One of these is the GCM conducted by the researchers attached to the Arctic Council in the release of The Arctic Climate Impact Assessment, which “simulate a continuous decline in sea ice coverage
Figurer 4: Season Max/Min ice cover:
Shows the maximum and minimum of March and September’s sea ice cover within the Arctic Circle. The anomaly value for each year is the difference in %in ice extent relative to the mean value for the period 1979-2000. The un-dotted red and black line is the squared linear regression, indicating ice melting March -2.6% and September -13% per decade. Source: (D.Perovich, 2012)
Figure 5: Arctic Routes:
This figure shows North eastern Route / Northern sea route indicated in red off the cost of Russia, and the North western route indicated in green off the cost of Canada and USA (Alaska). The figure also indicated the prospectus sea way directly over the north pole, indicated in blue.
http://www.nato-pa.int/Default.asp?SHORTCUT=2082
through the 21st century” (Climte Change 2007). Furthermore, one of these simulations from the Arctic Climate Impact Assessment indicated an ice-free during some summers during the 21st century. There are however no GCM that having been able to produce a reasonable projection of ice free winters in the arctic (Arctic Marine Shipping Assessment 2009 Report, 2009, p. 29) (Smith & Stephenson, 2012) (Shipping across the Arctic Ocean, 2010).
Shipping routes
Global warming and in extension the diminishing of the arctic sea ice cover sett the possibility for arctic shipping. Arctic shipping is the term used for shipping from to or through Arctic areas. As of 2009, most of the activity within the arctic is to and from locations, moving resources out of the area (Arctic Marine Shipping Assessment 2009 Report, 2009, p. 76), where very few voyages went through the arctic in 2009. Never the less, the activity and prospect of shipping through the Arctic becomes more and more attractive for shipping companies as the sea ice cover continues to diminish (Smith & Stephenson, 2012).
The first recorded expedition of the Arctic Ocean occurred in 325 B.C. As the understanding of the earth grew, it became apparent that the arctic could connect continents if the waters of the Arctic Ocean proved to be navigable. The NSR was the first route to be used, by Russian merchants during the 1700 century. The NWP was first successfully navigated in the 1900’s by the explorer Roald Amundsen (Arctic Council, 2009, p. 46). In the 1900 trade between Europe and America with Asia
was well underway, and the Arctic proved to have the potential of becoming a short cut, decreasing the distance between Rotterdam and Tokyo by 1/3 (Eide, Eide, & Endresen, 2010) (Arctic Monitoring and Assessment Programme (AMAP), 2011).
Today, only the NSR is transited by commercial shipping vessels. The NWP is only partially sailed, where resources are moved out of the nearby region, while the TSR has not seen any commercial activity (Arctic Council, 2009).
The Historical and traditional shipping routes
The formation of what today is referred to as traditional shipping routes, the Suez and Panama Channel routes where resent event and opened 1869 and 1914. (Grigentin & Verny, 2009). Because of the world’s geography, the centration of humans around the equator, most shipping activity can be located around the equator. With the diminishing of the sea cover of the Arctic Ocean, the traditional sea routes, illustrated below is under threat.
The Northwest Passage
The Northwest Passage (NWP) is the name of multiple routes going from the Atlantic Ocean to the Pacific via the Arctic Ocean along the Northern Coast line off North America. The route was fist successfully navigated but Roald Amundsen in the 1900’s. Successfully navigating the NWP was believed to open the sea way, and present an alternative route to moving goods within the USA and between the west coast of USA and Asia, bypassing the Panama Channel (Arctic Monitoring and Assessment Programme (AMAP), 2011, p. 24).
Figure 6: World Shipping Activity
Adapted by Hengl, T. (2010). Shipping Routes. Retrieved (04.30.12) from, Arctic yearbook: http://www.arcticyearbook.com/book/ p.307 Based on Harper, B.S., Walbridge, S., Selkoe, K. A., Kappel, C.V., Michelo, F., D’Agrosa, C, Watson, R. (2008), A global map of human impact on marine ecosystems. Science. (319)5865, 948-952. doi: 10.1126/science.1149345
The NWP showed itself to be extremely difficult to navigate because of this approximately 36 000 islands. Only two of the routes the multiple routes defined as the NWP are classified as deep waters, allowing for certain sizable ships (max 15 m) to navigate the region. Because of the islands, the average temperature is lower than at sea, increasing the formation of ice, making the rote extremely difficult to navigate, and it is expected to be the last arctic route to be ice free (Heygster, 2011) (Smith & Stephenson, 2012) (Arctic Council, 2009, p. 112).
The Northern Sea Route
The Northern Sea Route (NSR) is defined in “Russian Federation Law as a set of marine routes form Kara Gate in the west until the Baring Strait in the east” (Arctic Council, 2009, p. 27). This passage also includes multiple routes in between islands, but fare less then what is found along the NWP. The NSR just as the NWP have areas with shallow waters, putting some restrictions on which routes commercial ships can take. The NSR is the passage that is the most explored and mapped, due to Russia and the Soviet Union’s extensive usage of the sea route during the Second World War and the Cold War (Ragne, 2008, p. 3).
The Northeast Passage
The Northeast Passage (NEP) is a route that starts off the coast of Norway, and goes to the Baring strait. This route has a high degree of correlation with the NSR. The major difference between the two routes is that the NEP covers the howl voyage through the Arctic Ocean, while the NSR only covers the voyage within the Russian territorial waters (Arctic Marine Shipping Assessment 2009 Report, 2009, p. 38). At some regards the NEP and NSR is regarded as the same routes especially after the opening of commercial shipping of the NSR in 1991 (Humpert, 2011).
The Transpolar Sea Route
With the continuing and future diminishing of the sea ice in the Arctic, the prospectus of opening the a shipping route in close proximity of the North Pole, or even over the North Pole is present during the late summer months (Smith & Stephenson, 2012) (Eide, Eide, & Endresen, 2010, p. 14). This sea route is referred to as the Transpolar Sea route (TSR). This route will be defined as the Pole Route (PR) throughout the paper. This route has deep waters allowing for adjustments of shipping routes in relations to the sea ice coverage (Arctic Marine Shipping Assessment 2009 Report, 2009). This route has only been partially sailed, by a Russian Icebreaker that after reaching the North Pole returned along the same route I arrived along.
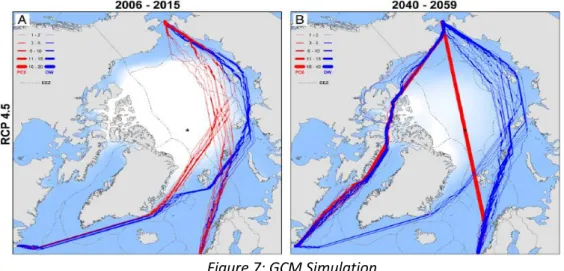
Figure 7: GCM Simulation.
This is the illustrated simulations of the shipping activity along the sea routes corresponding to the CGM’s, in this particular case the CGM RCP 4.5. (Smith & Stephenson, 2012)
Prospective Shipping Activity along the Arctic Shipping Routes
One of the most comprehensive research papers on the development of the Arctic Shipping routes was conducted by Laurence C. Smith and Scott R. Stephenson (2013) in their paper on “New Trans-Arctic shipping routes navigable by mid-century”. This paper incorporated 7 GCM’s in a simulation of two vessel types, and the possibility of them sailing through the Arctic Ocean during the month of September. The two vessel types are classified as 1: A traditional Open-Water ships (OW) and 2: A moderately ice-strengthened ships (PCS).
In order to verify the results from the simulations, they first conducted a simulations based the data projection from 1979 to 2005 and 2006 to 2015. The results from these simulations projected the usage of the NSR as the primary sea way for OW’s and PCS’s to sail through the arctic at the current state climate environment, in line with the actual shipping activity of the Arctic, setting a historical base line, where the primary difference between the 1979 to 2005 and 2006 to 2015 projections was that several trips a year would have the opportunity of sailing further north. They then ran the projected data for 2040 to 2059, yielding results that showed significant changes in the traffic patterns. The results opened for traffic of OW and PCS vessels along NEP, NWP and TSR, secondly PCS would be able to transit the PR. The results showed that traffic now would take place along all three sea routes during the summer month of September. It is important to underline that these simulations only look at projected CGM data and traveling distance optimisation, and not cost savings.
Other studies did however reviled the NSR is currently navigable at 15 knots from June to December (Niini, 2008), and 11 knot from January to May (Jensen, 2006). In relation to the continuous deterioration of the sea ice over, it has also been found that the average speed through the Arctic
will increase gradually (Bertoia, 2003) (Stroeve, 2007). A position paper by Det Norsk Veritas (DNV), a respected risk assessment company, determined that within 2030 the NSR would be open 100 days a year, and 120 days within 2050 (Eide, Eide, & Endresen, 2010)(Appendix 3).
World shipping activity and projected demand
The interest of the arctic passages have been present with mariners for hundreds of years, and for hundreds of years been viewed as a short-cut connecting the East-Coast of the United States and Europe with a connection to Asia (Arctic Council, 2009, pp. 41,42,46,47).
Shipping is a result of global trade, with the need of transporting products and goods from distant locations. One of the most famous notions about modern globalisation was noted by Lord John Maynard Keynes: “The inhabitant of London could order by telephone, sipping his morning tea in bed the various products of the whole earth, in such quantity as he might see fit, and reasonably expect them early delivery upon his doorstep” (1914). That was a hundred years ago, when commercial flights was just about to take off, implying that just about all global trade was transported by boats. Over a hundred years much have not changed, as it is assumed that about 90% of all global trade is carried by sea (Interntional Maritime Organization, 2012, p. 7).
The worlds shipping fleet have more than doubled since 1980, even with the contraction that took place during 2009 as a result of the financial crises August 2008 (Interntional Maritime Organization, 2012, p. 9). The world trade fleet is in a very close correlation with the amount of global trade (UN International Merchandise Trade Statistics, 2011). Global trade is vulnerable to economic downturns, following the finance crises, and is quite noticeable in the trade statistics of the UN international Merchandise Trade Statistics. Likewise the global demand for Oil is increasing just about doubled since 1970 (U.S. Energy Information Administration (EIA), 2009). The demand for raw materials, such as iron ore, is following the same statistical trends as merchandise and oil (Eurostat, 2012).
The demand for shipping is almost in a perfect correlation of the demand for goods and oil & gas, as we often find natural-, capital- and labour resources located at different locations of its demand, effectively creating a flow of trade (Ronald). The following image is an illustration of the world’s shipping routes based upon shipping data collected by the international maritime organisation a United Nations Agency, Figure 8. The image also contains prospective rotes where the NEP and NWP/NSR is represented, indicating an increase in the Arctic shipping activity also in the view of the International Maritime Organisation. Thirdly the image shows the development in world imports.
Not only will the shipping activity increase as a result of the opening of the arctic routes, but the
known oil and gas reserves in represents 12% of the world’s know resources (Arctic Portal) ( Appendix 1). As with Arctic shipping, oil and gas extraction in ice covered waters are is as difficult if
not even more challenging, due to all year activity that is needed, if the operations are not of subsea extraction. The current oil and gas activity are only found in the arctic periphery, indicating that the challenges posed by the sea ice are restricting the activities, but as the sea ice is diminishing the distance to the North Pole will only decrease. Just as with the access to oil & gas, the defrosting of the Arctic also increases the accessibility to the minerals within the earth, which have been unreachable for humans for thousands of years (Arctic Monitoring and Assessment Programme (AMAP), 2011) (Arctic Council, 2009).
Slow speed
In the aftermath of the financial crises of 2008, the shipping sector was heavily impacted, at some shipping companies experienced that they were sailing with losses. As a result some companies implemented “slow speed”1. Slow speed involves the vessels sailing slower than the traditional cruising speed. The world’s largest shipping company, Maersk, implemented slow speed, reducing the cruising speed with 20%. The result of lowering the speed by 20%, was that the fuel consumption reduced by approximately 40%1.
1
(http://www.guardian.co.uk/environment/2010/jul/25/slow-ships-cut-greenhouse-emissions, 2010) Figure 8: Shipping flow Showing the international shipping flow and trade values. http://www.imo.org/Knowled geCentre/ShipsAndShippingFa ctsAndFigures/TheRoleandImp ortanceofInternationalShippin g/PublishingImages/shipping- trade%20routes%20UNEP-Arendal.jpg
Arctic Restrictions and Vessel Requirement
Even though there are potential for commercial activities in and through the Arctic Ocean, there are still restrictions put in place by the governing states to ensure the safety of the vessels, crew and environment. The Arctic and its ecosystem are highly vulnerable, and a sinking or a ship run a shore would have major implications. This is one of the reasons why Canada and Russia, the two largest stakeholders in the arctic, have agreed upon common requirements for commercial shipping within the arctic under the UNCLOS Article 234, as well enforced by national legislation (Arctic Marine Shipping Assessment 2009 Report, 2009, p. 70).
The legislation says that vessels operating in the Arctic Ocean needs to hold an arctic classification, either Arc4 or 1-A, where there is little that sets the Arc4 and 1-A apart (Arctic Logistics Information Office, 2012). The vessel class states what level of ice resistant/braking capabilities the vessels have, in the sense of their ability to sail in ice waters. Additionally there are also requirements to the propeller, crew, supplies and communications equipment (Center for high north logistics, 2012, p. 19) (International Association of Classification Societies LTD., 2011).
In addition Canada and Russia have implemented specific regulations regarding shipping operations in their domestic waters. The Canadian government has a zero pollution law, restricting most vessels to date from operating in the waters (Transport Canada, 2013). Russia on their side has a requirement stating that any vessel that operates in the national arctic waters, have to file a request to an administrative office. The request establishes a line of communications between the vessel and the FSUE Atomflot, the operating unite of the NSR. Secondly the request also reveals the vessels arctic abilities, i.e. if it covered the requirements for sailing along any part of the NSR. From the request the FSUE Atomflot can determine the level of support the vessel will need on its voyage, and in extent the fee it needs to pay2,as it is in direct correlation with the level of support the vessel will need (Arctic logistic information office, 2011) (Arctic Marine Shipping Assessment 2009 Report, 2009, p. 71) (Federal Rate Service, 2011). The Fees are given in maximum terms per ton of cargo, stating the maximum fee which the FSUE Atomflot is able to claim while assisting vessels along the NSR. The request of sailing through the NSR needs to be field between 15 days and 4 months before the planned voyage (Arctic Logistics Information Office, 2012).
2
The accessibility of the Arctic has historically been restricted in comparison to the traditional routes through the Panama- and Suez- Channel. In extent this means that to facilitate for future shipping activity the infrastructure shush as radio, GPS, mapping and emergency services needs to be established and strengthened (Arctic Marine Shipping Assessment 2009 Report, 2009).
Regional Issues
The Arctic region as well as the Arctic Ocean has a range of state stakeholders, due to their sovereignty and historical presents in the region there are few disputes, none of which are lightly to destabilise the region. The most present dispute is regarding Canada’s sovereignty of the Arctic waters north of Canada including the NEP, a route that also is of major interest to the United States of America. The sovereignty gives Canada the regulatory mandate over the waters, something that the United States would like to have a say in. It is however most unlikely that this disagreement will restrict vessels under the American flag to sail in the area (Hayward & Canadian Press, 2010).
Data collection
In order to create a basis for the comparison of data of potential time and cost saving, we need to obtain the relevant data from several sources. We need data regarding the distance between the ports, as well as vessel data, which in extent will determine the time which a vessel uses on a voyage, its fuel consumption as well as to determine the vessels transit cost through the arctic routes, Panama- and Suez Channel.
Furthermore, the following individual cost factors will be collected for this comparison basis:
Fuel cost
Lubrication oil
Hull and Machinery (H&M) and Protection and Indemnity (P&I) Insurance
Crew cost
Maintenance
Depreciation
Transit cost
In order to obtain the different cost, a common factor in all of them is the distance and time usage along each route, which also needs to be found.
Distance
One of the most apparent factors that need to be obtained is the distance between the ports. The data regarding the distance will help determine the time per voyage and the cost of each factor per voyage. Because of the close proximity of the NSR and NEP, the routes will be combined in the terms of this thesis, and referred to as NSR.
Distance data for the respective routes was collected using Google Earth, where the routes was plotted using the software’s plotting tool, which in the end measured the distances of the plotted route. The results were reported in kilometres (Km) and Nautical Miles (Nm) (Appendix 2).
In order to have a comparable set of data, Rotterdam was selected as the port representing Europe, while the New York was selected to represent the East Coast of the United States of America. The Asian ports, situated from the South East until the East coast was selected because of their economic significance, and size3.
Singapore Hong Kong Shanghai Tokyo 3
From: To: Km: Nm: From: To: Km: Nm:
Rotterdam Singapore 15536 8389 New York Singapore 23285 12572
Rotterdam Hong Kong 18160 9806 New York Hong Kong 18205 9829
Rotterdam Shanghai 19484 10521 New York Shanghai 19806 10688
Rotterdam Tokyo 20908 11289 New York Tokyo 21042 11361
NWP Diff.: NWP Diff.:
Rotterdam Singapore 19259 10399 124% New York Singapore 18467 9971 79%
Rotterdam Hong Kong 16886 9118 93% New York Hong Kong 16094 8690 88%
Rotterdam Shanghai 15515 8378 80% New York Shanghai 14723 7950 74%
Rotterdam Tokyo 14120 7624 68% New York Tokyo 13328 7196 63%
NSR NSR
Rotterdam Singapore 18697 10095 120% New York Singapore 22735 12276 98%
Rotterdam Hong Kong 16324 8814 90% New York Hong Kong 20362 10995 112%
Rotterdam Shanghai 14953 8074 77% New York Shanghai 18991 10255 96%
Rotterdam Tokyo 13558 7320 65% New York Tokyo 17596 9501 84%
TSR TSR
Rotterdam Singapore 17056 9209 110% New York Singapore 20223 10919 87%
Rotterdam Hong Kong 14683 7928 90% New York Hong Kong 17850 9638 98%
Rotterdam Shanghai 13312 7188 89% New York Shanghai 16479 8898 83%
Rotterdam Tokyo 11917 6434 88% New York Tokyo 15084 8144 72%
Table 1
The distance from departing Port to arrival port along the different routes. The
difference along the Arctic routes and the traditional routes, are identified by the percentage comparison titled Diff.:
Table 1 shows the length on any route, given in kilometres and nautical miles. An initial comparison is made between the traditional and new alternative arctic route, given in the following percentage (diff.) after the route i.e. the NSR Rotterdam – Tokyo is only 65% ~ (2/3) of the distance in comparison to Rotterdam – Tokyo via the Suez Channel.
Vessel data
Data regarding the vessels are important in determining the voyage time, costs, such as fuel and lubrication oil consumption, insurance, crew cost, maintenance, depreciation and the cost of transit through areas where such fees are imposed. Obtaining complete data regarding the vessels proved difficult to gather. It has therefor been necessary to make assumptions based on data from one or two of the other vessels.
As we know from the literature review, any ship traveling through the arctic needs to hold an arctic classification, deeming the vessel fit for traveling through ice covered water. With the purpose of revelling whether or not there is a cost savings potential, three vessels has been chosen for this study:
Figure 9: Displaying the Rotterdam: Tokyo routes.
The traditional route via the Suez Channel is displayed in red, while the NSR route is displayed in yellow. Red route: 20908 Km / 11289 Nm Yellow route13558 Km / 7320 Nm. Source: Google Earth Distance: Excel ‘Distance’
OOCL Montreal 4,5
o Cargo / Container vessel
Marinor 6,7
o Tanker / Liquid natural gas
Nordic Odyssey 8,9 o Dry bulk
Collecting data about the vessels are important for several reasons. First of all we obtain data about the vessels dimensions, which are important in the aspect of calculating the cost of the vessel through areas where there are a fee attached to the channel transits. The dimension of the vessel also tells us how much it is capable of carrying in cargo. This information is then used to calculate the value of which the vessel is carrying and therefor needs to be insured. We also obtain the value of the ship used to estimate the cost of insuring the vessels itself. Finally it is also needed to obtain data concerning the vessels capabilities, such as it sailing speed, its range and fuel consumption in order to look at the cost of sailing different routes.
Some data proved itself difficult to obtain, resulting on the theses needing to relay on some assumptions supported by other backup data. First of thesis data was the displacement weight of the Nordic Odyssy. The displacement weight is the weight of the water which is displaced when a vessel is loaded. Because of similar vessel dimensions between the Nordic Odyssy and Marinor, the displacement weight of the Marinor was applied as also being the displacement weight of Nordic Odyssy.
Data such as oil capacity, fuel consumption, range and required crew members were also difficult to obtain. Marinor, being similar to Nordic odyssey became a valid asset as a source of value assumption for this thesis. Partial data from the individual vessels have therefor been used as a baseline, from which the equivalent values for the two other vessels have been based upon.
One of these important pieces of information is the fuel consumption of the vessels. The vessels run on a particular fuel, produced for ship engines, in order to calculate the fuel cost of the vessels we to establish how much they use. Fuel consumption was however only available about Marinor, which
4 (http://www.oocl.com/eng/ourservices/vessels/iceclass4402/Pages/ooclmontreal.aspx) - 22.04.2013 5 (http://www.marinetraffic.com/ais/shipdetails.aspx?mmsi=477321000) - 22.04.2013 6 ( http://www.marinvest.se/ship.asp/id/300510/lid/33139)- 22.04.2013 7 (http://www.brodosplit.hr/Portals/44/Tankers4.pdf) - 23.04.2013 8 (http://www.nordicbulkcarriers.com/services/ice-bulk-carriers) - 24.04.2013 9 (http://www.marinetraffic.com/ais/shipdetails.aspx?mmsi=373428000) – 23.04.2013
uses 49.2 tons of fuel a day10. Because of Marinor and Nordic Odyssy’s similar dimensions, it is fair to assume that this vessel have the same fuel consumption.
With regards to OOCL Montreal, the vessel is longer than the two other vessels, however the dead weight tonnage (DWT), the maximum overall weight of the vessel is less than the two others. It is assumed that this allows for the vessel to have a smaller engine then an equally sized tanker. OOCL Montreal is therefore having the same fuel consumption of 49.2 tons of fuel each day. Since it is assumed that all the vessels have the same fuel consumption, and in extent the same engine, it is also assumed that the engines have the same need and capacity for oil lubrication.
The same issue appears when trying to attain the cursing range of the vessels, where the data was only available for Marinor, and adapted to the two other vessels, being 15000 Nm, well within the distances needed to sail (Table 1). The three vessels average speed is within the expected average speed of vessels sailing in the arctic (Eide, Eide, & Endresen, 2010) (Smith & Stephenson, 2012). Fourth is the collection of the crew data, something that varies accordingly to the complexity of the vessels and the legislated security requirements. Yet again the numbers are only available for one of the vessels, OOCL Montreal, reporting 20 crew members, with additional rooms for Panama crew members. For the purpose of this thesis it will be assumed that all vessels carry a crew of 20 sailors. The channel crew is not accounted for as they are compensated through the transit fee.
Data vessel name OOCL Montreal Marinor Nordic Odyssey Vessels of research Container / Cargo LNG / Tanker Dry Bulk
DWT 47,828 74,999 74,000
SCNT 23,914 37,500 37,000
NRT 22,426 37,500 40,000
Registered Transit Load N.A. 60,992 66,000
Average speed ( knots) 12 12 13
Length M 294 227 225 Length F 1M=3.2808 f 965 745 738 Beam (M) 30 31 32 Beam (f) 98 102 105 Draft (M) 10 14 13 Draft (F) 31 44 43 Oil Capacity 2,294 2,294 2,294
Summer load Displacment 69,065 61,280 61,280
TUE's/ M^3 /ton 4,402 85,950 40,000
Daily fuel consumprion t/day 49 49 49
Crusing range (NM) 15,000 15,000 15,000
Crew 20 20 20
10
Table 2 The Vessel Data
Voyage time
In order to calculate the voyage time of the vessels, we divide the nautical miles (Nm) of the route on the average knots of the vessels, which has a 1 to 1 ratio (1 knot/h = 1 Nm). The result of this action leaves us with the amount of hours that is needed for the voyage, by yet again dividing the amount of hours by 24 we obtain the days needed per route. Because of the mirror image value of knots and nautical miles, the correlation between the distance (Table 1) and voyage (Table 3) time is perfect. Furthermore, it is presumed that an alternative route needs to be less time consuming.
Days: Days:
From: To: Nm: From: To: Nm:
Rotterdam Singapor 15536 New York Singapore 23285
Rotterdam Hong Kong 18160 New York Hong Kong 18205
Rotterdam Shanghai 19484 New York Shanghai 19806
Rotterdam Tokyo 20908 New York Tokyo 21042
NWP Dif.% Dif.% Dif.% NWP Dif.% Dif.% Dif.%
Rotterdam Singapore 19259 65.24 12.6 65.78 12.7 63.69 12.3 New York Singapore 18467 62.56 -16.3 63.07 -16.5 61.07 -15.9
Rotterdam Hong Kong 16886 57.20 -4.3 57.67 -4.4 55.84 -4.2 New York Hong Kong 16094 54.52 -7.2 54.97 -7.2 53.22 -7.0
Rotterdam Shanghai 15515 52.56 -13.4 52.99 -13.6 51.31 -13.1 New York Shanghai 14723 49.87 -17.2 50.28 -17.4 48.69 -16.8
Rotterdam Tokyo 14120 47.83 -23.0 48.22 -23.2 46.69 -22.4 New York Tokyo 13328 45.15 -26.1 45.52 -26.3 44.07 -25.5 0.0
NSR 0.0 NSR
Rotterdam Singapore 18697 63.34 10.7 63.86 10.8 61.83 10.5 New York Singapore 22735 77.02 -1.9 77.65 -1.9 75.18 -1.8
Rotterdam Hong Kong 16324 55.30 -6.2 55.75 -6.3 53.98 -6.1 New York Hong Kong 20362 68.98 7.3 69.54 7.4 67.33 7.1 Rotterdam Shanghai 14953 50.65 -15.3 51.07 -15.5 49.45 -15.0 New York Shanghai 18991 64.33 -2.8 64.86 -2.8 62.80 -2.7
Rotterdam Tokyo 13558 45.93 -24.9 46.30 -25.1 44.83 -24.3 New York Tokyo 17596 59.61 -11.7 60.10 -11.8 58.19 -11.4 0.0
TSR 0.0 TSR
Rotterdam Singapore 17056 57.78 5.1 58.25 5.2 56.40 5.0 New York Singapore 20223 68.51 -10.4 69.07 -10.5 66.88 -10.1
Rotterdam Hong Kong 14683 49.74 -11.8 50.15 -11.9 48.55 -11.5 New York Hong Kong 17850 60.47 -1.2 60.96 -1.2 59.03 -1.2
Rotterdam Shanghai 13312 45.09 -20.9 45.46 -21.1 44.02 -20.4 New York Shanghai 16479 55.82 -11.3 56.28 -11.4 54.49 -11.0
Rotterdam Tokyo 11917 40.37 -30.5 40.70 -30.7 39.41 -29.7 New York Tokyo 15084 51.10 -20.2 51.52 -20.3 49.88 -19.7
Nordic Odyssey: Marinor:
OOCL Monteral: OOCL Monteral: Marinor: Nordic Odyssey:
69.58 65.50 60.20 77.00 79.53 62.18 67.64 71.86 78.88 70.83 66.00 61.52 52.63 69.14 64.43 60.05 51.38 53.06 62.02 66.54 71.41 71.28 67.09 61.67
Table 3.The table indicated the voyage time from departing to the arriving port in days. Values indicated in red are routes that take longer time, while green values indicates les time. Following the voyage time in days, the time is indicated in percentage.
Fuel and Lubrication costs
To develop the fuel and oil lubrication costs associated with the voyages we multiply their fuel consumption with the travel time. We know form the data collected about the vessels that, they uses 49.2 tons a day, as well as the voyage time as also been calculating. By multiplying the two factors we yield the exact amount of fuel the vessel consumes on one trip. What remains is to multiply the consumption with the cost of the fuel. Fuel for marine vessels is specially produced for its engines, and is sold as a specific type of fuel with its individual quot. The fuel cost was attained from Bloomberg11. The fuel price data is historical five year data, with monthly closing prices, creating a sufficient data set to develop an average price, 541.16 USD per ton.
To derive the fuel costs it was just necessary to multiply the consumption per day 49.2 ton with the amount of days attributed to each route, and then multiplies it with the average price of fuel. Consult the excel calculation concerning fuel cost for specific data on fuel cost with regard to the vessel and route (Annex Excel).
In order to minimise the wear of the engines the engine oil needs to be changed periodically, and is therefore a cost that needs to be taken into consideration. The cost of the oil was extracted from Chevron’s price list12, at an approximated average price of 7 USD per litre. The price depending upon speed of engine and temperatures, but in order to create a compatible foundation of a cost comparison, this value at 7 USD per litre, and set to be changed after completed voyage. To attain the cost, the oil capacity of the machinery is there for multiplied with the price, 7 USD. And as its assumed that all vessels have the same engine and i.e. oil capacity, the cost of oil / lubrication is 17 474 USD per trip.
Insurance
There are two types of insurance that needs to be calculated, the Hull & Machinery- (H&M) and Protection and indemnity- (P&I) insurance13. Calculation of any insurance is based on the fair value of the object itself, and the risk associated in transportation of the object. In extent to calculate the insurance cost of the H&M and P&I insurance, it is necessary to obtain the value of the H&M and P&I. For this thesis it is assumed that that any insurance cost is estimated as a percentage of the fair value. 11 (http://www.bloomberg.com/quote/BUNKSI38:IND) – 16.04.2013 12 (http://www.ctgl.net/Chevron_PriceScheduleUpdate15Jan2008_PRINT[2].pdf, 2008) – 19.04.2013 13 (http://www.skuld.com/upload/News%20and%20Publications/Publications/Introduction%20to%20PandI/Intro duction%20to%20PandI.pdf, 2009) - 15.05.2013
To calculate the H&M insurance we need the value of the vessel. However the value of the three vessels has not been available for the public, as two of the three vessels are owned by private companies. From the literature review we know that an arctic vessel needs to answer to specifications, and is presumably more expensive to build. In order to value the vessels, the value of “Golden Future14” sold in 2010 for 72 million USD, was set as a valuation base. Because of the additional specification of an arctic classified vessel, the value of the vessels in this thesis is assumed to be almost 65% higher, valued at 110 million USD. The insurance is set to 0.5% - 550 000 USD a year. For the reason of achieving the insurance cost of every trip, the value is divided on the time required on one voyage.
Valuing the P&I, is a bit more difficult than the H&M value estimation. The P&I insurance cover the shipping company’s third party liabilities. Valuation of P&I is difficult to assess, as it is any third party of the ship owner that can claim this. For example an oil tanker can go ashore, and intoxicate an entire coastline. The chance of this happening is low, but real. For this reason it will be assumed that the P&I insurance will be set in accordance with the value of the cargo. OOCL Montreal is a container ship, and we assume that its cargo is worth 100 million USD. Marinor the tanker is able to ship 85950 cubic of oil, and Nordic Odyssy can carry 40 000 tons of iron ore. We value the cargo based on Bloomberg quotas. The quota of oil is given in barrels where one barrel holds 0.15988 cubic meters. Secondly it is assumed that the oil price is 100 USD, a target price of the (OPEC, 2013)15. From this Marinor is carrying 53 759 069 USD worth of oil. Nordic Odyssy is able to carry 40 000 tons of iron ore. The price quota of the iron ore is based on a one year monthly ending price from Bloomberg, averaging at 124.1 USD per ton. Nordic Odyssy is carrying 4 965 000 worth of cargo. For the calculation of the P&I insurance it is assumed that the yearly cost is 5% of the cargo carried.
Crew cost
The crew cost may in reality fluctuate according to which flag it sails with. For the purpose of this thesis an assumed price level will be set as equal of all vessels. The price is passed upon the info attained from the shipping company Odfjell, a Norwegian company16. Their average monthly pay check ranges from 1000 USD until 5000 USD for an experienced crew member. As a registered cost for the shipping company this is a higher cost regarding elements such as pension, health and injury insurance and training. This paper will therefor assume that the average yearly cost of 50 000. With 14 (http://www.goldenocean.no/?view=hugin_feed&menu=21&feed=http://cws.huginonline.com/G/135378/PR/ 201009/1447173.xml, 2010) 11:30 15.05.2013 15 (http://www.reuters.com/article/2012/06/14/us-markets-oil-idUSBRE83H17O20120614, 2012) 27.04.2013 16
(http://www.bt.no/nyheter/lokalt/God-lonn_-men-toffe-forhold-for-filippinske-sjofolk-a crew of 20, this (http://www.bt.no/nyheter/lokalt/God-lonn_-men-toffe-forhold-for-filippinske-sjofolk-amounts to 1 million (http://www.bt.no/nyheter/lokalt/God-lonn_-men-toffe-forhold-for-filippinske-sjofolk-a ye(http://www.bt.no/nyheter/lokalt/God-lonn_-men-toffe-forhold-for-filippinske-sjofolk-ar. In order to find the crew cost per trip, we then multiply 1 million USD with the amount of days used on one particular trip divided on 365 days. Thought the data is from 2006, it is not adjust it for inflation, as the ratio would remain the same in both cases.
Maintenance
The ships need new paint to protect the vessels from corrosion as well as repairs, overhauls and upgrades. Along the traditional channel routes, this maintenance cost is presumably lower than the once found along the Arctic routes due to the harsh climate conditions documented in the literature review. There is however difficulties of assessing how much a vessel need in maintenance, as it is a cost that will vary.
For this reason it is assumed that the maintenance cost is 2.5% of the vessels value, i.e. 2 750 000 a year per vessel, and only taking into account the difference between arctic and conventional routes, and not each route specifically. This is divided on the voyage time of one year, to find the cost of one trip. Furthermore, because of the high uncertainty of the maintenance costs as well as realizing the potential harm of sea ice, two calculations have been conducted. First the maintenance cost for the traditional routes and new potential arctic routes without additional costs attributed was calculated. Secondly the maintenance cost of the arctic routes was adjusted for more potential wear by a 30% increase costs.
Maintanance cost
Rotterdam - Asia No Assosiated Risk Risk assosiated *30%
Vessels Annual cost Suez avrage Arctic Arctic
Total $ 2,750,000 $ 253,929 $ 212,810 $ 276,653
New York - Asia No Assosiated Risk Risk assosiated *30%
Vessels Annual cost Panama average Arctic Arctic
All vessels $ 2,750,000 $ 282,143 $ 242,118 $ 314,754 Table 4
Depreciation
Depreciation of the vessels is also a cost that needs to be registered by the vessel owners. The life span of a shipping container vessel is expected to be about 26 years17. This depreciation principle is attributed to the other type of vessels as well. However it is not that common for a vessel to be in the same ownership through its life span. Because of this the value of the ship is depreciated over 10 years, with no recorded residual value. We have already stated that the value of the vessels are set at 110 million USD, and in a straight lined depreciation scenario the ship owner sustains a 1.1 million loss every year, which then can be divided on the prospected time needed for on trip to get the specific depreciation cost.
Transit cost
The transit cost, in relation to the sea routes is an important factor in calculating the potential cost savings of a transit through the arctic. The transit costs available to the public through information websites attached to the operating companies or authorities.
The transit cost attained from the Suez channel, was attained through a transit agency, providing an input calculator.
The type of vessel is selected in the first section, which determines the price class of the vessel. The SCNT stands for Suez Chanel Net Tonnage, and is attained every time the vessel transits the channel. The GRT is the gross tonnage of the vessel, which stands for the vessel total registered volume. For the entire vessel the both the draft and beam was les the respective 14.33 m and 66.45 m, and therefore not put in. For the purpose of attaining the transit cost through the Suez channel it is
17
assumed that the vessel uses ballast as is heading southbound, even though the cost becomes the cost indifferent of which way the vessel sails.
OOCL Montreal 209 506.71
Marinor 149 770.03
Nordic Odyssey 157 297.28
The cost of transiting through the panama channel is issued through a pricing table18. The table distinguishes between the type of vessels, and then ascribing a different cost depending upon the tonnage it is carrying from the first 10 000 tones second 10 000 tones and then for the rest.
Attaining the transit fee of the panama channel as not as easy as just putting data about the vessels into a calculator. The authorities of the Panama Canal uses a price table of any vessel, stating the price of its load by attributing one cost for the 1st 10 000 tone, a second cost for the 2nd 10 000, and finally a third cost the for the remaining tons of cargo. In addition the vessel also needs to compensate for the vessels displacement, which is the weight of water which the vessel displaces.
Tolls per PC/UMS Ton 1st: 10K 2nd: 10 K Rest Fee displacment ton 1st 2nd rest Total General Cargo 5.10 4.99 4.91 3.49 51,000 49,900 11,912 353,849 Dry bulk 5.06 4.00 3.93 3.49 50,600 40,000 78,600 383,067 Tankers 4.92 4.84 4.75 3.49 49,200 48,400 83,123 311,596
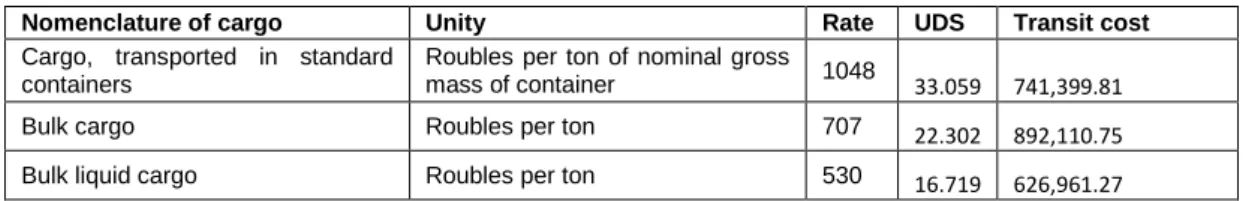
On the alternative arctic routes, the TSR and NWP have no administrative fee associated with transiting through the waters. In contrast, the NSR has a transit fee, based on the weight of cargo of which the vessel carries. There are some features with the NSR transit fee that sets it apart from the once present along the Suez- and Panama Channel. First there is no fee associated with the displacement of the vessel. Secondly the fee goes to the efforts done by the Atomflot in assuring a safe voyage along the route.
The commercial traffic along the NSR is managed by the Atomflot, which in extent is operated by the Russian federation. The Atomflot have been given a directive which determined the maximum fee it is able to attain from transiting vessels. The fee is established based on the cargo the vessel carries, and the overall weight of the goods.
18
(http://www.pancanal.com/eng/op/tolls.html , 2012)- 29.04.2013 Table 5
Nomenclature of cargo Unity Rate UDS Transit cost
Cargo, transported in standard containers
Roubles per ton of nominal gross
mass of container 1048 33.059 741,399.81
Bulk cargo Roubles per ton 707 22.302 892,110.75
Bulk liquid cargo Roubles per ton 530 16.719 626,961.27
The rates are given in Rubbles, and at an exchange rate RUB/USD 31,70 19, we attain the USD rate. The rate is the maximum fee which is allowed to be taken by the Atomflot (Federal Rate Service, 2011), and all calculations will be based on maximum fee in order to see the worst case scenario. Secondly there is no obtainable data off the transit fees of previous voyages, which could have been used as a benchmark for an average fee20.
19 (http://www.bloomberg.com/quote/USDRUB:CUR/chart)
- 20.04.2013
20
(http://www.arctic-lio.com/nsr_tariffsystem, 2011) -
Table 6. Presents the transit cost per ton of cargo through the NSR at maximum fee. The actual fee is equal or lower to the total cost in relation to the level of support the vessel needs on its voyage.
Calculation
The cost calculation consists of adding the individual costs together, and comparing the total costs of the alternative arctic routes with the traditional Suez- and Panama- channels routes to the designated Asian ports. In order to do this comparison in a clear and understandable way, the first cost comparison is made without any additional cost risk or associated costs of arctic transits. This will allowed for a more rigours cost analysis in the discussion and analysis.
Secondly, these values will be changed to include the additional cost and cost risk of sailing in the arctic. From this we will obtain a more realistic view of the potential cost savings along the Arctic routes. Third these calculations will be subjected to know cost saving practises within the shipping industry.
The total cost is put together by the following factors:
Fuel cost
Lubrication oil cost
Insurance cost
Crew cost
Maintenance cost
Results
Cost Analysis without additional cost and risk of an arctic transit
In the first cost comparison, we look at the costs along the traditional Suez Channel connection Rotterdam and Asian ports versus the Arctic shipping routes, but with no additional costs or cost of associated risk of sailing in ice covered waters.
The first section of the calculations (Table 7) show the total cost the three vessels sailing the traditional route from Rotterdam – Asian ports through the Suez Channel. This cost, establishes the base line of which the alternative routes will be compared, eventually determining whether or not it will be less cost intensive.
The following three sections are the costs of sailing, present the total cost of any vessel along the distinguished routes. The costs of the alternative routes are measured against the traditional route, where a higher cost level is indicated with red, and lower costs are indicated in green.
Total
From: To: OOCL Monteral: Marinor: Nordic Odyssey: Rotterdam Singapore 2,363,279 2,313,295 2,294,179
Rotterdam Hong Kong 2,504,236 2,455,407 2,431,780
Rotterdam Shanghai 2,575,361 2,527,116 2,501,212
Rotterdam Tokyo 2,651,759 2,604,139 2,575,790
NWP
Rotterdam Singapore 2,301,671 2,310,859 2,274,981 Rotterdam Hong Kong 2,174,243 2,182,386 2,150,587 Rotterdam Shanghai 2,100,630 2,108,171 2,078,727 Rotterdam Tokyo 2,025,626 2,032,551 2,005,508 NSR
Rotterdam Singapore 3,009,868 2,901,669 3,131,549
Rotterdam Hong Kong 2,882,439 2,773,196 3,007,154
Rotterdam Shanghai 2,808,827 2,698,981 2,935,295
Rotterdam Tokyo 2,733,822 2,623,361 2,862,076
TSR
Rotterdam Singapore 2,171,698 2,179,821 2,148,103 Rotterdam Hong Kong 2,044,270 2,051,348 2,023,708 Rotterdam Shanghai 1,970,658 1,977,133 1,951,849 Rotterdam Tokyo 1,895,653 1,901,513 1,878,630
Table 7
The voyage between Rotterdam – Asian ports with no additional cost or additional associated cost of risk of sailing through the Arctic. As we can see from the calculations the NWP and TSR yields a cost saving result.
The second comparison is from New York to Asian ports, where the traditional route through the Panama Channel is used as the baseline of comparison verses the transit through the Arctic. The total costs are presented in the same way as Table 8, red indicating a higher cost level, while green indicated a total cost saving. The first section presents the cost of sailing along the traditional Panama route from New York to the Asian ports. The following parts present the total cost from sailing each of the arctic routes.
Total
From: To: OOCL Monteral: Marinor: Nordic Odyssey: New York Singapore 2956948 2931657 2959635
New York Hong Kong 2684085 2656559 2693270
New York Shanghai 2769535 2742709 2776685
New York Tokyo 2836482 2810205 2842038
NWP
New York Singapore 2276457 2291070 2256750 New York Hong Kong 2149028 2162597 2132356 New York Shanghai 2075416 2088381 2060496 New York Tokyo 2000411 2012762 1987277 NEP
New York Singapore 3271563 3173817 3396526
New York Hong Kong 3144134 3045344 3272132
New York Shanghai 3070522 2971128 3200272
New York Tokyo 2995517 2895509 3127053
TSR
New York Singapore 2381950 2397428 2359732 New York Hong Kong 2254522 2268955 2235337 New York Shanghai 2180909 2194739 2163478 New York Tokyo 2105905 2119120 2090259
Calculating the total cost in both the traditional routes from Rotterdam and New York through the Suez and Panama Channel, versus the alternative Arctic routes, we are also able to measure the respective ratio cost of the individual costs in relation to the total cost.
From this ratio calculation we are able to distinguish the largest individual costs. Two cost factors emerges as the most significant, the fuel and depreciation costs. The fuel cost represents between 23%- 57% of the total costs, fluctuating in relation to the voyage distance. The cost of depreciation ranges from 29% - 47%, also fluctuating according to the length of the voyage, as the straight line depreciation is divided on the calculated voyage time.
The individual costs ratios of the depreciation and fuel are the highest along the routes where there are no transit costs, being the NWP and TSR. Along the Suez-, Panama – Channel and NSR there are transit cost present, which is paid to the respective administrator authorities. This cost varies
Table 8
The voyage between New York – Asian ports with no additional cost or additional associated cost of risk of sailing through the Arctic. As we can see from the results, only the NWP and the TSR presents a cost saving in comparison to the traditional Panama route.