The impact of sales promotions on Facebook
performance, for high and low equity brands
Ana Sofia Mendonça de Freitas
Student number: 152117102Dissertation submitted in partial fulfillment of requirements for the MSc in Strategic Marketing, at the Católica Lisbon School of Business & Economics
ADVISOR: Cláudia Simão January 2019
2 ABSTRACT
Title of the dissertation: “The impact of sales promotions on Facebook performance, for high and low equity brands.”
Author: Ana Sofia Mendonça de Freitas
Sales promotions are becoming increasingly important with the growth of competition. Brands are gradually adopting these strategies on social media networks to reach people quickly and without costs. For that reason, it is indispensable to understand the impact of those strategies in the consumer perspective, and also the factors that lead brands to succeed in the digital field. This dissertation presents the impact of over-promotion on Facebook – regarding the frequency posting time and the reduction amount – and the content type that contributes for a better performance of high and low equity brands by using descriptive quantitative research and analyzing secondary data of Facebook posts.
The results show that promotional posts do not perform better than non-promotional and that over-promoting (concerning post frequency and reduction amount) affects the performance of both high and low equity brands on social media. Indeed, sales promotion only beneficiate low equity brands when they do not over-promote.
To conclude, the findings of this research complement the academic literature by reinforcing the importance of having a suitable social media marketing strategy (SMMS) focused on the customers' expectations by optimizing their Facebook posts, and achieving better performance levels.
3 SUMÁRIO
Com o aumento da competição e com o objetivo de alcançar os consumidores de forma mais rápida e menos dispendiosa, as marcas estão cada vez mais a incluir promoções nas suas estratégias de marketing, nas redes sociais. Por esta razão, é indispensável compreender os fatores de sucesso do mundo digital e as consequências das promoções na imagem das marcas. Esta dissertação apresenta o impacto das promoções excessivas feitas no Facebook – com o foco na frequência das publicações e no montante das reduções – e o tipo de conteúdo que mais contribui para uma melhor performance das marcas de baixo e alto capital, através de uma pesquisa quantitativa descritiva e análise de dados secundários.
Os resultados evidenciaram que não existe um diferencial entre a performance das publicações promocionais com as não promocionais, e que a promoção excessiva (relativamente à frequência das publicações como ao montante reduzido) afeta a performance tanto das marcas de alto como de baixo capital. De facto, quando não são excessivas, as promoções beneficiam apenas as marcas de baixo capital.
Por fim, os resultados desta dissertação complementam a literatura académica, reforçando a necessidade de as marcas criarem estratégias de marketing focadas nas expetativas dos consumidores. As marcas podem ainda usar os conhecimentos deste estudo para otimizar as suas publicações no Facebook, de forma a obterem melhores níveis de performance.
Palavras-chave: Promoções, Capital das marcas, Social Media Networks, Performance, Consumidores.
4 ACKNOWLEDGEMENTS
First of all, I would like to thank my mother Augusta, who provided me the opportunity for taking my Master Degree at Católica Lisbon School of Business and Economics. Second, I would like to express my sincere gratitude to my thesis advisor, Dr. Cláudia Simão, who accompanied and guided me in all the dissertation execution. From the research methods to suggestions to improve my writing and ideas to the revisions and feedback, her help was crucial during the past four months. Last, but not least, I would like to thank my brother, that has no Marketing background, for reading my dissertation and helping me clarify my findings.
5 TABLE OF CONTENTS
CHAPTER 1: Introduction...11
1.1. Background and problem statement...11
1.2. Aims and scope...12
1.3. Research methods...13
1.4. Relevance...13
1.5. Dissertation outline...14
CHAPTER 2: Literature Overview………...15
2.1. Brand Equity.…...15
2.2. Price Promotions.………...17
2.3. The effect of promotions on the consumers’ perceptions...19
2.4. Sales promotions on social media networks...19
2.5. User-Generated Content on Facebook...20
2.6. Conclusions and hypotheses formulation………...21
CHAPTER 3: Methodology...23
3.1. Research approach...23
3.2. Research methods...23
3.2.1. The selection of brands for the study…...23
3.2.2. Data collection...24 3.2.3. Independent variables………...25 3.2.3.1. Promotional frequency…………..………...……...25 3.2.3.2. Brand equity...25 3.2.3.3. Promotional discount...26 3.2.3.4. Promotional type…...26 3.2.4. Dependent variable...26
3.2.4.1. Performance on social media networks...26
3.2.5. Control variables…………...28
3.2.5.1. Market structure...29
3.2.5.2. Perishability of the product...30
3.2.5.3. Industry………...………...30
CHAPTER 4: Results….…...31
4.1. Data analysis………...31
6 4.3. The effect of brand equity and promotional discount on social media
performance……….……….33
4.4. Promotional vs. non-promotional performance of posts.………35
4.5. The effect of brand equity and promotional type on social media performance…..36
4.6. Additional analysis……….37
4.6.1 The effect of equity on social media performance – Point-Biserial Correlation……….………...37
CHAPTER 5: Conclusions and Limitations...38
5.1. Main conclusions…………..…………...……...……...38
5.2. Managerial Implications….……...39
5.3. Limitations and future research………...40
7 TABLE OF FIGURES
Figure 1 – Comparison of the Facebook performances according to posting frequency (high vs. low), as function of brand equity (high vs. low)………...………...…34 Figure 2 – Comparison of the Facebook performances according to promotional discount (high vs. low), as function of brand equity (high vs. low)………..…..35 Figure 3 – Comparison of the Facebook performances of promotional and non-promotional posts. Performance standardized values from 0 (low performances) to 1 (high performances)………...…...…………..37
8 TABLE OF TABLES
Table 1 – Evaluator variables of brand equity from a consumer-based perspective...23
Table 2 – Financial values of brands……….…...……...24
Table 3 – Classification of the independent variables……….….…...25
Table 4 – Key performance indicators (KPI) of brands on Facebook.………....26
Table 5 – High equity brands performance of promotional posts………...……....27
Table 6 – Low equity brands performance of promotional posts.………..………...28
Table 7 – Classification of the control variables…….……….….…...29
Table 8 – Classification of the market structure of brands in the Portuguese market ….……....29
Table 9 – Classification of the industry of brands…...………...………….….…...30
9 TABLE OF ANNEXES
Annex 1 – UGC collected from Facebook promotional posts of high equity brands….…...…..48
Annex 2 – UGC collected from Facebook promotional posts of low equity brands….……...49
Annex 3 – Non-promotional posts performance of high equity brands.….………...50
Annex 4 – Non-promotional posts performance of low equity brands………..….….….…...51
Annex 5 – Descriptive statistics of the dependent variable………..…..…52
Annex 6 – Factorial ANOVA results and effect sizes………..………..…...….52
Annex 7 – Factorial ANCOVA results and effect sizes of equity and frequency……...…..53
Annex 8 – Controlling the effect of the control variables on the frequency and equity……...53
Annex 9 – Factorial ANCOVA results and effect sizes of equity and promotional discount……….54
Annex 10 – Controlling the effect of the control variables on the equity and promotional discount……….54
Annex 11 – Factorial ANCOVA results and effect sizes of equity and promotional type…...……….55
Annex 12 – Controlling the effect of the control variables on the promotional type and equity……….55
10 GLOSSARY
SMN – Social Media Networks are platforms where connections are shared both for people or business entities. The websites allow people to create a profile, connect with others, and also enable companies to manage and promote their business in the online field.
UGC – User-Generated Content is any digital content not created by the owner of the websites but created and shared by their users, such as videos, photos, mentions, likes, reactions, status updates, infographics, online ads, and blogs.
SMMS – Social Media Marketing Strategies are plans created by managers required to achieve the success point. In those plans, they define the goals, the target, the content calendar, and the actions to be.
WTP – Willingness to Pay is the maximum amount that a consumer is prompt to pay for one unit of a product or a service.
OPS – Online Pricing Strategies are policies adopted by brands in their social websites where they define the value of their products or services taking into account the production costs. Those strategies include sales promotions and aims to increase sales and attract customers. CLT – Central Limit Theorem defends that given random and independent samples of N observations, the distribution of its means becomes normal as the number of samples increases, regardless of the shape of the population distribution.
11 CHAPTER 1 – INTRODUCTION
1.1. Background and problem statement
Consumers are increasingly exposed to the content created by brands that influence their purchase behavior. In theory, past research presented relevant insights about the effect of offline sales promotions in the consumption (Ailawadi and Neslin, 1998), and their consequences concerning brand image and status.
Brands have been allocating a higher percentage of their budget for advertising on social media networks (SMN), due to the increasing number of e-commerce sales predicted until 2021 (Statista, 2018). The effect of increasing social media initiatives regarding sales promotions affects the performance of brands (Rapp, Beitelspacher, Grewal and Hughes, 2013). Some brands beneficiate of adopting those strategies by accelerating the brand/product choice process, whereas others are negatively affected (Alvarez and Casielles, 2005). Since brands are unable to adopt the same online and offline strategies, even if they perform well in the offline field, sometimes their online strategy regarding sales promotions denigrate their image.
Statistics showed more than one half of the UK population waits for promotions to buy a product (Statista, 2015). Specifically, many of these individuals do not buy some of the products for the full price. Although people seem to enjoy getting products on promotion, seventy-one percent of the population considers that retailers exaggerate the level of discount offered (Statista, 2015), pointing out that often, brand managers struggle to create social media marketing strategies (SMMS). This contradiction creates the need to understand the reactions that consumers have towards sales promotions, and their consequences in the brands’ image, particularly in the online competing community.
Consumers use price cue as a signal to indicate product quality and prestige (Lichtenstein, Ridgway, and Netemeyer, 1993), and they also tend to neglect the base value of products due to the lack of information about percentages discounts (Chen et al., 2011). Exploring these issues that represent a potential threat for the performance is relevant to the academic knowledge since they can be the reason for brands to underperform online.
Concerning the existing threats, the heterogeneity among consumers leads them to look for brands capable of satisfying their self-definition and identification needs (Bhattacharya & Sen, 2003). Undoubtedly, consumers’ identification with brands depends on their equity, i.e., people’s perceptions about the value, characteristics, corporate image, reputation, beliefs, and reactions of brands (Bhattacharya & Sen, 2003). These factors, added to the consumer-company relationship, define the level of similarity and attractiveness (key drivers of identification) that motivate consumer behaviors and sales (Vogel, Evanschitzky, and Ramaseshan, 2008).
12 Several studies explored consumer behavior regarding promotions, yet, little or no attention has been paid to explicitly study the impact of those strategies on social media performance. To best of my knowledge, there is a gap in the literature about consumers’ reactions to brands (high vs. low) offering both high and low promotions in SMN, especially on Facebook. The absence of advice on online promotions may lead brands to lose users since they miss the identification feeling with the brand. For these reasons, this research project aims also to share insights about the consequences of over-promoting on Facebook performance, adding translational value to the online brand communities.
Facebook has been the subject of study since this network become trendy among the worldwide population (Statista, 2018), and also because the number of its active users that is predicted to increase until 2021 (Statista, 2018). Given that, I believe that it is still worthwhile to explore this tool as a proxy or brand-costumer relationship. Specifically, Facebook metrics are particularly important to explore consumer reactions to sales promotions and their consequences on the performance of the brands.
1.2. Aims and scope
This dissertation aims to study the impact of the following variables: brand equity, promotional frequency, promotional discount, and promotional type on the Facebook performance of brands.
Previous analyses evidenced some factors that lead consumers to engage with promotional strategies, but still, their online impact has not been yet studied, or whether the threats to their performances in the online field. Therefore, this research aims to provide useful insights to managers to optimize their online strategies in SMN, especially on Facebook.
It is relevant to refer that this study does not analyze the effect of price changes on purchase intention because the number of likes cannot directly measure it, or either being the favorite brand does not guarantee that (Parsons, 2013).
Additionally, this study will not be about the consequences of general advertising strategies on Facebook, but specifically about the impact that price change has on brands’ performance. Price strongly relates with equity, being responsible for the consumer evaluation of a brand – high price is associated high equity, and frequent price promotions are related to low equity brands (Yoo, Donthu, and Lee, 2000). Therefore, this study focused on the existent literature and on the analysis of the particular user-generated content (UGC) produced on Facebook.
With the purpose of achieving these insights, the dissertation targeted the following research questions:
13 1. Is there an impact of over-promoting products on the performance of brands on Facebook, as a function of brand equity?
2. Do sale promotions lead to better performance levels on Facebook, as a function of brand equity?
1.3. Research methods
To answering the aforementioned research questions, descriptive research approach was undertaken through a statistical analysis of secondary data from Facebook, exploring the underlying success factors of sales promotions for high and low equity brands.
Quantitative secondary data about Facebook brands, namely McDonald’s, IKEA, Lidl, Continente, Pingo Doce and FNAC were collected. Accordingly, ten promotional and ten non-promotional posts of each brand, corresponding to one hundred and twenty Facebook posts, were collected between 13th – 20th of October 2018, with the purpose of analyzing the influence
of sales promotions factors as a function of brands’ equity (high vs. low). Besides, the data analyzed derived from the Facebook posts enabled to get insights about the customers’ preferences regarding sales promotions.
Data collected to measure the consumers’ posts engagement were the UGC of posts as likes/reactions, comments, shares, and the number of page followers. Following, this index was used to measure and compare the brands’ performance on Facebook.
For statistically testing the hypotheses, data were analyzed through SPSS by performing ANOVAs and ANCOVAs tests. The dependent variable is the performance of brands on Facebook, while the brand equity, the promotional type, the promotional frequency, and the promotional discount compose the independent variables.
The variety of sales promotions included in the study focus on financial discounts (included coupons and quantity discounts like BOGO – buy one, get one free) and percentage discounts. The study did not consider other types of sales promotions.
After achieving some results about the consumers' evaluations of online sales promotions and the degree of the association between them and the brands’ equity, managerial implications, limitations, and suggestions for further investigation were presented.
1.4. Relevance
This research program taps onto online pricing strategies (OPS) for both high and low equity brands. Conclusions will be crucial to developing a more accurate and effective strategy aligned with consumer perceptions and expectations.
14 Improving this department will undoubtedly enhance the performance of brands on SMN. Besides, it generates translational meaning since brands can directly benefit from the insights of both positive and negative roles of online sales promotions.
Nevertheless, this dissertation will help managers to understand which type of content is preferred by consumers on Facebook and understand the best path to empower their OPS, generating more traffic to brands’ websites.
1.5. Dissertation outline
Chapter II presents a literature overview of brand equity and its importance for the success of brands. Following, I will approach the consumer perspective of price promotions and its general effects on the performance of brands. Moreover, a deeper understanding of sales promotions in social media and the UGC produced by them on Facebook posts define a measure for the performance. Based on this conceptual framework, I will end the Chapter II by presenting predictions and hypotheses.
Chapter III introduces the research methodology used to answer the research questions and Chapter IV describes the findings. The last one displays a section where the results are discussed and related to the research hypotheses.
Lastly, Chapter V summarizes the main findings and conclusions, highlighting some relevant managerial implications and some advice for improvement. This Chapter will be finished with a reflection on the limitations and suggestions for further research.
15 CHAPTER 2 – LITERATURE OVERVIEW AND CONCEPTUAL FRAMEWORK 2.1. Brand equity
Over the years, several authors have been studying the importance of brand equity and its repercussions on the identity of brands. It has already been advanced that the conception of brand equity is fundamental for brands to define their identity and to differentiate their products from the competitors, enabling consumers to feel connected with the organization and choosing them as their favorite brand (Keller, 1993; Yoo, Donthu, Lee., 2000). Furthermore, scholars seem to agree that brand equity has a set of assets and liabilities that generate value to a brand (Aaker, 1991), and it covers issues as consumers’ perceptions and its effects on purchases and brand revenues. However, this topic is still controversial in the research field since there is not a universal form of defining and measuring it.
The literature presents two approaches of measuring and defining brand equity: a) financial value (Mahajan, Rao, and Srivastava, 1994), or b) the consumer-mindset (Aaker, 1991; Kapferer, 1991; Keller, 1993). The first approach focuses on financial metrics, such as Net Present Value, Cash Flows, and future brand potential (Simon and Sullivan, 1993). In this perspective, high equity brands are the ones with high stock returns (Aaker and Jacobson, 1994). The second approach is an evaluation based on the customers’ perspective, which can recall the customer-based equity created by Keller (1993).
Brands aim to achieve the highest equity possible through marketing mix activities that affect the consumer perspective of the brand (Kapferer, 2014). For instance, if consumers react more (vs. less) to a promotion on social media, the more positive (vs. negative) is the customer-based brand equity (Keller, 1993). To evaluate the customer-customer-based brand equity, Keller presents a conceptual framework from the perspective of the consumers, stating that strong brands are well succeeding in four main domains: brand awareness, brand image, brand responses, and brand relationships. Moreover, a brand perceived by the consumers as strong creates an advantage for companies, since consumers are willing to pay a premium price for it (Starr and Rubinson, 1978).
Several other authors have defined brand equity as a variable depending on various influencers. Dodds, Monroe, and Grewal (1991) suggested that brand equity depended on the brand name, store name, and price. These three variables affect the responses of the customers to brands initiatives and an alternative to measuring them is through the willingness to buy the product and the consumers evaluation of perceived quality and value. Yoo, Donthu, and Lee (2000) supported Doods’ claims adding the positive correlation between price and quality. However, these authors also suggest that price does not have any influence on loyalty cues,
16 which can also be an evaluator of brand equity (Chaudhuri and Holbrook, 2001). Undeniably, evaluating the equity of a brand showed to be relevant once people are willing to pay premium prices for high equity brands (Gupta and Cooper, 1992) providing these a higher margin to operate.
Brand attitudes (Wilkie, 1986), perceived quality and perceived value (Agarwal and Rao, 1996) are also relevant drivers of a brand image, affecting consumer behaviors toward prices decreases, considering they use price as a proxy for the quality (Lichtenstein, Ridgway, and Netemeyer, 1993). This literature shows the relevance of price as a significant attribute of brand equity once customers organize their product category knowledge according to it and also according to the value of a brand (Blattberg and Wisniewski, 1989).
Notwithstanding, literature also showed the likelihood of purchase (Smith and Swinyard, 1983), the purchase intentions (Machleit, Madden, and Allen, 1990) and the willingness to pay (WTP) for premium (Yoo, Donthu, and Lee, 2000; Faircloth, Capella and Alford, 2001) as the primary indicators of brand equity.
When authors mention the willingness to pay for premium, price becomes an adequate evaluator attribute. It has a positive correlation with the likelihood of luxury (Kapferer et al., 2014), which means it has a vital role in the categorization of luxury (Godey, 2016). For example, in the USA, China, Germany, France, and Japan (Godey, 2013) being expensive is the first criteria to define if a brand is luxurious or not, influencing the price people are willing to pay for it.
One of the advanced explanations for consumers’ greater willingness to pay for products of high equity brands was the need for the exclusivity, hedonism, and authenticity that customers value (Yeoman and McMahon-Beattie, 2011). A second explanation is that consumers are getting more materialistic, increasing their appreciation for higher status when compared to other features (Eastman et al., 1997). In fact, many customers buy from luxury brands as a way to improve their social status both internally with an augmentation of self-respect and self-esteem, and externally for others’ approval (Truong et al., 2008), increasing the probability of choosing high instead of low equity brands.
To summarize, although these two co-existing perspectives (financial and customer-based) are the most used to evaluate brand equity, both of them refer to brands’ strength. The prices of products and their perceived value are responsible for the level of luxury, which is a strength measurement. Also, the stronger a brand is, the higher the consumers’ willingness to pay for their products.
17 2.2. Price promotions
Research on sales promotions has been promoted since the decade of the 1990s as a way to understand the impact of sales strategies on consumers’ purchase intentions. Indeed, an immediate price reduction affects the consumers’ choices (Alvarez and Casielles, 2005). For instance, lower prices might lead consumers to select different brands over their habitual one.
There are several reasons for brands to adopt OPS. It may be to get rid of old inventory for reducing costs, to promote their brand, to achieve more customers, to drive more traffic to the store/website or to respond to a competitor initiative. Literature explored price discrimination based on the willingness to pay (Rao, 1991) as an explanation for brands to adopt these strategies.
According to Hess and Gerstner (1992), there are two types of promotions, pull and push. The first refers to trade deals, which are temporary price reductions, while the second relates to coupons and rebates, for example. These authors studied the difference between sales promotions framing it in two different segments (customers willing to pay high prices and customers willing to pay low prices), to conclude which benefits the retailer, the manufacturer, and the consumers. The results showed both customers and retailers (vs. manufacturer) prefer sales promotions that are motivated by pull rather than push strategies. Subsequently, brands tend to adopt more frequently price reductions instead of coupon or rebates to attract consumers and grow sales.
Furthermore, the attractiveness of the promotions depends on the amount saved in the purchase which is related to the way of presenting the price reductions. Showing an advertisement in dollars (absolute term) is also more attractive for the expensive products, while percentage promotions (relative term) are preferred for the low-price products (Chen et al., 1998). For instance, a 10% reduction may not be enough to change customers’ purchase intentions in low-priced products as well as framing the offer in dollars amount needs to be above a threshold internally defined by consumers to change their intentions. Even if consumers perceive the price promotions as worthful, it might not be sufficient to modify consumers’ behavior (Alvarez and Casielles, 2005). Additionally, in Chen’s studies (1998), offering coupons change the perceptions and purchase intentions of the customers. Perhaps consumers might perceive coupon as more exclusive, having a positive impact on the brand image (Kapferer et al., 2014).
Moreover, the frequency of adopting OPS also impacts the perceptions of the consumers. Frequent price promotions made by low equity brands are typically short-term duration, such as special sales, coupons, cents-off deals, rebates, and refunds. In a short-term perspective, lowering the price increases the value of products (Dodds, Monroe, and Grewal,
18 1991) and the effectiveness of the promotion. However, price reductions jeopardize brand equity from a long-term perspective, despite the immediate short-term financial gain (Yoo, Donthu, and Lee, 2000). Research on the long-term impact of the sales promotions suggests several negative drawbacks.
First, the frequent use of price promotions will change consumers’ motivations to buy from a category. Therefore, consumers will wait for future price reductions to buy the product (Nijs et al., 2001), and they will buy fewer quantities (Mela et al., 1999). Together, these consequences translate into lower margins to retailers.
Second, the frequent use of price promotions makes consumers less sensitive to it, decreasing their effectiveness (Nijs et al., 2001) and the credibility about its offers (Gupta and Cooper, 1992).
Third, price promotions do not enhance the strength of brand association, because customers tend to think primarily about the price and not about the utility provided by the brand (Yoo, Donthu, and Lee, 2000), which it is not useful to enhance the brands’ equity.
Fourth, sales promotions aim to enhance consumers’ purchase intentions, but this requires considering every consumer to have a minimum value needed to change their choice (Gupta and Cooper, 1992), which is not always easy to figure out and most of the times demand additional costs.
Besides the duration, previous evidence shows another set of variables that impact the effectiveness of promotions. For instance, customers engage more with perishable products since the usage rate is higher (Ailawadi and Neslin, 1998) and both short- and long-term promotions are more useful for that type of products. Also, the fact of the product under price reduction being new or not also influences the effectiveness of the promotion, especially in short-term strategies. This preference seems to be driven by the fact that new products attract more customers, making them change their purchase behavior (Dekimpe et al., 1997). Finally, another relevant variable is the competitive structure of the market since both monopolists, and companies in competitive markets may benefit the short-run effectiveness of sales promotion (Nijs et al., 2001).
Overall, this point state sales promotions to have several advantages, especially for low equity brands that enjoy from frequently adopting these strategies. Also, presenting price reductions in absolute terms is preferred for high equity products while percentage reductions are optimal for low equity. However, there are also some disadvantages when it comes to adopting these strategies. As previously stated, besides sales promotions negatively affect high equity brands, they might even lead low equity brands to lose their effectiveness in a long-term
19 perspective, since customers become less sensitive and tend to buy fewer quantities or wait for further promotions.
2.3. The effect of promotions on the consumers’ perceptions
High and low equity brands cannot adopt the same OPS since they have a self-definition function responsible for fulfilling consumers needs of identification (Bhattacharya and Sen, 2003) that drives their adoption process. Therefore, they adopt different strategies to be coherent with the image they want to transmit, expecting to positively affect consumers’ behaviors (Gupta and Cooper, 1992).
High equity brands should not be accessible to mass customization, and that can explain the lack of sales promotions on their Facebook pages. The policy taken for high equity brands are more related to advertising spending, good store image, and high distribution intensity (Yoo, Donthu, and Lee, 2000).
The literature presents some examples of the negative impact on consumers’ perceptions of luxury brands regarding price reductions (Kapferer et al., 2014) reinforcing that the feeling of losing exclusivity might be an explanation for high equity brands to not frequently adopt sales promotions strategies. Besides, it can damage the perceived value of the brand as the new price enables more people to access it (Kapferer et al., 2014). Another reason found against promotions in high equity brands was the inconsistency with the perceived quality and the status of the brand. As the perceived quality, value, and image influences brand equity (Agarwal and Rao, 1996; Yoo, Donthu, and Lee, 2000), damaging one of these variables is expected to negatively affect their equity.
Contrarily, low equity brands adopt sales promotions strategies on SMN to arouse the interest of customers in the product and increase the probability of purchasing, by enhancing their perceptions (Della Bitta, Monroe, and McGinnis, 1981).
2.4. Sales promotions on social media networks
Due to the growth of e-commerce in the latest years, brands are giving higher importance to their SMMS, including sales promotions. Besides, studies have shown price promotions to impact the brands’ performance (Rapp, Beitelspacher, Grewal and Hughes, 2013).
Admittedly, to perform in social media, managers need to know their users and predict their reactions concerning online promotions. Under such circumstances, the existing studies about consumers’ online activities and their preferences help managers adapting and optimizing their campaigns. For instance, research about the impact of traditional marketing on online
20 consumer activities (Srinivasan, Rutz, J. Pauwels, 2016) suggests a framework to trace the consumers’ purchase process based on three primary stages – cognitive (learning), affective (feeling), and conative (behavior), responsible for defining the influential purchasing factors. Furthermore, the stages identified by Srinivasan and his colleagues (2016) can be measured on Facebook by cognitive or affective (Laran, Juliano, and Tsiros, 2013) consumer activities such as paid search clicks, website visits, likes, and even positive or negative comments that provides a way to measurement the Inditex of consumers’ engagement.
Besides, Chandon and his colleagues (2000) created a framework concerning the benefits provided by monetary and non-monetary promotions. This framework predicts the type of products for which price reductions are effective, through the analysis of three utilitarian and three hedonic benefits. Regarding the practical benefits, monetary savings are not the only advantage but also the increase in quality and convenience, while the hedonic benefits prioritize value expression, exploration, and entertainment characteristics. Moreover, sales promotions proved to increase the market share of high-equity brands, and monetary discounts proved to be more useful for functional rather than hedonic products.
Understanding the difference between utilitarian and hedonic products in consumers shopping behavior is relevant to optimize the OPS on social media. This topic has been the subject of several studies since it explains the consumption phenomenon (Babin, Darden, and Griffin, 1994; Childers et al., 2001). Utilitarian products lead consumers to think objectively and make them pass through a decision-making process based on an overall evaluation of the product, by considering all the available information. Contrary, a hedonic product arouses the emotional side of consumers, making them buy it impulsively, due to the enjoyment and fun the product provides (Babin, Dardin, and Griffin, 1994; Childers et al., 2001).
Undoubtedly, the findings of the hedonic consumption emphasizing characteristics as sounds and visual images (Hirschman and Holbrook, 1982), including product images or sampling music, which knowledge might be useful to optimize sales promotions on SMN. 2.5. User-generated content on Facebook
The main reason of Facebook success for brands is building social experiences by enabling the development of relationships with customers, enhancing their reputation, and connecting people to organizations (Rapp, Beitelspacher, Grewal, & Hughes, 2013). Through this social network, brands create communities that leverage consumer behaviors towards purchase decisions, which is possible since people use this network to help them deciding (Bhattacharya & Sen, 2003). They also express their opinion about brands with others, increasing the likelihood of word-of-mouth (WOM). Previous work has investigated the effect
21 of WOM communications on online communities, showing communication form, character narrative, communicational norms, and marketing promotion elements to be the key for the success (Kozinets et al., 2010). Brand managers need to consider these four factors when defining the type of promotions suitable for their community and its rules on Facebook.
UGC is one of the most common approaches to measuring the success of a campaign on Facebook since it expresses the degree of consumer engagement. The type of brand-related UGC created varies according to social media under analysis, but, in all of them, they had a vital role in consumers’ perceptions (Smith, Fischer, and Yongjian, 2012). Some people engage with brands on Facebook as a function of a self-presentation through user-produced content (Zywica and Danowski, 2008; Smith, Fischer, and Yongjian, 2012), which means they can use the content created by brands as a way of expressing themselves.
Most pages of brands on Facebook adopt proactive SMMS, encouraging people to interact with them (Muñiz and Schau, 2007). Also, they contain information about new products, coupons, price promotions, and events, enabling consumers to talk about them in their pages and share them with others (Smith, Fischer, and Yongjian, 2012).
Furthermore, Facebook has an advantage of allowing their followers to express their disagreement with the posts by liking, commenting, sharing it or another type of interactions, representing a metric for brands to measure their effectiveness and popularity (De Vries, Gensler, and Leeflang, 2012).
2.6. Conclusions and hypotheses formulation
The type of content created by brands in social media campaigns influences their performance. Indeed, campaigns regarding sales promotions have an impact on consumers’ choice process and brands’ equity. High equity brands are negatively affected by adopting price promotional campaigns, while low equity brands beneficiate of those strategies.
Little research studied the impact of promotional content has on brands’ performance as a function of brand equity, providing confidence on the innovative insights to the existing knowledge. Moreover, research about the impact of the following variables: brand equity, promotional frequency, promotional discount, and promotional type on brands’ performance is still a field to explore.
Consistently with the previous findings, I predict a positive impact of frequent sales promotions for low equity brands on the performance and a negative impact of the frequent sales promotions for high equity brands on the performance, even after controlling for the market structure, the industry, and the perishability of the product.
22 Additionally, promotional discounts (high vs. low) are also likely to enhance the Facebook posts performance of low equity brands, contrary to high equity brands.
Although promotional content assumed to enhance the performance of brands when compared to other types of content, the different types of promotions are expected to perform differently. In this case, percentage discounts are expected to perform better than cents-off deals.
Considering the two research questions formulated in Chapter I and according to the literature overview, this dissertation addressed the following research hypotheses:
H1: The frequency of price promotions affects the brand performance, on Facebook, as a function of brand equity.
H1a: Highly (vs. low) frequent price promotions on Facebook decreases the performance of high equity brands.
H1b: Highly (vs. low) frequent price promotions on Facebook increases the performance of low equity brands.
H2: The amount of price reduction affects the performance as a function of brand equity, on Facebook.
H2a: For high equity brands, any promotional discount (high vs. low) decreases the performances.
H2b: For low equity brands, any promotional discount (high vs. low) increases the performances.
H3: Facebook posts containing sales promotions lead to an increase in the performance of brands.
H3a: Facebook posts containing percentage discounts (vs. cents-off deals) lead to an increase in the performance of brands.
23
Table 1 - Evaluator variables of brand equity from the consumer-based perspective.
CHAPTER 3 – METHODOLOGY 3.1. Research approach
Two different approaches can be undertaken in the research field, deductive or inductive. This dissertation adopts the first approach since the literature insights lead to believe that there is a relationship between the independent variables and the performance. Also, it enabled to construct the hypotheses to test (Robson, 2002) and to quantitatively measure.
There are three types of research approaches used to find data for testing the hypotheses and formulate conclusions: descriptive, exploratory and explanatory (Saunders, Lewis, and Thornhill, 2009). This dissertation adopted the descriptive research, where secondary data about sales promotions were collected through the official Facebook brand pages and used to infer about possible reasons for them to achieve success. Secondary data also enabled to develop a theory to understand the phenomena behind the sales promotions on SMN.
Furthermore, based on the literature overview and the research methods of Saunders, Lewis, and Thornhill (2009), it was possible to get insights about the promotional factors that influenced the performance on Facebook, taking into account equity of brands.
3.2. Research methods
3.2.1. The selection of brands for the study
The literature suggests there are two approaches to evaluate brand equity: financial and customer-based. Table 1 presents the several variables identified in the literature overview chapter that define brand equity in the consumer-based perspective.
Variable Author
Brand Name Dodds, Monroe and Grewal (1991)
Brand Price Dodds, Monroe and Grewal (1991); Aaker (1991) Loyalty Dodds et. al (1991); Chaudhuri and Holbrook (2001) Likelihood of purchase Smith and Swinyard (1983)
Purchase intentions Machleit, Madden, and Allen (1990)
WTP for premium Yoo et., al (2000); Faircloth, Capella and Alford (2001) Brand Awareness Aaker (1991); Keller (1993); Agarwal and Rao (1996) Perceived quality Aaker (1991); Agarwal and Rao (1996)
Perceived value Dodds, Monroe and Grewal (1991); Agarwal and Rao (1996) Exclusivity/ Authenticity Dodds, Monroe and Grewal (1991); Agarwal and Rao (1996) Brand Relationship Keller (1993)
24
Table 2 - Financial values of brands.
Notes. All the data in this table was gathered from Forbes (2018), Brand Finance (2018), and Mundo das Marcas (2016). The brands not included in the Forbes rating or the Annual report on the world’s most valuable retail brands are considered low equity.
For undertaking this approach, information about the consumer-based equity would be necessary to gather through primary qualitative data to understand how consumers perceive the brands in the different fields. Furthermore, it could lead to some biases since consumers who have never experienced purchasing from a particular brand, would use price as an indicator of quality. As a matter of fact, when people do not know a brand, they tend to associate lower prices with lower quality and status (Dodds, Monroe, and Grewal, 1991).
Therefore, and because the information is available from credible sources, this dissertation assumed the financial approach of defining brand equity. Table 2 presents the selected brands and their economic values.
Besides the brand value, the choice of the six brands had in consideration the type of strategy they adopt on Facebook. Most high equity brands do not post sales promotion on Facebook. Thus, this study only includes the brands who presented promotional posts on their pages.
3.2.2. Data collection
The brands included in the study are from several categories: furniture, grocery, restoration, and electronic retail. After choosing the brands – McDonald’s, IKEA, Lidl, Continente, Pingo Doce, and FNAC – ten promotional and ten non-promotional posts of each, a total of one hundred and twenty publications from 30th October 2017 to 20th October 2018, were empirically analyzed.
The UGC, namely the number of likes/reactions, shares and comments of each post brand were collected and compiled (Annexes 1 and 2).
It is relevant to refer that since 2016, Facebook introduced new reactions – love, haha, wow, sad, and angry – as an extension to the like button, to people express their disagreement with the content shared. However, the Facebook algorithm counts all reactions as likes (Hubspot, 2017). Therefore, in this study, they were attributed to the same score.
Brand Financial Value Brand Financial Value
High equity brands Low equity brands
McDonald’s $ 41.4 B Continente $417 M
IKEA $ 14.5 B Pingo Doce $946 M
25
Table 3 - Classification of the independent variables.
The information about the reaction of the customers was collected from the Portuguese official brand pages and aimed to measure the customers’ level of engagement with the promotional posts that, afterward, helped to measure the brands’ overall performance on Facebook.
With the goal of taking some conclusions about the preferences of the consumers regarding the content shared by brands on social media websites, this research included a comparison between promotional and non-promotional posts and a comparison between two sales promotion types (percentage discounts vs. cents-off deals).
3.2.3. Independent variables
The research hypotheses required measuring the effects of the variables described in Table 3 on the Facebook brands performance.
Variable Type Level of measurement Categories
Promotional frequency Metric, continuous Interval High Low
Brand equity Non- metric,
categorical Nominal
High Low
Promotional discount Non- metric,
categorical Interval
High (³ 50%) Low (< 50%)
Promotional type Non- metric,
categorical Nominal
Cents-off deals Percentage discounts
3.2.3.1. Promotional frequency
The frequency is a categorical variable with two levels: high and low. This variable translates into the number of times that a brand posted sales promotions on their Facebook pages. The study considered brands to post frequently if, in successive twelve posts, at least one is about price discounts. Otherwise, they were classified as having low-frequency posting times. 3.2.3.2. Brand equity
High and low equity brands were defined according to the preferences of their users. Specifically, high equity brands were brands categorized as having a higher preference and financial value, whereas low equity brands were those brands categorized as having a lower preference and financial value.
26
Table 4 - Key performance indicators (KPI) of brands on Facebook.
3.2.3.3. Promotional discount
The promotional discounts variable is also categorical and refers to the amount of price reduction. In this study, a high promotional discount admitted reductions equal or higher than 50% of the total value, and a low promotional when is less than 50%, either in absolute or relative terms.
3.2.3.4. Promotional type
Types of promotions is a categorical variable that includes two different categories: cents-off deals (promotions presented in absolute values), and percentage discounts (promotions presented in relative values). Other types of price reductions such as rebates, refunds, and media distributed coupons were not included in the study since most of this exclusive information is sent directly to customers. Typically, brands often adopt this particular SMMS because customers prefer those exclusive offers over the inclusive (Barone and Roy, 2010), like being available to everyone on Facebook.
3.2.4. Dependent variable
3.2.4.1. Performance on social media networks
Performance of the selected brands was measured through two KPIs (exposure and engagement) as defined by Thackeray, Neiger, Smith, and Van Wagenen (2012) and calculated according to data gathered from the posts of brands. More precisely, these KPIs were evaluated through the UGC coming from the online consumer activities (Srinivasan, Rutz, J., and Pauwels, 2016), particularly the likes and reactions, shares, comments, and the number of Facebook followers. Table 4 presents the KPIs measurement method.
KPI Definition Metrics
Exposure Number of people who follow the
Facebook brand page. The number of Facebook pages followers.
Engagement
Share Rate - Ratio of shares according to the audience size. Talk Rate - Ratio of comments according to the audience size. Love Rate - Ratio of likes according to the audience size.
Number of people who interact with the posts: Share rate = !"#$% "' (")# )*$+,) - . /º "' ,-(")1+, 𝑥 100 Talk Rate= !"#$% "' (")# 5"66,/#) - 7 /º "' ,-(")1+, 𝑥 100 Love Rate = !"#$% "' (")# %89,) - : /º "' ,-(")1+, 𝑥 100
Performance Sum of the engagement rates. Performance Rate = Share Rate + Talk rate + Love Rate
27
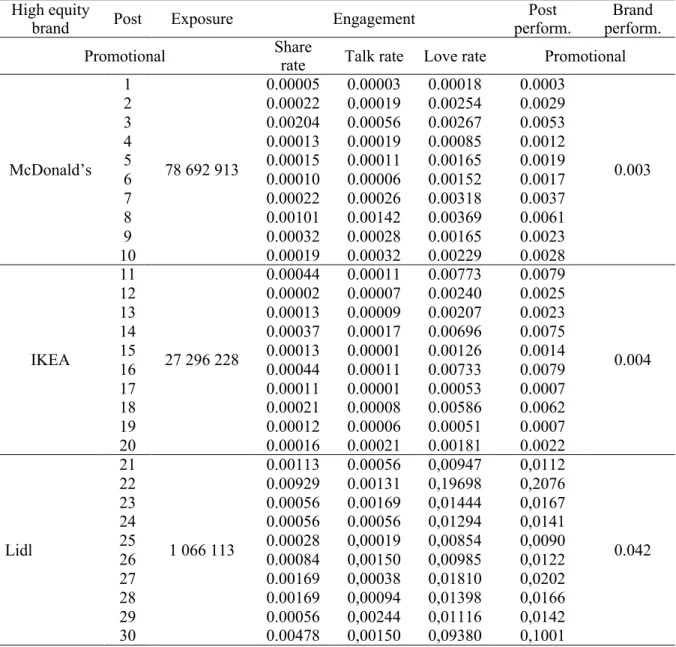
Table 5 - High equity brands performance of promotional posts. Table 5 - High equity brands performance of promotional posts.
After gathering all the information about the UGC from the one hundred and twenty posts, I considered three rates: share, talk, and love, to measure the level of engagement.
Each type of interaction was scored according to the level of its engagement defined by Peters and his colleagues (2013): like or reaction (score = 1), share (score = 2), and comment (score = 3). Afterward, the engagement of each UGC was summed up and presented in Tables 5 and 6 for high and low equity brands, respectively. Then, the values of the three rates facilitated to calculate the performance of promotional and non-promotional (Annexes 3 and 4) posts. Because the final index is a composite variable averaging the different KPIs with different units of measurement, all the indicators were standardized before the computation of the performance Inditex. Thus, higher values represent greater performance levels.
High equity
brand Post Exposure Engagement perform. Post perform. Brand Promotional Share rate Talk rate Love rate Promotional
McDonald’s 1 78 692 913 0.00005 0.00003 0.00018 0.0003 0.003 2 0.00022 0.00019 0.00254 0.0029 3 0.00204 0.00056 0.00267 0.0053 4 0.00013 0.00019 0.00085 0.0012 5 0.00015 0.00011 0.00165 0.0019 6 0.00010 0.00006 0.00152 0.0017 7 0.00022 0.00026 0.00318 0.0037 8 0.00101 0.00142 0.00369 0.0061 9 0.00032 0.00028 0.00165 0.0023 10 0.00019 0.00032 0.00229 0.0028 IKEA 11 27 296 228 0.00044 0.00011 0.00773 0.0079 0.004 12 0.00002 0.00007 0.00240 0.0025 13 0.00013 0.00009 0.00207 0.0023 14 0.00037 0.00017 0.00696 0.0075 15 0.00013 0.00001 0.00126 0.0014 16 0.00044 0.00011 0.00733 0.0079 17 0.00011 0.00001 0.00053 0.0007 18 0.00021 0.00008 0.00586 0.0062 19 0.00012 0.00006 0.00051 0.0007 20 0.00016 0.00021 0.00181 0.0022 Lidl 21 1 066 113 0.00113 0.00056 0,00947 0,0112 0.042 22 0.00929 0.00131 0,19698 0,2076 23 0.00056 0.00169 0,01444 0,0167 24 0.00056 0.00056 0,01294 0,0141 25 0.00028 0,00019 0,00854 0,0090 26 0.00084 0,00150 0,00985 0,0122 27 0.00169 0,00038 0,01810 0,0202 28 0.00169 0,00094 0,01398 0,0166 29 0.00056 0,00244 0,01116 0,0142 30 0.00478 0,00150 0,09380 0,1001
28
Table 6 - Low equity brands performance of promotional posts.
3.2.5. Control variables
As have been pointed in the literature chapter, other uncontrolled factors called covariates are expected to have an impact on the performance of brands on Facebook. Table 7 presents those covariates, according to Nijs and his colleagues' studies (2001), that might affect the performance and the explanatory power of the independent variables.
The covariates are assumed to be linearly related to the performance, increasing the power of the statistical tests but reducing within-group variance (Tabachnick & Fidell, 2001). In some cases, the explanatory power of the covariate is so high that reduces or even eliminates the significance of the independent variables. For these reasons, in this study, the effects of these three variables were held constant by performing ANCOVA tests, to isolate the impact of the independent variables on the performance and yield more precise estimates.
High equity
brand Post Exposure Engagement perform. Post perform. Brand Promotional Share rate Talk rate Love rate Promotional
Continente 31 2 003 023 0.00015 0.00000 0.00090 0.0010 0.052 32 0.00090 0.00020 0.00160 0.0027 33 0.00015 0.00000 0.00404 0.0042 34 0.00270 0.00300 0.02112 0.0268 35 0.01168 0.00399 0.19970 0.2154 36 0.00419 0.00130 0.00984 0.0153 37 0.00225 0.00150 0.02516 0.0289 38 0.00240 0.00140 0.01363 0.0174 39 0.02351 0.00998 0.17474 0.2082 40 0.00015 0.00030 0.00250 0.0029 Pingo Doce 41 375 177 0.08876 0.02292 1.14613 1.2578 0.904 42 0.03119 0.04105 0.31985 0.3921 43 0.05118 0.01972 0.85293 0.9238 44 0.07357 0.02772 0.98620 1.0875 45 0.11674 0.03732 0.31985 0.4739 46 0.25748 0.10822 0.77297 1.1387 47 0.01919 0.00320 0.11861 0.1410 48 0.18871 0.04851 0.87958 1.1168 49 0.33664 0.09809 1.59925 2.0340 50 0.05837 0.01919 0.39981 0.4774 FNAC 51 731 098 0.00082 0.00219 0.00369 0,0067 0.014 52 0.00000 0.00082 0.00219 0,0030 53 0.00000 0.00027 0.00109 0,0014 54 0.00821 0.00684 0.02407 0,0391 55 0.00000 0.00027 0.00274 0,0030 56 0.00739 0.00246 0.01874 0,0286 57 0.00164 0.00082 0.00410 0,0066 58 0.00164 0.00219 0.01354 0,0174 59 0.00410 0.00109 0.01806 0,0233 60 0.00082 0.00109 0.00752 0,0094
29
Table 7 - Classification of the control
variables.
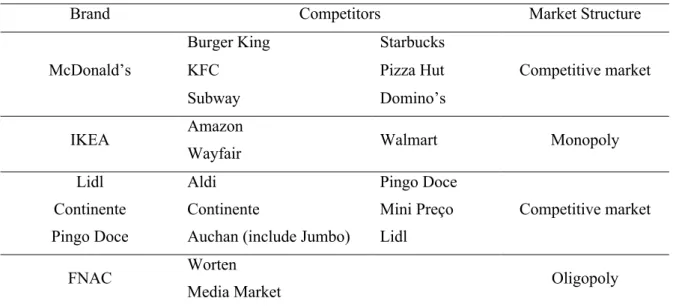
Table 8 - Classification of the market structure of brands in the Portuguese market.
Note. All the data in this table was gathered from Forbes (2012), Statista (2018), and Marketing 91 (2018).
3.2.5.1. Market structure
Table 8 summarizes the market structure of each brand included in the study, defined according to their actual competitors.
Brand Competitors Market Structure
McDonald’s
Burger King Starbucks
Competitive market
KFC Pizza Hut
Subway Domino’s
IKEA Amazon Walmart Monopoly
Wayfair Lidl
Continente Pingo Doce
Aldi Pingo Doce
Competitive market
Continente Mini Preço
Auchan (include Jumbo) Lidl
FNAC Worten
Media Market Oligopoly
McDonald’s – All the fast food brands operating in the Portuguese market were
considered competitors. In this context, companies are described as fast food if they offer high-speed service to customers.
IKEA – Although IKEA was found out to have some relevant competitors like Amazon,
Wayfair, and Walmart. However, this study only considers competitors with physical stores in Portugal. Subsequently, IKEA is considered a monopoly since there is no other company with the same model business in Portugal.
Variable Categories Market Structure Monopoly Oligopoly Competitive market Perishability High Low Industry Furniture Grocery Food Electronic retail
30
Table 9 - Classification of the industry of brands.
Lidl, Continente, and Pingo Doce – All the grocery stores operating in Portugal were
considered.
FNAC – Although FNAC has a broad product portfolio and operates in several business
areas like books, movies, sports and health, musical instruments, and others, this study only considers the electronic products. Therefore, all the companies that have a physical store and operate in this industry in Portugal were considered competitors.
3.2.5.2. Perishability of the product
The perishability of the product regards their lifetime. Short lifetime products are the ones for immediate or quick consumption, for instance, meats, fruits, ice-creams, pharmaceuticals, while long lifetime relates to products like smartphones, televisions, and furniture.
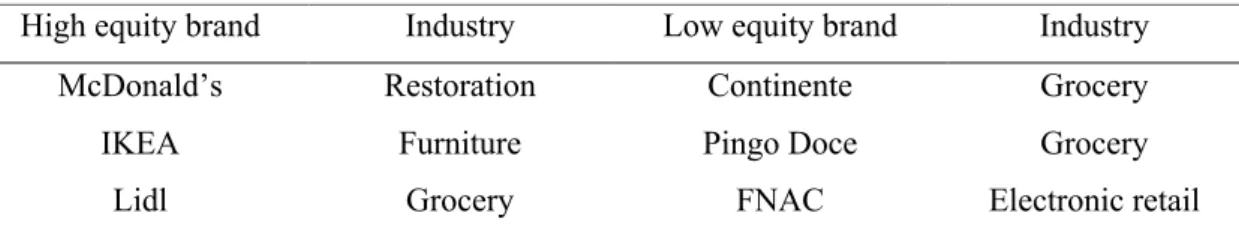
3.2.5.3. Industry
Table 9 presents the brands and the classification of their industry.
High equity brand Industry Low equity brand Industry
McDonald’s Restoration Continente Grocery
IKEA Furniture Pingo Doce Grocery
31 CHAPTER 4 - RESULTS AND DISCUSSION
4.1. Data Analysis
To answer the research questions formulated in Chapter I, the collected data regarding the brand equity, the promotional frequency, the promotional reduction, the promotional type, the market structure, the perishability of the product, and the industry were compiled into SPSS datasets, and analyzed by the execution of parametric tests (Razali and Wah, 2011), namely ANOVAs and ANCOVAs.
The execution of the ANOVAs and ANCOVAs tests required the fulfillment of six assumptions: a) the dependent variable should be metric, b) the independent variable should be non-metric, c) there is no relationship between the observations, d) there should be no significant outliers, e) the dependent variable should follow approximately normal distribution, f) there needs to be homogeneity of variances.
The assumptions of a) to c) were verified in all cases. To study the assumption d), we analyzed the box plots of the performance provided by SPSS, and it was identified two outliers of each brand equity. Thus, they were not included in the analysis of the tests, and the sample size became fifty-six, n = 56 (twenty-eight cases for low equity brands and twenty-eight for high equity).
Second, to test the assumption e), we performed the Shapiro-Wilks test (Shapiro & Wilk, 1965), rejecting the null hypothesis stating the performance scores were not statistically significantly different from the normal distribution. In other words, the normality assumption was violated.
However, there were two reasons against the results that gave confidence to this study to assume the performance variable followed a normal distribution. First, due to the skewness of and kurtosis values, which are respectively 1.694 and 1.526 for low equity brands and .926 and .226 for high equity brands (Annex 5). This assumption was valid since values between -2 and +-2 are acceptable for a normal univariate distribution (George & Mallery, -2010). Second, according to the Central Limit Theorem (Field, 2013), the distribution of the means becomes normal as the number of samples increases, regardless of the shape of the population distribution. Hereby, sample sizes containing a large number of observations, which is assumed to be thirty or above, can also be considered as following a normal distribution. Thus, the distribution of the performance was assumed to be normal.
Third, to test the assumption f), Levene’s tests were performed, and the results rejected the null hypothesis, meaning that variances are founded to be significantly different (unequal)
32 across the groups. However, since high and low equity brands’ samples had the same sizes (n = 28) this assumption was overcome (Keppel et al., 1992).
During the analysis, the results of the parametric tests proved the level of significance, was not significant or marginally significant (p-value between .05 and .10) (Pritschet et al., 2016) in the following cases: the effect of promotional type and promotional discount on performance as a function of brand equity (high vs. low).
However, the level of significance only provides information about the difference between the groups within the independent variables. Then, since the level of significance depends on the sample size, and higher sample sizes are most likely to present a statistical significance (Sullivan & Feinn, 2012), even if the results are non-significant, the analysis of their effect sizes were made with the aim of finding their proportion of variance on the performance.
Additionally to p-values, I considered two extra approaches to analyze statistical significance: a) the partial eta squared (η2
p) and b) the Cohen’s d (Cohen, 1973), both measures
of the effect size, and widely used in psychological research (Lakens, 2013). The partial eta squared values measures how much variance of the dependent variable is explained by the independent variable, while Cohen's d calculates the difference between the means of the groups, enabling the classification of the effect size.
It is important to refer that the level of significance considered for all the following analysis is α = .05 (Tabachnick & Fidell, 2001).
4.2. The effect of brand equity and frequency on social media performance
To test the hypothesis H1a) and H1b) that relates the effect of brand equity (high vs. low) and promotional frequency (high vs. low) on brands’ Facebook performance, we conducted a Univariate ANOVA, entering brand equity and promotional frequency as the between-subjects factors and performance as the dependent variable.
The results showed a main effect of brand equity, F(1,52) = 6.01, p = .018, η2
p = .104,
d = 0.681, a main effect of promotional frequency, F(1,52) = 6.04, p = .017, η2
p = .104, d =
0.681, both qualified by an interaction effect of brand equity by promotional frequency, F(1,52) = 5.30; p = .025, η2p = .093, d = 0.640.
Simple pairwise comparison revealed that for high equity brands with low frequency in their promotional campaigns, performance of the brands (M = 0.01, SD = 0.08) did not significantly differ from high frequency promotional campaigns (M < 0.01, SD = 0.06, p = .916). However, as predicted, for low equity brands, lower frequency of promotions increased
33 significantly brands’ performance (M = 0.35, SD = 0.06) when compared to high frequency promotions (M = 0.01, SD = 0.08, p = .001).
Furthermore, the interpretation of the effect sizes showed the brand equity, the promotional frequency, and their interaction between them to have an intermediate effect on the performance (Annex 6).
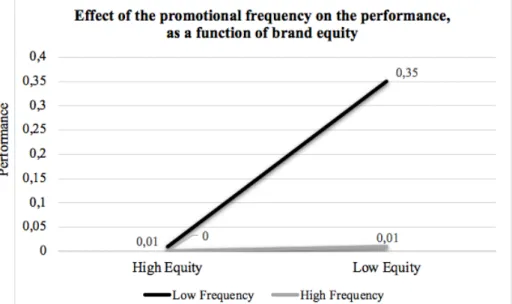
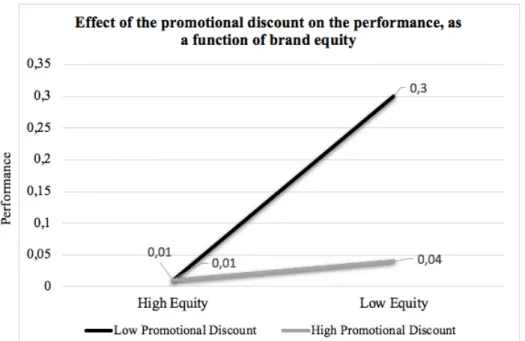
To visually observe the effect of the promotional frequency on the performance, as a function of brand equity, we constructed Figure 1.
Findings show that over-promoting on Facebook damaged the performance of brands. Additionally, the performance of brands with high financial values (e.g., McDonald’s) is small, demonstrating that sales promotions do not provide better performance levels. Notwithstanding, for low equity brands (e.g., Pingo Doce), besides over-promoting harming their performance, having an adequate frequency posting strategy provide them higher performance values, which indicates that their customers value promotional content when sparingly used. Thus, hypothesis 1a) was confirmed whereas 1b) was rejected.
Next, we conducted an ANCOVA, using the same factors and the dependent variable, but also entering the market structure, the perishability of the product and the industry type as control variables. The interaction effect of brand equity by promotional frequency was still statistically significant even after controlling the market structure, F(1,51) = 5.15, p = .028, η2p
= .092, d = 0.637, the perishability of the product, F(1,51) = 5.03, p = .029, η2p = .090, d =
0.629, and marginally significant after controlling the industry, F(1,51) = 3.22, p = .079, η2p =
.059, d = 0.501, (Annex 7). Also, there was no significant impact on its effect size (Annex 8). Figure 1 - Comparison of the Facebook performances according to posting
34 4.3. The effect of brand equity and promotional discount on social media performance
To test hypotheses H2a) and H2b), that relates the effect of brand equity (high vs. low) and promotional discount (high vs. low) on brands’ Facebook performance, we conducted a Univariate ANOVA, entering brand equity and promotional discount as the between-subjects factors and performance as the dependent variable.
The results showed a main effect of brand equity, F(1,52) = 4.61, p = .036, η2
p = .081,
d = 0.594, and a marginal main effect of promotional discount, F(1,52) = 2.88, p = .096, η2
p =
.052, d = 0.468. Although the significance value was not statistically significant for the interaction between promotional discount and brand equity, F(1,52) = 2.78, p = .101, η2
p = .051,
d = 0.464, its partial eta square and Cohen d values proved it to have an explanatory power on
the performance, representing a small effect (Annex 6).
Simple pairwise comparison revealed that for high equity brands with low promotional discounts in their promotional posts, performance of brands (M = 0.01, SD = 0.06) did not significantly differ from high promotional discounts campaigns (M = 0.01, SD = 0.10, p = .984). However, even though the p-value was not statistically significant for the effect of the interaction between promotional discount and equity, we did find a significant difference in the means of promotional discounts for low equity brands. Subsequently, lower promotional discounts increased significantly brands’ performance (M = 0.30, SD = 0.06) when compared to high promotional discounts (M = 0.04, SD = 0.09, p = .019).
Figure 2 was constructed for a better understanding of the effect of promotional discounts (high vs. low) on the performance, as a function of the equity of brands.
Figure 2 - Comparison of the Facebook performances according to promotional
35
Table 10 - Performance of promotional and non-promotional posts of brands.
Offering high (vs. low) promotional discounts damaged the performance of brands’ equity (high vs. low), which means those price reductions equal or higher than 50% (vs. 20%) does not lead to better performances on SMN, for example. Nevertheless, only low equity brands (e.g., Continente) benefit from offering lower promotional values since brands with higher equities (e.g., Lidl) presented worse performance levels. Thus, hypothesis 2a) was confirmed whereas 2b) was rejected.
After performing the ANCOVA, using the same factors and dependent variable, but also entering the market structure, the perishability of the product and the industry type as control variables, the main effects, and the interaction effect of brand equity by promotional discount were not statistically significant controlling for market structure, F(1,51) = 2.48, p = .122, η2
p
= .046, d = 0.439, and perishability of the product, F(1,51) = 2.74, p = .104, η2p = .051, d =
0.463, (Annex 9). However, monitoring the impact the industry, a statistical marginally significance of the interaction effect was presented, F(1,51) = 3.40, p = .071, η2p = .062, d =
0.514, and also a growth in its effect size that passed from small to intermediate. (Annex 10). 4.4. Promotional vs. non-promotional performance of posts
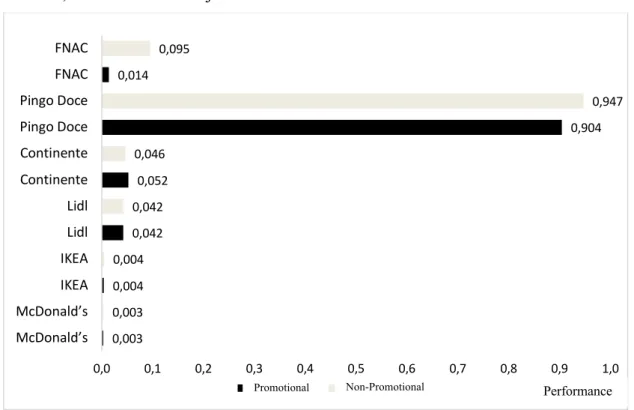
To understand whether the type of content is preferred by people on social media, we conducted an ANOVA to compare promotional with non-promotional posts. Table 10 presents the performance of brands for their promotional and non-promotional posts.
Additionally, Figure 3 shows the differences between promotional and non-promotional posts, enabling a quicker and easier analysis.
Non-promotional posts presented higher values than promotional posts. However, the ANOVA results, F < 1, p = .782 indicates that there is not a statistical difference between them. Accordingly, promotional content does not increase the performance of brands on social media
Promotional posts Non-Promotional posts
Equity Brands Performance Equity Brands Performance
High McDonald’s 0,003 High McDonald’s 0,003 IKEA 0,004 IKEA 0,004 Lidl 0,042 Lidl 0,042 Low Continente 0,052 Low Continente 0,046
Pingo Doce 0,904 Pingo Doce 0,947