Aeration and extraction in multiphase biological reactors
Texto
Imagem

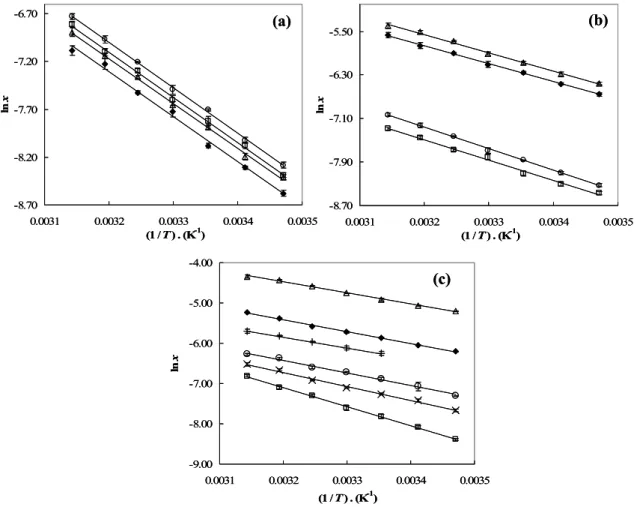
![Figure 2.2.2. Relative deviations between the experimental surface tension data of this work and those reported in the literature: (a) ○, C 6 F 14 [6]; ◊, C 6 F 14 [7]; □, C 6 F 14 [8]; +, C 6 F 14 [9]; , C 7 F 16 [7]; ●, C 7 F 16 [8]; ▲, C 7 F 16](https://thumb-eu.123doks.com/thumbv2/123dok_br/15740784.1072536/59.892.112.739.673.890/figure-relative-deviations-experimental-surface-tension-reported-literature.webp)

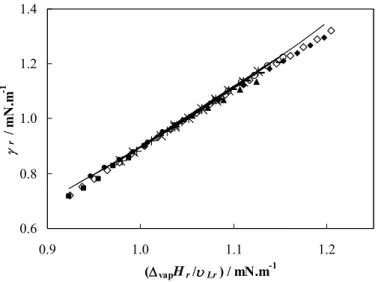
![Figure 2.2.4. Relative deviations between the experimental reduced surface tensions and those calculated with the Faizullin correlation [18]: ■, C 6 F 14 ; ●, C 7 F 16 ; ×, C 8 F 18 ; , C 9 F 20 ;](https://thumb-eu.123doks.com/thumbv2/123dok_br/15740784.1072536/64.892.261.648.145.415/figure-relative-deviations-experimental-tensions-calculated-faizullin-correlation.webp)

Documentos relacionados
Este estudo objetivou identificar a eficiência no uso dos recursos destinados à saúde pública das cidades de Santa Catarina pertencentes à mesorregião do Oeste Catarinense, por meio
1 — Em situações extraordinárias, determinadas pelo Primeiro -Ministro após comunicação fundamentada ao Presidente da República, de ataques terroristas ou de
This study aimed to assess the effects of a psycho-educational intervention, designed to improve direct care workers’ stress, burnout and job satisfaction and
Considerando-se a pesquisa realizada e os fatores citados acima, nota-se que a grande maioria das pessoas tem preferência em realizar suas compras pelo comercio eletrônico, pois
O presente artigo aborda a importância da família na formação social do adolescente, pois como assistente social do Centro de Referência Especializado de Assistência Social
The comparison between Candida cylindracea’s annotated genome and transcriptome features regarding the initiation codons of its gene sequences and transcripts,
E finalmente, para fomentar o envelhecimento ativo de indivíduos e populações é necessário não só criar oportunidades para os adultos idosos, mas também para
