Universidade de Aveiro
2014Manuel David
Fonseca Montenegro
Previsão de Capacidade para Redes
de Acesso Rádio
Capacity Forecasting for Radio Access
Networks
Dissertação apresentada à universidade de Aveiro para
cumprimento dos requisitos necessários à obtenção do grau de Mestre em Engenharia Eletrónica e Telecomunicações (Mestrado Integrado), realizada sobre a orientação científica do Professor Dr. Aníbal Manuel de Oliveira Duarte do Departamento de Eletrónica, Telecomunicações e Informática da Universidade de Aveiro.
Departamento de Eletrónica, Telecomunicações e Informática
3
o júripresidente / president
Prof. Dr. José Carlos da Silva Neves
Professor Catedrático da Universidade de Aveiro
Prof. Dra. Ana Cristina Costa Aguiar
Professora Auxiliar do Departamento de Engenharia Eletrotécnica e de Computadores da Faculdade de Engenharia da Universidade do Porto
Prof. Dr. Aníbal Manuel de Oliveira Duarte
Professor Catedrático da Universidade de Aveiroagradecimentos À minha família, em especial aos meus pais pelo esforço e apoio
que tornaram possível alcançar este objetivo.
Ao meu orientador, professor doutor A. Manuel de Oliveira Duarte, pela disponibilidade e essencial contributo para este trabalho.
À equipa da Nokia Networks, por tornar possível este estudo e pelos válidos conselhos para o mesmo.
palavras-chave
resumo
UMTS, Planeamento, Desempenho, Monitorização, KPI, Previsão
A estratégia comum dos operadores no mercado das redes móveis (área onde este trabalho se debruça) passa por uma consolidação da sua rede base já instalada e pela otimização dos recursos já existentes.
A crescente competitividade e agressividade deste mercado obrigam a que os operadores mantenham a sua rede atualizada e com o menor número de falhas possível, com a finalidade de oferecer a melhor experiência aos seus utilizadores. Neste contexto, esta dissertação apresenta um estudo que auxilia os operadores a aperfeiçoar futuras alterações na sua rede.
De um modo geral, esta dissertação compara alguns métodos de previsão (baseados maioritariamente na análise de séries
temporais) capazes de assistir os operadores no planeamento da sua rede e ainda apresenta alguns indicadores de rede onde as limitações de desempenho são mais frequentes.
keywords
abstract
UMTS, TMN, Planning, Performance, Monitoring, KPI, Forecasting
The mobile networks market (focus of this work) strategy is based on the consolidation of the installed structure and the optimization of the already existent resources.
The increasingly competition and aggression of this market requires, to the mobile operators, a continuous maintenance and update of the networks in order to obtain the minimum number of fails and provide the best experience for its subscribers. In this context, this dissertation presents a study aiming to assist the mobile operators improving future network modifications. In overview, this dissertation compares several forecasting methods (mostly based on time series analysis) capable of support mobile operators with their network planning. Moreover, it presents several network indicators about the more common bottlenecks.
i
Index
Index
... i
Tables Index
... v
Figures Index
... vi
Acronyms
... ix
1.
Introduction ... 1
1.1.
Motivation
... 2
1.2.
Objectives
... 2
1.3.
Organization of the Dissertation
... 3
2.
Mobile Network ... 4
2.1.
Mobile Network Evolution
... 4
2.1.1.
GSM Architecture
... 6
2.1.2.
UMTS Architecture
... 10
2.1.2.1.
Release 4
... 10
2.1.2.2.
Release 5
... 11
2.1.2.2.1.
IP Multimedia Subsystem ... 11
2.1.2.2.2.
HSDPA ... 13
2.1.2.3.
Release 6
... 14
2.1.2.3.1.
HSUPA ... 14
2.1.2.4.
Release 7
... 14
2.1.2.4.1.
HSPA & HSPA+ ... 15
2.1.3.
LTE Architecture
... 15
2.1.3.1.
E-UTRAN
... 15
2.1.3.2.
EPC
... 16
2.1.3.2.1.
MME ... 16
2.1.3.2.2.
S-GW ... 17
2.1.3.2.3.
PDN-GW ... 18
2.1.3.2.4.
PCRF ... 19
2.2.
Network Management
... 19
2.2.1.
Network Management Models
... 20
2.2.1.1.
OSI NMM
... 20
2.2.1.2.
Telecommunication Management Network
... 21
ii
2.2.1.2.2.
Physical Architecture ... 27
2.2.2.
Performance Management
... 29
2.2.3.
KPIs
... 30
2.2.4.
Configuration Management
... 32
2.2.4.1.
Why CM?
... 32
2.2.4.1.1.
Administrative Aspects ... 33
2.2.4.2.
CM systems and methods
... 34
2.2.4.2.1.
CM Operation ... 35
3.
Forecasting Methodology ... 36
3.1.
Introductory Concepts
... 36
3.1.1.
Methods
... 36
3.1.2.
Time Series Components
... 38
3.1.3.
Graphics
... 39
3.1.4.
Forecast Evaluation
... 40
3.1.4.1.
Sum of Squared Errors
... 40
3.1.4.2.
Mean Absolute Percentage Error
... 41
3.1.4.3.
Durbin-Watson
... 41
3.1.4.4.
Akaike Information Criterion
... 42
3.1.4.5.
Coefficient of Determination
... 42
3.1.5.
Outliers and influential observations
... 43
3.2.
Linear Regression and Correlation
... 45
3.2.1.
Simple Linear model
... 46
3.2.1.1.
Forecasting results
... 47
3.3.
Time Series
... 50
3.3.1.
Moving Average Smoothing
... 50
3.3.1.1.
Moving Average Filter
... 50
3.3.1.2.
Centered Moving Averages
... 51
3.3.1.3.
Examples of MA smoothing
... 52
3.3.2.
Classical decomposition
... 53
3.3.2.1.
Additive model
... 53
3.3.2.2.
Multiplicative model
... 54
3.3.3.
Holt-Winters Exponential Smoothing
... 55
3.3.3.1.
Multiplicative model
... 56
iii
3.3.3.2.
Result analysis
... 59
3.3.4.
AutoRegressive Moving Average
... 63
3.3.4.1.
Auto-Regressive model
... 64
3.3.4.2.
Moving Average model
... 65
3.3.4.3.
Non-Seasonal ARMA
... 66
3.3.4.3.1.
Result analysis ... 71
3.3.4.4.
Seasonal ARMA
... 74
3.3.4.4.1.
Forecast ... 75
3.4.
General Purpose
... 77
3.5.
Add-ons and Enhancements
... 78
3.5.1.
Manual Growth
... 78
3.5.2.
Level Offset
... 79
3.6.
CS Throughput Analysis
... 79
3.7.
PS Throughput Analysis
... 82
3.8.
Conclusion
... 85
4.
Forecasting Tool ... 86
5.
RNC Capacity Planning ... 94
5.1.
RNC user plane fill factor
... 95
5.1.1.
Iub PS throughput
... 97
5.1.2.
Iub CS throughput
... 98
5.1.3.
Outcome analysis
... 98
5.2.
Unit Load monitoring
... 100
5.2.1.
ICSU
... 101
5.2.2.
DMCU
... 105
5.2.2.1.
DMPG
... 106
5.2.2.1.1.
DSP ... 108
5.2.2.2.
RSMU
... 109
5.2.2.3.
GTPU
... 109
5.3.
RRC connected subscribers
... 110
5.4.
Busy Hour Call Attempt
... 111
5.4.1.
CS BHCA
... 111
5.4.2.
PS BHCA
... 112
6.
Conclusions ... 114
iv
8.
References ... 116
v
Tables Index
Table 1: 3GPP Releases
... 6
Table 2: Mapping function blocks into building blocks
... 28
Table 3: KPI categories
... 32
Table 4: Methods Summary
... 79
Table 5: Case Study #1
... 80
Table 6: Daily average PS throughput forecast results summary
... 84
Table 7: Models properties
... 85
Table 8: RNC user plane fill factor
... 95
Table 9: Measurements required to compute the Iub PS throughput
... 97
Table 10: AMR throughput counters
... 98
Table 11: M592 measurements
... 101
Table 12: ICSU load
... 102
Table 13: Counters used for ICSU overload inspection
... 103
Table 14: DMPG load
... 106
Table 15: DSP load
... 108
Table 16: RSMU load
... 109
Table 17: GTPU load
... 110
Table 18: RNC connected subscribers.
... 111
Table 19: BHCA counters
... 111
vi
Figures Index
Figure 1: Global mobile traffic
... 1
Figure 2: Final Goal:
... 2
Figure 3: UMTS (Rel. 5)
... 3
Figure 4: Mobile Generations
... 5
Figure 5: GSM Architecture
... 6
Figure 6: GSM Architecture (GPRS)
... 9
Figure 7: UMTS (Rel-5) Architecture
... 11
Figure 8: IMS Architecture
... 12
Figure 9: Release 7 (HSPA and HSPA+) Architecture
... 14
Figure 10: LTE (Release 8) Architecture
... 15
Figure 11: MME logical connections and main Control Functions
... 17
Figure 12: S-GW logical connections and functions
... 18
Figure 13: PDN-GW logical connection and main functions
... 18
Figure 14: PCRF main functions
... 19
Figure 15: TMN and a telecommunication network
... 22
Figure 16: Function blocks
... 23
Figure 17: Reference Points
... 24
Figure 18: TMN logical layers
... 25
Figure 19: TMN related architectures
... 27
Figure 20: Relation between architectures
... 27
Figure 21: Mapping reference points upon interfaces
... 28
Figure 22: Network Management Level
... 30
Figure 23: Report creation
... 31
Figure 24: CM Architecture (example)
... 34
Figure 25: Forecasting methods
... 37
Figure 26: Daily average voice throughput in Iub interface
... 38
Figure 27: Daily average voice throughput
... 39
Figure 28: RNC user plane fill rate vs. ICSU CPU load
... 40
Figure 29: Mean and Standard Deviation Sliding Window
... 44
Figure 30: AMR daily throughput
... 45
Figure 31: Scatter plot investigation
... 46
Figure 32: Daily average CS throughput in Iub interface
... 48
Figure 33: Real and forecasted values
... 49
Figure 34: Outliers and influential values
... 49
Figure 35: Block diagram of a 6th order/7-tap FIR filter
... 50
Figure 36: Moving average of order k=7
... 52
Figure 37: Moving average of order k=31
... 52
Figure 38: Constant seasonal amplitude (Additive model)
... 53
Figure 39: Additive decomposition steps.
... 54
Figure 40: Seasonal amplitude proportional to the trend (Multiplicative model)
... 54
Figure 41: Multiplicative decomposition steps
... 55
Figure 42: Holt Winters Initialization
... 58
vii
Figure 44: Solver tool
... 59
Figure 45: CS throughput
... 60
Figure 46: Holt-Winters forecast
... 60
Figure 47: Real values vs. forecasted values
... 61
Figure 48: Holt-Winters case study #1
... 61
Figure 49: Case Study #1 (w/ Level Offset)
... 62
Figure 50: Holt-Winters outliers’ case study #2 ... 62
Figure 51: Holt-Winters outliers’ case study #3 ... 63
Figure 52: Case study #3 without outliers.
... 63
Figure 53: Non-Stationary behaviors
... 64
Figure 54: p-order IIR filter implementing an AutoRegressive model
... 65
Figure 55: q-order FIR filter implementing an Moving Average model
... 66
Figure 56: FIR/IIR filter implementing an ARMA(p,q) model
... 66
Figure 57: ARMA cycle construction
... 67
Figure 58: AR(p) part of ARMA
... 69
Figure 59: MA(q), Error and Predictions
... 69
Figure 60: Parameters and Constraints
... 70
Figure 61: Solver Settings
... 70
Figure 62: Reliability Indicators
... 71
Figure 63: ARMA forecast
... 71
Figure 64: AMR daily traffic
... 72
Figure 65: ARMA case study #1
... 72
Figure 66: Case study #1 (Level Offset and Manual Growth)
... 73
Figure 67: AMR case study #3
... 73
Figure 68: AMR case study 3 without outliers
... 74
Figure 69: SARMA results
... 75
Figure 70: AMR daily traffic
... 75
Figure 71: SARMA case study #1
... 76
Figure 72: General model plus manual growth
... 78
Figure 73: Outliers Influence
... 81
Figure 74: Daily average PS throughput
... 82
Figure 75: PS throughput forecast
... 83
Figure 76: Forecasting tool
... 89
Figure 77: RNC Properties
... 90
Figure 78: Forecasting Section
... 90
Figure 79: Shortcuts
... 91
Figure 80: Methods
... 91
Figure 81: Methods Information
... 92
Figure 82: Results Section
... 92
Figure 83: RNC capacity
... 94
Figure 84: RNC capacity (PS vs. CS)
... 96
Figure 85: Forecast vs. Reality
... 99
Figure 86: User plane fill factor forecast
... 99
Figure 87: Fill rates relationship
... 100
Figure 88: RNC Architecture
... 101
viii
Figure 90: ICSU load forecast
... 104
Figure 91: Relationship between fill factor and ICSU load
... 105
Figure 92: DMCU architecture
... 106
Figure 93: Average DMPG CPU load forecast
... 107
ix
Acronyms
3GPP 3rd Generation Partnership
AAL2 ATM Adaptation Layer 2
ACF Autocorrelation Function
AIC Akaike Information Criterion
AMC Adaptive Modulation Coding
AMR Adaptive Multi-Rate
AR AutoRegressive
ARIMA Auto Regressive Integrated Moving Average
ARMA Auto Regressive Moving Average
ATM Asynchronous Transfer Mode
AuC Authentication Center
BLC Buffer Limit Control
BML Business Management Layer
BSC Base Station Controller
BSS Base Station Subsystem
BTS Base Transceiver Station
CA Carrier Aggregation
CAPEX CAPital EXpenditure
CDMA Code Division Multiple Access
CM Configuration Management
CN Core Network
CP Control Plane
CPM Communications Processor Module
CPU Central Processor Unit
CS Circuit Switch
CSCF Call Session Control Function
CSD Circuit Switched Data
x
DCN Data Communication Network
DHCP Dynamic Host Configuration Protocol
DMPG Data and Macro Diversity Processing Groups
DSP Data Signaling Processor
E-DCH Enhanced Dedicated Channel
EDGE Enhanced GPRS
eICIC enhanced Inter-Cell Interference Coordination
EIR Equipment Identity Register
eMBMS Multimedia Broadcast Multicast Services (MBMS)
EML Element Management Layer
EPC Evolve Packet Core
E-TACS Expanded Total Access Communication System
E-UTRAN Evolved UTRAN
FACH Forward Access Channel
FCAPS Functional, Configuration, Accounting, Performance and Security
FIR Finite Impulse Response
FP Framing Protocol
GERAN GSM EDGE Radio Access Network
GGSN Gateway GPRS Support Node
GMSC Gateway Mobile Switching Center
GPRS General Packet Radio Service
GRG Generalized Reduced Gradient
GSM Global System for Mobile Communications
GTP GPRS Tunneling Protocol
GUTI Globally Unique Temporary Identity
H-ARQ Hybrid Automatic Repeat Request
HeNB Home NodeB
HLR Home Location Register
HSCSD High Speed Circuit Switched Data
HSDPA High Speed Downlink Packet Access
xi
HSPA High Speed Packet Access
HSS Home Subscriber Server
HSUPA High Speed Uplink Packet Access
HW Hardware
I-CSCF Interrogating-Call Session Control Function ICSU Interface Control and Signaling Unit
IIR Infinite Impulse Response
IMEI International Mobile Equipment Identity
IMS IP Multimedia Subsystem
IMSI International Mobile Subscriber Identity
IoT Internet of Things
IP Internet Protocol
ISDN Integrated Services for Digital Network
ISO International Standardization Organization
ISUP ISDN User Part
ITU International Telecommunication Union
KPI Key Performance Indicator
LGMANA Leg Management Program Block
LLA Logical Layered Architecture
LS Least Squares Estimation
LTE Long Term Evolution
MA Moving Average
MAC Medium Access Stratum
MAF Management Applications Function
MAPE Mean Absolute Percentage Error
MBMS Multimedia Broadcast Multimedia Service
MGW Media Gateway
MIMO Multiple Input Multiple Output
MME Mobility Management Entity
MRFC Media Resource Function Controller
xii
MS Mobile Station
MSC Mobile Switching Center
MSS MSC Server
NE Network Element
NEF Network Element Function
NML Network Management Layer
NMM Network Management Model
OA&M Operation, Administration and Maintenance
OFDMA Orthogonal Frequency Division Multiple Access
OMS Operation and Management Server
OS Operation System
OSF Operation System Function
OSI Open Systems Interconnection
OSS Operation Support System
PACF Partial Autocorrelation Function
PCH Paging CHannel
PCRF Policy and Charging Rules Function
P-CSCF Proxy-Call Control Function
PCU Packet Unit Control
PDCP Packet Data Convergence Protocol
PDN Packet Data Network
PDN-GW Packet Data Network Gateway
PI Performance Indicator
PLMN Public Land Mobile Network
PM Performance Management
PMIP Proxy Mobile IPv6
PPC PowerPC
PS Packet Switch
PSTN Public Switched Telephone Network
PTO Public Telecommunication Operators
xiii
QoE Quality of Experience
QoS Quality of Service
RA Routing Area
RAB Radio Access Bearer
RAN Radio Access Network
RLC Radio Link Control
RNC Radio Network Controller
RRC Radio Resource Connection
RRM Radio Resource Management
RSMU Resource and Switch Management Unit
SAE System Architecture Evolution
SARMA Seasonal ARMA
S-CSCF Serving-Call Session Control Function
SGSN Serving GPRS Support Node
S-GW Serving Gateway
SHO Soft Handover
SIP Session Initiated Protocol
SLF Subscription Locator Function
SML Service Management Layer
SON Self-Organizing Networks
SSE Sum of Squared Errors
TA Tracking Area
TD-CDMA Time Division CDMA
TDMA Time Division Multiple Access
TF Transformation Function
TMN Telecommunication Management Network
TTI Transmission Time Interval
UE User Equipment
UI User Interface
UMTS Universal Mobile Telecommunication System
xiv
URA UTRAN Registration Area
UTRAN Universal Terrestrial Radio Access Network
VLR Visitor Location Register
WAC Windows Admission Control
WCDMA Wideband Code Division Multiple Access
WLAN Wireless Local Area Network
1
1. Introduction
The Universal Mobile Telecommunication System (UMTS) brought the possibility to access data services in a practical and viable way. The networks evolved from a voice oriented service to an enormous diversity of multimedia data services (IP based). Although most of the mobile networks revenues still coming from voice traffic, traffic trend analysis shows that this pattern is significantly changing. The data traffic is exploding due to the increasingly use of smartphones, tablets, dongles, flat tariffs plans, etc. Figure 1 by Eriksson clearly illustrates this trend.
Figure 1: Global mobile traffic
Source: “On the Pulse of the Networked Society”, Ericsson Mobility Report, June 2014
The diversity of services with multiple requirements is revealing itself a big challenge to mobile operators that are struggling to manage the performance of their networks and reduce their capital expenditure (CAPEX) and operational expenditure (OPEX). It is being difficult for them to follow the traffic’s trend.
Facing this situation, the mobile operators have on one hand the investment in network expansion only when it is really needed, which means CAPEX increase. On the other hand the need to optimize the network performance by maximizing the usage of existing resources to prevent bottlenecks and loss of revenue.
The current performance tools are based on measure and display several performance indicators. These indicators can tell, among several other metrics, the capacity state of the Network Elements (NEs) in the network. Although the Key Performance Indicators (KPIs) 1 are a powerful tool capable of tell if there are any current issues in the network, these cannot forecast when the network starts experiencing these capacity issues.
1
2
1.1.
Motivation
Facing this problem, network management entities have created mechanisms trying to prevent network capacity issues. These mechanisms are mainly based on the creation of reports and analysis of network indicators.
My motivation as a novice in the telecommunication management area is to develop forecast mechanisms capable of prevent network capacity issues.
1.2.
Objectives
The main goal of this study is to develop a forecast tool, based in mathematical models, suitable for operators to prevent potential problems related with network capacity.
To do so, it is necessary to study the most common forecast techniques, be able to manage and apply them to this particular case. It is also necessary to study the KPIs related to this matter and select the most significant ones to include in the forecast tool.
Figure 2: Final Goal
The objective is to make the forecast module take advantage of the existing resources, i.e. the forecast tool will use data (collected and filtered) from a real telecommunication vendor Operational Support System (OSS) and use it in its methods for forecasting.
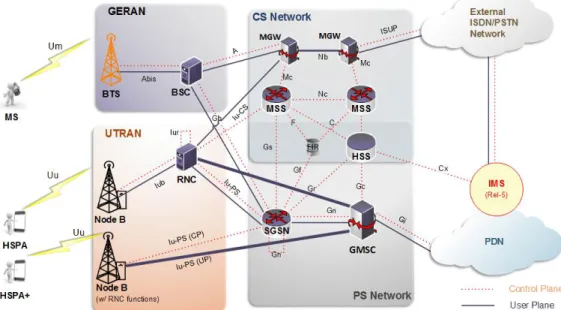
This study is aimed at UMTS networks, specifically the Radio Access Network (RAN), UTRAN in Figure 3.
3
Figure 3: UMTS (Rel. 5)
1.3.
Organization of the Dissertation
Besides this introductory chapter, this dissertation is organized in four main chapters:
Chapter 2 introduces the UMTS network architecture, network elements and interfaces. After this, introduces the standardized network management models and discusses the importance of KPIs and performance management. Finally, it describes the role of configuration management in a network management environment.
Chapter 3 studies classical methods used for forecasting. Starts to introduce some
important concepts for a better understand of the chapter and then follow a structure of the type, theoretical study followed by a practical analysis, for each model. Besides that, it also presents several concepts and techniques used to evaluate and support the methods.
Chapter 4 briefly introduces the forecast tool developed during the research and writing of this study. It is an important chapter that helps to recognize the origin of all the results analyzed in this document.
Chapter 5 presents a detailed analysis of the KPIs chosen to use in the prediction models. Furthermore, gives examples of the potential problems, how to analyze them and
4
2. Mobile Network
During this chapter the reader will be introduced to the UMTS architecture and its evolution, as well as the architecture of the most used network management standard models. Furthermore, it will be discussed the concept and importance of KPIs, Performance Management (PM) and Configuration Management (CM).
2.1. Mobile Network Evolution
Somewhere by the mid-90s [3] the words third generation were used to designate the mobile network under research by that time and quickly became a “buzzword” in this field.
In order to better understand the current state of the mobile networks, especially the UMTS architecture (aim of this dissertation), it is important to make a step-back in the history of the mobile networks and track from closely the evolution of them.
This is the purpose of this section, to give an overview on the evolution of the mobile networks generations (Gs) from the first mobile network generation (1G) in the late 70s [1], through the GSM or second generation, until the UMTS or third generation (3G).
Also, the LTE architecture (actual state of the mobile networks) is study here, to compare the differences and similarities with the older technologies, especially with third generation, focus of this work.
A discontinuity or change in the paradigm sets the change of generations. Figure 4shows some of the important changes between generations.
5
Figure 4: Mobile Generations
Digging a little bit in the architectures, the 3GPP organization has defined several hundred specifications categorized in releases. Table 1 lists some of the 3GPP standards defining the 3G operation and beyond [2], [5].
The last release that is considered to belonging to 3G is the release 7 (HSPA+), some literature, refers to this release as the 3.9G architecture. Further superior releases are considered LTE.
6
The last architecture release of 3GPP is the release 11 with functional freeze date including stable protocols in June 2013 [4] (last checkup: May 2014). More detailed information on the 3GPP releases can be found in [4].Release Freeze Date Features
99 Dec-99 WCDMA, TD-CDMA
4 Mar-01 All-IP core network, TD-SCDMA
5 Jun-02 HSDPA, IMS phase 1
6 Mar-05 HSUPA, IMS phase 2, MBMS
7 Dec-07 HSPA+ with MIMO, EDGE Evolution, IMS VCC 8 Dec-2008 OFDMA, MIMO, LTE, SAE, eNodeB, All-IP Network
9 Dec-2009 HeNB, SON, eMBMS
10 June-2011 Carrier aggregation(CA),enhanced inter-cell interference coordination (eICIC) , “HetNets”,etc
11 June-2013 Enhancements to CA, MIMO and elCIC, etc.
Table 1: 3GPP Releases
Adapted from “Wireless Mobile Evolution to 4G Network”, Mohammed Jaloun, Zouhair Guennoun
2.1.1. GSM Architecture
The mobile networks exploded by the beginning of the 90s with the GSM/2G networks and reach their cruise speed during the second half of the 90s. By the end of the 90s the mobile networks stopped to be a luxury and start to become a major daily need 116[1].
Figure 5: GSM Architecture
Figure 5 represents the GSM architecture where continuous dark line between Network Elements (NEs) represents the data plane and the orange dotted line represents the control plane.
The GSM architecture can be subdivided in three basic subsystems as Figure 5 illustrates:
A.
Mobile Station
Generally, the Mobile Station (MS) is the mobile equipment used by a subscriber to communicate with the GSM network. Some functions of the MS are:
7
- Speech to digital conversion to transmit to the BTS and digital to speech whenreceiving from the BTS. - Radio Signal encryption.
- Monitoring the signal quality from BTS and reporting this back.
B.
Base Station Subsystem
Base Transceiver Station (BTS) – Radio equipment (transceivers and antennas) needed to
provide the best coverage to a designated area and communicate with the MS through the radio interface. Some of the most important functions are:
- Conversion of radio waves into a digital signal to send to the BSC and digital signals into radio waves to send to the MS.
- Monitoring quality and levels of the radio waves and reports to the BSC.
Base Station Control (BSC) – The BSC has the responsibility of control all the BTS attached to it.
Some of the main functions are:
- Manage of radio resource allocation.
- Handover control taking into account the values from the BTS. - Power control.
C.
Core Network (CN)
The CN in GSM is in fact a Circuit Switched (CS) Core Network (CN), because even having slow speed data services these services are secondary due to the fact that it uses voice service resources. This fact will become clear later.
Mobile Switching Center (MSC) – The central element in the CS CN and its main task is to
control the services provided by the system. The major difference between a MSC and a normal switching center in a fixed network is that the MSC has additional functions such as:
- Call control and mobility management. - Gathering billing information.
- Location registration of MS. - Authentication.
8
- Handover procedures (e.g. change to other MSC).- Managing of radio resource allocation.
Visitor Location Register (VLR) – The VLR is a database containing information about the
current MSs in its area. A single VLR can be associated to one or more MSCs.
The information in VLR, unlike in the HLR, is dynamic. When a MS enters a MSC area and try to connect with the network, the MSC is informed of its arrival and its associated VLR is update. After this, a message is sent to the HLR informing that the VLR contains the location of the UE. Some of the data registered in the VLR are:
- Subscriber location.
- Identification numbers of the mobile subscribers. - Services that the subscriber can use.
- Security information for authentication purposes.
Gateway Mobile Switching Center (GMSC) – GMSC is an interface between the Home Public
Land Mobile Network and the external ones (e.g. PSTN), i.e. it works like a support to the incoming calls from an external network, e.g. when the external network is not cable to interrogate the HLR because of the different protocols.
The GMSC receives all the incoming calls (like a default gateway) and asks the HLR for the address the user whereabouts and then routes the call to the MSC that is currently serving that user. The GMSC can be seen as a variation of the MSC with more capabilities.
Home location Register (HLR) – It is a central database that keeps information about all the
subscribers within its network. The HLR holds:
- User identification, addressing and security information, i.e. network access control information for authentication and authorization.
- User location information at inter-system level.
- Handles the user registration, and stores inter-system location information. - User profile (ex. services).
Authentication Center (AuC) – The AuC cooperates closely with the HLR database, it is
responsible for:
- Encryption keys generation. - Identify the MS and the network.
- Regulate the integrity of the transmission.
Equipment Identity Register (EIR) – The EIR is database with a list of numbers identifying a
given mobile station for security purposes, e.g. to identify a stolen mobile or if it is causing problems in the network. The International Mobile Equipment Identity (IMEI) is used for this purpose.
9
Note that all the interfaces between the Network Elements (NEs) of the GSM architecture are represented in Figure 5. These interfaces determine certain rules for the communication between these NEs.The major problem of GSM is the transmission of data by the circuit switched technology which provides very low transmission rates. The protocols used in this type of transmission were the Circuit Switched Data (CSD) and High-Speed Circuit Switched Data (HSCSD) [1]. The charging scheme were independent of the amount of data transmitted thus becoming a major constraint to the success of data transmission.
Therefore, in the year 2000 the introduction of the General Packet Radio Service (GPRS) added the packet switched technology and “kick started” the delivery of Internet on mobile equipment. Later on, an advance in GSM radio access technology brought us the EDGE (Enhanced Data rates for Global Evolution) or Enhanced GPRS. The EDGE technology can be considered as the “almost 3G”.
Figure 6: GSM Architecture (GPRS)
The GPRS brought some modifications to the old GSM architecture. A new item called Packet Control Unit (PCU) was added to the BSC with the function to separate the CS traffic from the PS traffic. However the major modification were in the core network, where two new NEs were added (refer to Figure 6).
The new SGSN and GGSN form now the PS CN and handle the packet data transmission.
Serving GPRS Support Node (SGSN) – It is the connection point between Radio Access Network
(RAN) and PS CN and has a dynamic database which stores information about the current mobile station that is serving:
10
- Security information.- QoS. Also responsible for:
- Authentication.
- Mobility Management context (e.g. when a MS is PS attached, the SGSN keeps track of it to a Routing Area (RA) or specific cell).
Gateway GPRS Support Node (GGSN) – Provides the interface between the PLMN and external
packet switched networks:
- Packets arriving from an external network are routed to the respective SGSN by the GGSN.
- Packets from the mobile subscriber are routed to external networks by the GGSN.
Like SGSN the GGSN has a data base that stores information about the mobile subscriber: - QoS negotiated.
- Charging information.
- Address of the SGSN serving the user.
2.1.2. UMTS Architecture
This chapter is the continuity of a history about the evolution of the mobile networks. Thus, the proper understand of this chapter is strongly dependent of the previous chapter (2.1.1 GSM
Architecture
)
.Back to the mobile networks evolution, the next big modifications were done at a radio access level, when by mid-2001 [1] the first commercial radio access technology based on Wideband Code Multiple Access (WCDMA) start. The first UMTS/3G releases (release 99) has been commercial initiated.
2.1.2.1. Release 4
Release 4 brought the packet transmission technology to the PS CN making the UMTS get close to its initial “dream”, reach an all-IP approach.
More efficient transport options and higher switching efficiency allowed new and lower cost services. Now the calls started to be transmitted through the MGW (refer to Figure 7) without need to be routed to the MSC Server site.
The separation of the control plane from the user plane facilitates the allocation of more efficient bearer services and with different characteristics. This architecture also simplifies the convergence with the packet switched domain.
11
As a result of these modification the old MSC, VLR and GMSC NEs were replaced by the new MSC Server (MSS), GMSC Server and MGW NEs.Figure 7: UMTS (Rel-5) Architecture
2.1.2.2. Release 5
Release 5 (Figure 7) has brought the IP Multimedia Subsystem (IMS) to the CN side and the High Speed Downlink Packet Access (HSDPA) protocol to the radio access side. Besides these modifications, the HLR and AuC were merged into one master database, the Home Subscriber Server (HSS).
2.1.2.2.1. IP Multimedia Subsystem
The IP Multimedia Subsystem (IMS) provides the possibility to set up multimedia sessions by means of the Session Initiated Protocol (SIP) for provision of multimedia services.
The IP Multimedia Core Network (IM CN) subsystem should enable the convergence, and access to, voice, video, messaging and web-based technologies for the wireless user, and combine the growth of the internet with the growth in mobile communications.
12
Figure 8: IMS Architecture
Figure 8 represents a simple overview of IMS architecture (3GPP standard). This overview represents the most relevant entities, functions and interfaces. The objective of this work is not a detailed study about the IMS. For more information, refer to 3GPP TS 23.002.
Most vendors follow the standardized IMS architecture although it is possible to find nodes implementing more than one function and functions distributed over more than one node [7].
A. Call Session Control Function (CSCF)
Three important CSCFs will be discussed: Proxy-CSCF, Serving-CSCF and Interrogating-CSCF. Each of the CSCFs have their special tasks, the most important are described next.
P-CSCF – The Proxy-Call Session Control Function (P-CSCF) is the first point of contact between
the IMS UE and the IMS network. This means that all SIP signaling traffic from UE will be sent through the P-CSCF and vice-versa.
S-CSCF – Serving-Call Session Control Function (S-CSCF) is the central node of the signaling
plane and it is responsible for registration processes, routing decision and service profile storing.
I-CSCF – The Interrogating-Call Session Control Function (I-CSCF) is a contact point between a
subscriber and its operator’s network.
B. Databases
Two databases are part of the IMS subsystem: the Home Subscriber Server (HSS) and the Subscription Locator Function (SLF).
HSS – Has mentioned earlier in 2.1.2.2 Release 5 the Home Subscriber Server (HSS) is the merging between the Home Location Register (HLR) and Authentication Center (AuC) in a single database. The functions of the HLR and AuC are described in 2.1.1GSM Architecture.
13
In addition to the functions required by PS and CS domains, the HSS stores data related with all IMS subscribers and services. The most important data includes [8]:- User’s identities.
- Registration Information. - Access Parameters.
SLF – The Subscription Locator Function (SLF) is a support function that allows the I-CSCF and
S-CSCF to find the address of the HSS that holds information data for a given subscriber when architecture of multiple and separately HSSs have been deployed by the network operator.
C. MRFC & MRFP (Service Functions)
The Service functions, also known as Media Resource Functions (MRF), provides the home network with a source of media and the ability for mix media streams (e.g. centralized conference bridge), media analysis, etc. These service functions are divided into a signaling plane – the Media Resource Function Controller (MRFC) and a media plane – the Media Resource Function
Processor (MRFP).
2.1.2.2.2. HSDPA
As stated before, release 5 has introduced the HSDPA. HSDPA is a packet based data service which includes techniques such as:
- Hybrid Automatic Repeat Request (H-ARQ): Having a fast error correction make the
transmission delay, due to errors, decrease.
- Improvements in the resource management: Addition of High Speed Downlink
Shared CHannel (HS-DSCH) with Adaptive Modulation Coding (AMC) and multi-code operation and short Transmission Time Interval (TTI)
- Fast scheduling: Moving the scheduling to the Node B (MAC-HS) enables a more
efficient implementation of scheduling by allowing the scheduler to work with the most recent channel information. The scheduler can adapt the modulation to better match the current channel conditions and fading environment.
The goal of the implementation of these techniques is to increase throughput, reduce delay and achieve higher peak rates. A good aspect of the implementation of HSDPA on existing 3GPP systems is that it was a low-cost investment once in some cases was just a software upgrade. For more details on HSDPA refer to [9], [10] and [11].
14
2.1.2.3. Release 6
Later on, release 6 brought improvements to the IMS (CN side), the capability of interworking with WLANs (CN and radio access sides) and the High Speed Uplink Packet Access (HSUPA) technology in the radio access side.
2.1.2.3.1. HSUPA
The High Speed Uplink Packet Access (HSUPA) system is in fact a new uplink transport channel, the Enhanced Dedicated CHannel (E-DCH), which brought some of the same features to the uplink as the HSDPA with its new transport channel (HS-DSCH).
The E-DCH supports fast Node B based scheduling, fast physical H-ARQ and shorter TTI. Though, unlike in HSDPA the E-DCH is not a shared channel, but a dedicated one (i.e. each UE has its own dedicated E-DCH data path to the Node B that is continuous and independent from the others UEs [11].
Similarly to HSDPA technology, the HSUPA is inexpensive because it is based in software updates. For more details on this matter refer to [11].
2.1.2.4. Release 7
These last developments from the last releases (Rel-5 and Rel-6) brought improvements to the radio network side, and so did the emerging of release 7 that introduced the HSPA and HSPA+ technologies to the radio access network side.
15
2.1.2.4.1. HSPA & HSPA+
The High Speed Packet Access (HSPA) is an upgrade to the WCDMA networks that increases the packet data transmission performance. The HSPA is the result of HSDPA and HSUPA
combination. HSPA is a radio access network improvement which is associated with the PS CN enhancement (RNC – GGSN direct tunneling) [1].
The HSPA+ brought by release 7 is an evolution of the HSPA. New functions were added, such as: higher order modulation as well as Multiple Input Multiple Output (MIMO), used only in downlink. To learn more about HSPA and HSPA+ refer to [11] and [7].
Thus, release 7 becomes the launching pad to a new generation of mobile networks, the Long Term Evolution or 4G networks.
2.1.3. LTE Architecture
The Evolved Universal Terrestrial Radio Access Network (E-UTRAN) is the radio access part to an Evolved Packet Core (EPC).
Figure 10: LTE (Release 8) Architecture
2.1.3.1.
E-UTRAN
In the radio access part it is possible to see that, like in the HSPA+, the olds (BTS - BSC) and (Node-B - RNC) functions have been merged into one NE
–
the eNodeB. Essentially, the E-UTRAN is a network created only by eNodeBs, with no centralized controllers interconnected between them. The eNodeBs are connected to the core network over the S1 interface as you can see in Figure 10.The new access solution is based in Orthogonal Frequency-Division Multiplexing (OFDM) that combined with spatial multiplexing (i.e. multiple antennas), high order modulation (up to 64QAM) [7] and large bandwidths, can achieve high data rates.
16
The MAC protocol layer level which is responsible for scheduling is now represented only in the UE and eNodeB leading to fast communication and decisions between them. In UMTS the MAC protocol and scheduling, is located in the RNC and when HSDPA was introduced an additional MAC sub-layer, responsible for HSPA scheduling, was added in Node-B.The eNodeB is responsible for the follow Control Plane (CP) functions [14]:
- Radio Bearer Management – Includes radio bearer setup and release and also
involves Radio Resource Management (RRM) functionalities for initial admission control and bearer allocation. These functions are controlled by the MME through the S1 interface during session setup, release and modification phases.
- Radio interface transmission and reception – Includes radio channel
modulation/demodulation as well as radio channel coding/decoding.
- Uplink and downlink Dynamic RRM and data scheduling – The most serious
function, because the eNodeB as to be able to multiplex different data flows over the radio interface using the available resources and in the most efficient way.
- Mobility Management – UE mobility handling while the terminal is in the active state.
Handover algorithms for mobility decision and target cell determination.
- User data IP header compression and encryption – Used to maintain privacy over
the radio interface and transmit IP packets in the most efficient way.
2.1.3.2. EPC
The Evolved Packet Core (EPC) is purely IP based, i.e. both real time and data services will be carried by IP protocol. The IP address is allocated when the mobile switches on and released when the mobile switches off [13].
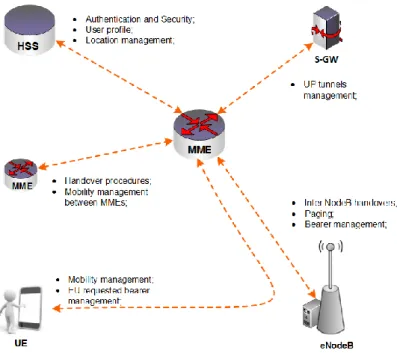
2.1.3.2.1. MME
The Mobility Management Entity (MME) is the NE responsible for all CP functions related to subscriber and session management. MME establishes a direct CP path between itself and the UE which is used as primary control channel between network and UE (see Figure 11).
17
Figure 11: MME logical connections and main Control Functions
Adapted from “A tutorial on LTE Evolved UTRAN (EUTRAN) and LTE Self Organizing Networks”, Dhruv Sunil Shah
The main functions of the MME are: the following:
- Resource allocation and authentication – Provide additional security to the UE,
assigning to each UE a temporary identity, Globally Unique Temporary Identity (GUTI) [14].
- Tracking area list management – MME tracks the UEs presented in its area. If the
UE is connected it tracks its location to an eNodeB level. If it is in idle mode tracks its location to a Tracking Area (TA) level.
- Handover procedures – Takes part on the control signaling for handover of an active
mode UE between MMEs, S-GWs and eNodeBs.
- Bearer management
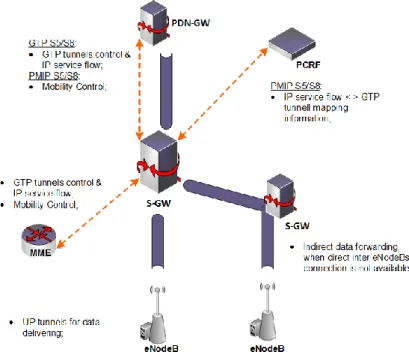
2.1.3.2.2. S-GW
The Serving Gateway (S-GW) it is not too involved with the CP operations but more concerned with the User Plane (UP) tunnel management. S-GW can use or GPRS Tunneling Protocol (GTP) or Proxy Mobile IPv6 (PMIP) tunnels for data flow depending on the data bearer setup (refer to Figure 12).
The S-GW only controls its own resources and based on the requests from PDN-GW, MME or PCRF.
18
Figure 12: S-GW logical connections and functions
Adapted from “A tutorial on LTE Evolved UTRAN (EUTRAN) and LTE Self Organizing Networks”, Dhruv Sunil Shah
2.1.3.2.3. PDN-GW
The PDN GW is the gateway which terminates the SGi interface towards the Packet Data Network (PDN). The PDN-GW assigns an IP address to the UE which uses it to communicate with the external network and also performs the Dynamic Host Configuration Protocol (DHCP)
functionality [14].
Each PDN-GW may be connected to several PCRFs, S-GW and external networks. If a UE is accessing more than one PDN, there may be more than one PDN-GW for that UE.
Figure 13: PDN-GW logical connection and main functions
19
2.1.3.2.4. PCRF
The Policy and Charging Rules Function (PCRF) is the policy and charging control element of service data flows and IP bearer services.
Its decisions on how to handle the services are made based on the Quality of Service (QoS) and then send information to the PDN-GW and, if applicable, the S-GW can setup the appropriate bearers and policing (refer to Figure 14). Then the EPC bearers are set up based on those.
Figure 14: PCRF main functions
Adapted from “A tutorial on LTE Evolved UTRAN (EUTRAN) and LTE Self Organizing Networks”, Dhruv Sunil Shah
LTE advanced describes future LTE releases and its focus is on higher order capacity, using various techniques such as carrier aggregation, relay nodes, etc. But once the LTE advanced is not the aim architecture of this work no more will be discussed on this topic. For more detail on the LTE advanced refer to [15] and [7].
2.2. Network Management
The usage of computer based Operation Support System (OSS) started long before the emergence of the mobile network, beginning in 1960’s and 1970’s in the Bell System [17]. In those early days there were few applications that worth enough to justify the high costs of software and hardware, so the OSS were mainly to support paper based operations.
The reduction costs of the OSSs and high performance of operations made the OSS become a decisive NE in the network business platform.
Later on during the 90’s, the massive usage of personal computers and the beginning of the mobile technologies were decisive in the evolution and reaching of the OSSs current state.
Network management is concerned with operation, maintenance, provision and administration of network systems. Operation is concerned with keeping the network and its services running with the minimum impact on the user experience. Maintenance is concerned with the state of the NEs (need for upgrades or repair). Provision is related to facilitate service requirements by means of network configuration. Finally, administration is concerned with network control.
20
2.2.1. Network Management Models
The network developments coupled with the introduction of new technologies and services in a possible multi-vendor environment required improvements regarding to network management. This, as consequence, made that different standardization organizations tried to develop a common network management model.
2.2.1.1. OSI NMM
One possible solution, and the most well-known, is the Open Systems Interconnection (OSI) Network Management Model (NMM) introduced by the International Standardization Organization (ISO).
There are three main components that need to be present in the elements of the management architecture in order to support a successful implementation of the OSI NMM [21], [1]:
- A functional component concerned with the activities performed in support of network management.
- A communication component focused in the matter of how the information is exchanged between the managed systems.
- An information component concerned with the management of the five major IT functional areas – Fault, Configuration, Accounting, Performance and Security management
(FCAPS) – which provide rapid and consistent progress within each individual areas. Although the ITU-T initially developed the concept of FCAPS it was in fact the ISO who applied the concept to data networks [33]. So the ISO model introduces the FCAPS functional areas as [20], [21]:
Fault Management (F)
Recognizing a problem in the telecommunication network is the first step in Fault
Management. To have an effective fault management it is require detection, recognition, isolation and correction of faults that occurs in the network.
Configuration Management (C)
Monitor and configure NEs. Responsible of various functions such as: identify, exercise control over and collect data from NEs and provide configuration data to the various hardware and
software versions of network elements (more detailed functions, refer to [20]).
Accounting Management (A)
This functional area is concerned with the collect of user usage statistics. These statistics can be controlled and improve the fairness of the network access and thus minimize network problems. Some important functions are [20]:
- Usage measurement.
21
- Collection and finance – Receive payments, informs the user of payment dates, etc.
- Enterprise control – Supports the enterprise financial responsibilities.
Performance Management (P)
Evaluate and report about the behavior of telecommunication equipment and the effectiveness of the network or network element (NE). Gathers and analyze statistical data with the purpose of monitor and correct the behavior and effectiveness of the network, NE and/or other equipment. Moreover, assists in planning, provision and maintenance and quality measurement. The next functions are included in the performance management functional area [20]:
- Performance quality assurance – Includes quality measurements such as performance
goals.
- Performance monitoring – Responsible for continuous collection of data concerning with
NE performance.
- Performance management control – Includes setting thresholds and data analysis
algorithms. It has no effect on the managed network.
- Performance analysis – Processing and analysis of collected performance records.
Security management (S)
Security management consists of two different areas:
- Security services for communications such as authentication, access control, data confidentiality, data integrity, etc. In addition a set of security mechanisms (e.g. event detection, security audit-trail management and security recovery) applicable to any communication are defined.
- Security event detection and reporting activities that may resides in a security violation (unauthorized user, physical tampering with equipment).
2.2.1.2. Telecommunication Management Network
The Telecommunication Management Network (TMN) has been defined by the ITU-T (International Telecommunication Union-Telecom Standardization) and has become the most widely used Network Management model and the main reference to the network management solutions providers.
The common requirements of the TMN is to support the network operator to manage (planning, maintenance, etc.) its network and services. Conceptually a TMN network interfaces different points of a telecommunication network to exchange information and control their operation. Thus, the TMN concept is to provide an organized architecture, with standardized interfaces, capable of interconnect various Operations Systems (OSs) and/or Network Elements (NEs) for exchange management information and to provide the network operator with access to the management information. The TMN includes a Data Communication Network (DCN) in charge of management traffic and so freeing the network from the management traffic.
Figure 15 illustrates in a very elementary way the relationship between the TMN network and telecommunication network managed by it.
22
Figure 15: TMN and a telecommunication network
Source: “Principles for a telecommunications management network”, ITU-T Recommendation M.3010 (2000)
2.2.1.2.1. Functional architecture
The TMN functional architecture is a framework of the management functionality. The functional architecture is constituted by the next elements:
- Function Blocks.
- Management Applications Functions (MAFs).
- TMN Management Function Sets and TMN Management Functions. - Reference points.
Although all the above elements belong to the functional architecture, this document only discusses the function blocks and reference points. For more detailed information in all these elements please refer to [18].
2.2.1.2.1.1. Function blocks
Figure 16 illustrates the different types of TMN function blocks. Some of this function blocks can be partially in and partially out of a TMN as indicated in the figure.
23
Figure 16: Function blocks
Source: “Principles for a telecommunications management network”, ITU-T Recommendation M.3010 (2000)
Operation System Function (OSF)
The OSF block can be seen as the telecommunication manager function, i.e. processes the management information with the purpose of monitoring and control the telecommunication functions.
Network Element Function (NEF)
Communicates with the TMN with the purpose of be monitored, i.e. the NEF includes the telecommunication functions that need to be managed. Generally, the NEF function is the communication between Network Elements (NEs). These NEs constitute the network being monitored.
The NEF function has two parts, the one that perform telecommunication functions that doesn’t count as part of the TMN (i.e. the NE) and the one that provides this representation in support of the TMN that is part of the TMN itself.
Workstation Function (WSF)
The WSF block translates between a TMN reference point and a non-TMN reference point (e.g. user), i.e. it provides the interface with the human user. As a result, a portion of this block is outside the TMN boundaries.
Transformation Function (TF)
The purpose of the TF block is to connect two entities with incompatible mechanisms of communication (e.g. different protocols). There are several circumstances in which the TF block is necessary [18]:
- Connect functional blocks with standardized, but different communication mechanisms within a TMN.
24
- Connect different TMN and non-TMN environments (at the boundaries).2.2.1.2.1.2. Reference points
Reference point is a very important concept because it represents all the abilities that a determined function block is seeking from another function blocks. It also represents all the operation and/or notification that a function block can provide to a requesting function block. Generally speaking, a reference point defines one of several external views of functionality of a function block.
A TMN reference point only corresponds to a physical interface when the function blocks are implemented in different physical blocks.
Classes of reference points
- q class: between OSF, TF and NEF.
- f class: between OSF and WSF.
- x class: between OSFs of two different TMNs or between the OSF of a TMN and an entity
equivalent to an OSF functionality of another network.
- g class: between WSF and users (non-TMN reference point).
Figure 17 illustrates all the possible pairs of function blocks associated via reference points [18].
25
2.2.1.2.1.3. TMN logical layered architecture
A relevant aspect of the TMN architecture is the concept of layers. The TMN architecture has a strong relationship to the OSI standards and frameworks, thus the network management is grouped into functional areas such as FCAPS. In addition a Logical Layered Architecture (LLA) consists of five management layers.
Figure 18 illustrates the widely accepted layering, and the relationship between them. Each layer is responsible to provide the appropriate FCAPS functionality according to the layer definition. Each layer communicates with the layer above and below it.
Figure 18: TMN logical layers
Source: “Network Management: Accounting and Performance Strategies”, Benoit Claise, Cisco, June 2007
Element management layer
The Element Management Layer (EML) manages each NE on an individual or group basis. The EML can be constituted by one or more OSF elements that are individually responsible for a subset of network element functions.
The EML is responsible for the following functions [18]:
- Control and coordinate NEs in an individual NEF basis. Here, the OSFs support the interaction between NML and EML by processing the information to be exchanged between network OSFs and individual NEFs. OSF elements should provide full access to NE functionality.
26
Network management layerThe Network Management Layer (NML) has the responsibility to manage the network with the support of the EML. In this layer a more wide-ranging view and management of the network is considered, i.e., a wide geographical area is managed. Complete visibility of the whole network is typical and a technological independent view will be provided by the SML.
The following roles are the main duty of the NML [18]: - Control and coordinate the NEs within its scope. - Maintain the network capabilities.
- Provision, ceasing or modification of network capabilities to provide a service to the costumer.
- Maintain important data (e.g. statistical) about the network within its scope and work with the SML on performance, usage, availability, etc.
The NML provides functionality to manage and control and support the network demands made by the SML. The NML knows the available resources, how to control them, how these are related and geographical allocated. Furthermore, this layer is responsible for the network
performance and must control the network capabilities and capacity to achieve the best results of accessibility and QoS.
Service management layer
The Service Management Layer (SML) is concerned with the contractual aspects of services provided to the customers.
Principal roles of SML [18]:
- Customer facing2 and interfacing with other Public Telecommunication Operators (PTO). - Interaction with service providers.
- Interaction between services.
Business management layer
The Business Management Layer (BML) is part of the overall enterprise management. While the service and network management layers are the optimal utilization of the network resources, the business management layer is the optimal investment and use of new resources.
The main roles of the BML are [18]:
- Support of the decision process for the optimal investment and use of new resources.
- Support the management of Operation, Administration and Maintenance (OA&M) budget.
- Support the supply and demand of OA&M related manpower.
- Maintain aggregate data about the total enterprise.
2
Facing is the point of contact with the customers for all service transaction including service provision/cessation, accounts, QOS, fault reporting, etc.
27
2.2.1.2.2. Physical Architecture
So far, this document has discussed the TMN functional architecture. However TMN also defines a physical architecture. The TMN physical architecture shows how the TMN functions described in the functional architecture can be implemented into physical equipment.
Figure 19: TMN related architectures
The physical architecture shows how the function blocks should be mapped upon building blocks (physical equipment) and reference points upon interfaces (refer to Figure 20). Note that a building block can map multiple function blocks and a function block may contain multiple functional components.
28
Building blocks always implement the function blocks of the same name, e.g. NetworkElement (NE) implements the Network Element Function (NEF).
As already mentioned, it is possible to implement multiple function blocks into a single building block, e.g. the Operations System (OS) building block may implement multiple OSFs, but may also be used to implement an OSF, MF, and WSF. The name of the building block is determined by the mandatory function block. Table 2 shows which function blocks can be mapped to which building blocks [18][19]
[19]
.NEF MF QAF OSF WSF
M- mandatory O- Optional
O*- may only be present if OSF or MF is also present.
NE M O O O O* MD M O O O QA M OS O O M O WS M DCN
Table 2: Mapping function blocks into building blocks
A special building block is the Data Communication Network (DCN) that doesn't implement a function block as the others building blocks. In fact, the DCN is used by the other building blocks to exchange information, i.e. it acts as a transport network.
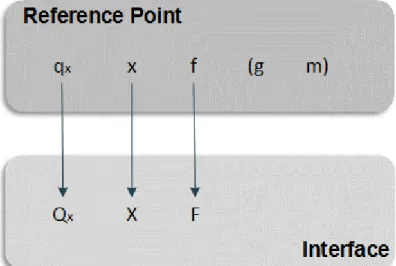
Interfaces
Interfaces are related to the physical implementation of the reference points. Normally reference points and interfaces have one to one mapping and the name of the interfaces are the same as the related reference point but in capital letters. Some reference points do not have associated interfaces, such as:
- Reference points that interconnect function blocks inside a single block.
- Reference points lying outside the TMN (e.g. m and g, refer to
- Figure 21 ). Implementation of these reference points are outside of the TMN scope.


![Figure 17 illustrates all the possible pairs of function blocks associated via reference points [18]](https://thumb-eu.123doks.com/thumbv2/123dok_br/15883073.1089507/44.892.121.751.752.1079/figure-illustrates-possible-function-blocks-associated-reference-points.webp)