A Work Project, presented as part of the requirements for the Award of a Masters Degree in Finance from the NOVA – School of Business and Economics.
WHAT IS THE BEST ACCOUNTING METHOD FOR FINANCIAL ASSETS?
FRANCISCO ALBINO DE CARVALHO STUDENT NUMBER: 16000365
A Project carried out on the Finance course, under the supervision of:
PROFESSOR CLÁUDIO PAIS
2
What is the best accounting method for financial assets? 1
Abstract
The possibility to fulfill the lack of studies comparing methods for financial assets accounting at fair value in terms of value relevance for investors is the main contribution of this research. Such contribution is emphasized by the importance of assessing how well accounting amounts reflect information used by investors. This study compares available for sale financial assets with financial assets at fair value through profit or loss in terms of value relevance for investors. The results evidence that although accounting differently both methods provide equally strong explanatory power of security prices which favors fair value accounting.
Keywords: financial assets accounting, value relevance, available for sale, fair value
through profit or loss.
1
Dedication: I would like to dedicate this work project to my grandfather José
Francisco Albino Júnior, a very important person to my development as a student but also as individual. You will always be missed and I will cherish the good memories we had.
3
1. Introduction
This study compares accounting methods in terms of value relevance for the investors, which is a key issue for the standard setters, but also for the users of financial statements seeking relevant and reliable accounting information. The absence of any value relevance literature comparing methods for financial assets accounting at fair value enhances the suitability but also the contribution of the present study.
One of the major challenges for standard setters lies in assessing how well accounting amounts reflect the information used by equity investors. Moreover, the fact that “financial markets have become more complex over the years and the permanent requirement of changing rules by accounting standards, increases the importance of accounting research to make a substantive contribution in addressing questions relevant to standard setting” (Barth, 2001), which consists of my main motivation for the execution of this study.
The accounting of financial assets is not a simple matter that involves only a single method. There are, in fact, four different methods for financial assets accounting under the International Accounting Standard (IAS 39) Financial instruments recognition and measurement. Financial assets can be classified as financial assets at fair value through profit or loss (FVTPL), loans and receivables, held-to-maturity investments, and available for sale financial assets (AFS). In this study I focused only on the comparison of financial assets accounting methods which are measured under fair value accounting (FVA) contrasting with the alternative historical cost accounting (HCA). Thus, only the FVTPL and the AFS financial assets accounting methods have been considered in this study.
4 By definition, while FVTPL consist of financial assets that are solely held for the purpose of selling in the near future, the AFS correspond to financial assets that are not included in any of the other possible categories.
Despite the existence of two distinct methods, it is important to highlight that both methods are measured using FVA.
The financial crisis of 2007-2009 has caused a strong debate about FVA. Opponents of FVA claim that the beginning of FVA and the deregulation of financial markets have been the cause behind the financial crisis, while the “proponents of FVA claim that if it had not been for FVA, the crisis would have surfaced much later with even more devastating results” (Laux and Leuz, 2010). In Europe, while the IASB wants to expand FVA, there are a lot of political authorities defending its abolishment.
The truth is that in spite of all the controversy about the use of fair value, the existent value relevance literature (e.g. Barth, 1994; Ahmed and Takeda, 1995), provides more explanatory power of security prices with the FVA than historical cost.
Following the results of the previous value relevance studies, my second motivation for this study is the possibility of analyzing if in fact, as suggested by previous literature, both the methods provide strong explanatory power of security prices.
Although both methods are accounted at FVA, gains and losses are accounted differently. Under IAS 39, while the FVTPL gains and losses are included in the income statement, the AFS gains and losses are included on the balance sheet under shareholders' equity.
The goal of this study is to provide a better understanding of how investors incorporate such accounting differences, by comparing empirically the two methods in order to understand which of the two relates better with security prices.
5 The results show that both methods provide equally strong explanatory power of security prices.
The remainder of this study is organized as follows. Section 2 includes a review of the previous literature; section 3 presents the research design which includes a short description of the data used in my study and its main properties are presented in section 4. Section 5 provides a discussion of the empirical results, and the last section the final conclusions.
2. Literature review
2.1. Institutional Background
The institutional background for this study was essentially based on IAS 39 Financial instruments recognition and measurement (this standard is going to be replaced by IFRS 9 Financial instruments for the periods starting on or after 1 of January of 2015) but it was also complemented with IAS 32 Financial instruments: presentation and IFRS 7 Financial instruments: disclosures.
According to the IAS 32, we can define financial instruments as a contract that gives rise to a financial liability or equity instrument of one entity and a financial asset of another entity. The financial asset is also defined, according to IAS 32, as any asset classified as cash, an equity instrument of another entity or a contractual right.
Contractual rights are defined by the same standard as the right to receive cash, another financial asset from another entity, or to exchange financial assets or financial liabilities with another entity under conditions that are potentially favorable to the entity or a contract that will or may be settled in the entity's own equity instruments.
6 According to IAS 39, financial assets are required to be classified in one of the following categories: Financial assets at FVTPL, loans and receivables, held-to-maturity investments, and AFS financial assets. A short description of these categories is presented in Table 1.
Table 1: Short description of the financial assets categories and its valuation under
IAS 39 Categories Valuation Fin an cial asset s
Fair-value gains and losses reported in the income statement
Trading assets Fair-value gains and losses reported in the income statement Designated at
fair-value
Held-to-maturity Amortized cost
Loans and advances Amortized cost
Available-for-sale Fair-value gains and
losses are reported in shareholder’s equity Adapted: Overview of classification and valuation of financial assets under IAS 39 (Bout et al, 2010 cited by Stol, 2010)
In this study we will only compare the FVTPL and AFS categories, which are defined, according IAS 39, as follows:
A- FVTPL includes all derivatives (except those designated hedging instruments) and financial assets acquired or held for the purpose of selling in the short-run or for which there is a recent pattern of short-term profit taking are held for trading. [IAS 39.9]. Moreover FVTPL can be also include any financial asset that is designated on initial recognition as one to be measured at fair value with fair value changes in profit or loss.
B- AFS financial assets are any non-derivative financial assets designated on initial recognition as AFS or any other instruments that are not classified as (a) loans and
7 receivables, (b) held-to-maturity investments or (c) financial assets at FVTPL [IAS 39.9]. AFS assets are measured at fair value in the balance sheet. Fair value changes on AFS assets are recognized directly in equity, through the statement of changes in equity, except for interest on AFS assets (which is recognized in income on an effective yield basis), impairment losses and (for interest-bearing AFS debt instruments) foreign exchange gains or losses. The cumulative gain or loss that was recognized in equity is recognized in profit or loss when an available-for-sale financial asset is derecognized [IAS 39.55(b)].
According to IAS 39, the financial assets categories are used to determine how a particular financial asset is measured in the financial statements. Comparing the two accounting methods we can divide its measurement and recognition in three phases: initial recognition, subsequent measurement and derecognition.
The allocation of financial assets measurement and recognition by the three phases is presented in Table 2.
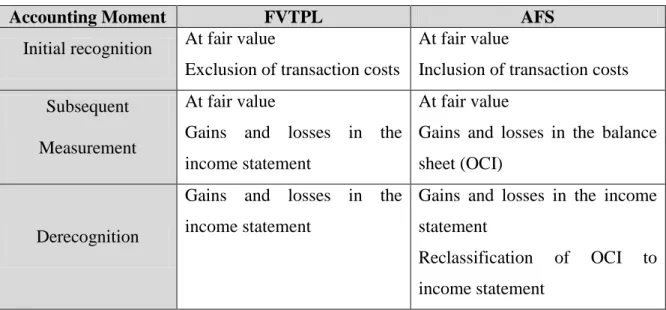
Table 2: Measurement and recognition of the financial assets categories under IAS 39
Accounting Moment FVTPL AFS
Initial recognition At fair value
Exclusion of transaction costs
At fair value
Inclusion of transaction costs Subsequent
Measurement
At fair value
Gains and losses in the income statement
At fair value
Gains and losses in the balance sheet (OCI)
Derecognition
Gains and losses in the income statement
Gains and losses in the income statement
Reclassification of OCI to income statement
8 In the initial recognition stage financial assets are measured at FVA and transaction costs are included in the initial carrying value of financial assets unless they are carried at FVTPL when the transaction costs are recognized in the income statement.
The subsequent measurement of the two accounting methods is made also at FVA, but while at FVTPL the gains and losses related with changes in the carrying amount are reported at the income statement, the gains and losses on available-for-sale financial assets are reported in the balance sheet as equity (other comprehensive income).
In derecognition if, for example, a financial asset is sold while at fair value through profit and loss, the gain and loss is recognized at the profit and loss statement, in the case of available-for- sale financial assets, the cumulative gains or losses are reclassified from other comprehensive income to the income statement.
2.2. Previous Research
As previously stated, the main goal of this study is to compare two financial assets accounting methods in terms of value relevance for investors. Therefore, it is important to first understand what has been researched so far about financial assets value. Furthermore, since both financial assets accounting methods imply using FVA instead of HCA, it is also important to briefly discuss the FVA debate.
In fact, there are a diversity of studies that focused on these two issues over the years, see, for instance, Barth (1994), Ahmed and Takeda (1995), Laux and Leuz (2010) and Procházka (2011).
Barth (1994) investigates how disclosed FVA of banks investment securities and also how the correspondent securities’ gains and losses based on those estimates are reflected in share prices in comparison with HCA. Barth found that investment
9 securities’ fair values have explanatory power beyond HCA. In addition, fair value securities’ gains and losses seem to be relevant to investors, nevertheless they are estimated with sufficient error to make value-relevance difficult to establish. According to Barth, the difficulties in value relevance establishment can be related with errors in estimating fair values being too large, but also with the fact that security gains and losses are offset by unrecognized gains and losses (URGL) in other assets and liabilities. The evidence from supplemental analysis in the same study shows that the estimation error is the more plausible of the two and how the interpretation of such estimation error is particularly important to the FVA debate.
Ahmed and Takeda (1995) focused more on gains and losses than specifically on investment securities. They provide extended research to prior studies about how investors are valuing URGL but also realized gains and losses (RGL) on investment securities. This issue is particular important in order to provide evidence about the valuation of URGL being relevant for the market value accounting debate but also to provide some insights into how investors incorporates the managerial discretion over accounting choices. The results revealed that after controlling, the change in URGL has a significant positive effect on bank stock returns in normal periods, but in periods of low capital and earnings the coefficient on RGL is significantly lower, which reflects how investors incorporate the possibility of managerial discretion in such periods. Laux and Leuz (2010) focused on the criticism to FVA after the financial crisis of 2007-2009. The opponents of FVA insist in the belief that it accelerated the financial crisis and significantly worsened the impact on affected companies. In their research they stated that in spite of some limitations, FVA is better than HCA. In order to resolve such limitations, they defend that the details of the FVA implementation could be
10 further improved. However, standard setters face many problematic issues. First, relaxing FVA rules in times of crisis, can led to manipulation, affecting negatively the reliability of the accounting information. Second, even if FVA were to contribute to the “domino effect” in the financial crisis, these negative effects have to be weighed against the positive effects of timely loss recognition. When banks are forced to write down the value of assets as losses occur, they have incentives to take prompt remedial action which ultimately reduces the severity of a crisis.
The final conclusion of their research was that, it may be more appropriate to settle down regulatory capital constraints in a crisis than to modify the accounting standards, as the latter could hurt transparency and market discipline.
Procházka (2011) also discussed the exacerbation of the FVA debate after the recent financial crisis. His study states that FVA was not responsible for the financial crisis, on the contrary, the recent financial crisis helped realize how an important tool FVA is to distinguish companies in terms of financial health.
Moreover, from an economic point of view, only current and market-based value is relevant for the decision-making of the users of financial statements. Thus, in terms of relevance, FVA is superior to HCA.
However, it was also emphasized that financial instruments are measured by three hierarchical levels, and the valuation of Level 3 positions is based on models with unobservable market inputs. The resulting fair values are subjective and difficult to verify. During the financial crisis, markets of certain financial instruments have become illiquid, and as a result, in spite of being efficient in terms of relevance, FVA faces some reliability issues.
11 The study concludes that it is difficult to define a solid set of principles for the measurement in financial reporting, which would ensure absolute economic reality in the financial statements. However, the financial crisis cannot be a reason for the abolishment of FVA.
3. Research Design
The fundamental research question addressed in this study is: “What is the best accounting method for financial assets?
In order to answer such research question, I used two different models, which regress market value of equity on each of the two financial assets accounting methods and on other accounting data using empirical variations of the Ohlson Model (Ohlson, 1995; Feltham and Ohlson, 1995), which is the usual benchmark model for explaining share prices with accounting data.
The Ohlson Model is,
where P is the security price on December 31, BVE is the book value of equity, and NI is the Net Income. The subscripts i and t identify firm and year, respectively.
In models 1 and 2, presented below, instead of the book value of equity, I decomposed this variable into “Total Assets – Liabilities” in order to remove from total assets the effect of the carrying amounts of FVTPL and AFS in each of the models respectively. Moreover, I used year fixed effect dummy variables; firm fixed effects dummy variables were not included given the size of the sample used.
12
Model 1:
Model 2:
where P is the security price on December 31, AbFVTPL is the value of total assets before financial assets at fair value through profit or loss, AbAFS is the value of total assets minus available for sale financial assets, FVTPL is the value of financial assets at fair value through profit or loss, AFS is available for sale financial assets, L is the total liabilities and NI is the Net Income. The subscripts i and t identify firm and year, respectively.
Since both methods are measured at FVA and previous literature suggest a strong explanatory power of share prices by financial assets at FVA (e.g. Barth, 1994; Ahmed and Takeda, 1995), I expect both (in model 1 and model 2) coefficients to be statistically significant.
The research question is answered comparing the two models using the Vuong test (Vuong, 1989). A short description of the Vuong test is provided in Appendix 1.
The Vuong test commonly used (e.g. Dechow, 1994) corresponds to a likelihood ratio test for model selection without assuming under the null hypothesis that either model is “true”. This allows for a directional test indicating which of the competing hypothesis, if any, is closer to explaining the share price. Intuitively, Vuong’s test allows determining which accounting method of financial assets (AFS or FVTPL) is better suited. The hypotheses under consideration are:
13 H-0: The models are the same
H-1: AFS is better than FVTPL
H-2: FVTPL is better than AFS
Since, the two financial assets are accounted differently with different effects on the Income Statement and Balance sheet and which seems to create different behaviors on the investors, the null hypothesis could be expect to be rejected. Consequently, one could expect that one of the models would present more explanatory power of the share prices than the alternative model (H-1 or H-2).
In this analysis, I also tested model 3 below, which combines AFS and FVTPL in the same model. In this model the constant was excluded since the two variables are present in the regression.
Model 3:
where AbFVTPL_AFS is the value of total assets before fair value through profit and loss and available for sale
The coefficients of AFS and FVTPL are compared using a wald test, i.e., H-0: The coefficients are the same
H-1: The coefficients are different
Again, since both methods are measured at FVA and previous literature suggest a strong explanatory power of share prices by financial assets at FVA (e.g. Barth, 1994; Ahmed
14 and Takeda, 1995), I expect and to be statistically significant. However, given that the two methods are accounted differently, I also expect the null hypothesis (H-0) to be rejected.
Furthermore, outliers were removed using with the purpose of obtaining robust standard errors of the OLS estimators. To remove outliers I used a cap of 10% over the maximum value (Tiwari et al ,2007), since such percentage is the most reasonable value to takeout the main outliers present on the sample Thus, such method was concluded to be the best removing condition after the observation of the histogram representative of the dependent variable (Price on December 31).
Given the heterogeneity of companies present in the sample, as expected the model presents some heteroskedasticity. However, such heteroskedasticicy was correted using White’s (1980) approach in order to obtain standard errors robust to heteroskedasticity.
4. Sample data
My empirical analysis is based on accounting and market data, for a sample of 50 companies over the period between 2005 and 2010 selected from BE500 index which is composed by the 500 most highly capitalized European companies.
The chosen time interval can be explained by the fact of the year 2005 entailed the compulsory implementation of International Financial Reporting Standards (IFRS) for listed companies in Europe, and at the time of elaboration of this study while the annual reports until 2010 were available for all the companies in the sample only some of them had already made available annual reports for 2011.
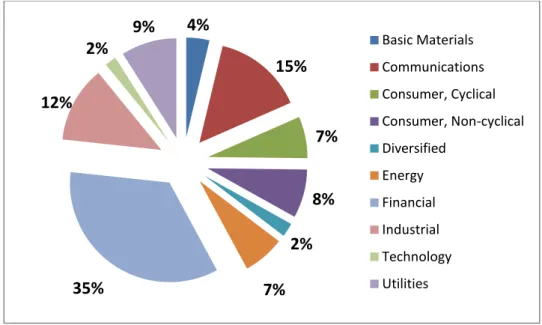
15 All companies used in the sample have fiscal year ending 31 December and publish annual reports in Euros. The sample includes companies from the industries of basic materials, communications, consumer cyclical, consumer non-cyclical, energy, financial, industrial, technology, utilities and diversified.
Figure 1: Allocation of the different industries in the sample (in percentage)
4.1. Data description
My initial sample was composed by 500 companies in the BE500 index. However, I removed from the sample, companies that did not satisfy the following specific requirements:
- Fiscal year ending December 31 - Annual Reports published in Euros - Available accounting and market data
4% 15% 7% 8% 2% 7% 35% 12% 2% 9% Basic Materials Communications Consumer, Cyclical Consumer, Non-cyclical Diversified Energy Financial Industrial Technology Utilities
16 In addition, from the remaining sample I chose the 50 largest in terms of average market capitalization over 2005 until 2010. Once the sample of companies was settled I started hand-collecting all accounting and market data required.
Almost all accounting and market data used in this research, was collected from the equity screening function of the Bloomberg Terminal with the exception of specific accounting data for carrying amounts of financial assets at fair value trough profit or loss and available-for-sale financial assets that were hand-collected from the companies’ annual reports .
For some of the years included in the sample, some companies did not provide specific carrying amounts for financial assets AFS and FVTPL, respectively. Thus, the data related to particular years in such conditions was removed from the sample. My total sample is made up of 266 firm-years.
4.2. Descriptive statistics
Appendix 2 presents the descriptive statistics of the variables used in the sample. All variables were divided by the number of shares in order to eliminate scale effects (e.g., Easton and Sommers, 2003), and are accounted in Euros.
5. Empirical Results
17 Analyzing all models in terms of adjusted R², it is possible to conclude that about 75% for models 1 and 2, and about 74% for model 3 of the variation in the dependent variable (share prices) is accounted for by the explanatory variables.
Moreover, and as expected, the coefficients for AbFVTPL, AbAFS, AbFVTPL_AFS, FVTPL, AFS and NI are all positive and highly statistically significant for all models. As equally expected the coefficient for Liabilities is negative and is also highly statistically significant for all models.
As expected, the high adjusted R² of both models (1 and 2) and also the values of the absolute values of the coefficients related to AFS and FVTPL (0.7181 and 0.6771) show that both methods provide strong explanatory power of the security prices. Taking into account that they are measured using FVA, my results are consistent with previous literature (e.g. Barth, 1994 and Ahmed and Takeda, 1995).
Model 1 and Model 2: Vuong test
In order to compare model 1 with model 2, I applied the Vuong test, which is a likelihood ratio test for model selection, i.e.,
,
where
, f = model 1, g = model 2 and
.
18 = 0.02207
= 15.0866 V = 0.0003
Recall that the hypotheses under analysis are: H-0: The models are the same
H-1: AFS is better than FVTPL
H-2: FVTPL is better than AFS
Since the Vuong test statistic is equal to 0.0003, it follows that for a critical value of 1.959964 the H-0 that the models are the same cannot be rejected, which implies that FVTPL and AFS, associated to model 1 and model 2, respectively, are equal in terms of value relevance for the investors.
Model 3: Wald Test
For model 3, the results associated with Wald test are a p-value of 0.5276 if the F-statistic is used and a p-value of 0.5271 if the Chi-square version is considered. These results are the opposite of what was expected since the null hypothesis of equality of the coefficients cannot be rejected.
19
6. Conclusions
The core goal of this study, considering that under IAS 39, financial assets using FVA can be accounted as FVTPL or AFS, is to conclude about which of the two possible methods for financial assets accounting is better related with security prices using a sample of top European companies in terms of market capitalization.
There are two main issues that accentuate the importance of this research. First is the fact that financial markets have become more complex which has led accounting standards to constantly change the rules, increasing the importance of accounting research to make a substantive contribution in addressing questions relevant to standard setting. Second, the nonexistence of any value relevance study comparing methods for financial assets accounting enhances such contribution.
The results in this study provide evidence that both methods provide equally strong explanatory power of security prices. Taking into account that both methods imply the use of fair value, the results presented are consistent with previous research (Barth, 1994 and Ahmed and Takeda, 1995), which suggest strong explanatory power of security prices by fair value accounting.
Given that the sample creation process requires hand-collection of the carrying amounts of FVTPL and AFS from the notes of several companies’ annual reports it is difficult to build large samples. However, it would be interesting to extend the research conducted in this study, using larger samples.
Moreover, since many value relevance studies are based on American data, it would also be interesting to perform value relevance studies on other countries using IFRS.
20
7. References
Ahmed, A. S. and C. Takeda. 1995. "Stock market valuation of gains and losses on
commercial banks' investment securities: an empirical analysis", Journal of Accounting and Economics, Vol. 20 No.2: pp.207-225.
Barth, M. 1994. “Fair Value Accounting: Evidence from Investment Securities and the
Market Valuation of Banks,” The Accounting Review, January: 1- 25.
Barth, M. E., W. H. Beaver, and W. R. Landsman. 2001. “The relevance of the value
relevance literature for financial accounting standard setting: Another view.” Journal of Accounting and Economics, 31 (1-3): 77-104.
Dechow, P. M. 1994. “Accounting earnings and cash flows as measures of firm
performance: The role of accounting accruals”, Journal of Accounting & Economics, Vol 18, 3-42.
Easton, P. and G. Sommers. 2003. “Scale and scale effect in market-based accounting
research”, Journal of Business Finance and Accounting, 30(1-2): 25-56.
Feltham, G. A. and J. A. Ohlson. 1995. “Valuation and clean surplus accounting for
operating and financial activities.” Contemporary Accounting Research, 11(2): 689-731.
International Accounting Standards Board (IASB). 2003. International Accounting
Standard 32: Financial Instruments: Disclosure and Presentation. London, UK: IASB.
International Accounting Standards Board (IASB). 2003. International Accounting
Standard 39: Financial Instruments: Recognition and Measurement. London, UK: IASB.
International Accounting Standards Board (IASB). 2005. IFRS 7: Financial
21
Laux, C. and C. Leuz. 2010. "Did Fair-Value Accounting Contribute to the Financial
Crisis?" Journal of Economic Perspectives, 24(1): 93–118.
Ohlson, J. A. 1995. “Earnings, book values, and dividends in equity valuation.”
Contemporary Accounting Research, 11 (2): 661-687.
Procházka, D. 2011. “The role of fair value measurement in the recent financial
crunch”, Prague Economic Papers, Vol. 1
Stol, Peter-Paul. 2010. “The impact of culture on fair-value accounting in european
banks”. Maastricht University - School of Business and Economics.
Tiwari, K., K. Mehta, N. Jain, R. Tiwari and G. Kanda. 2007. “Selecting the
Appropriate Outlier Treatment for Common Industry Applications.”
http://www.nesug.org/proceedings/nesug07/sa/sa16.pdf
Vuong, Quang H. 1989. “Likelihood ratio tests for model selection and non-nested
hypotheses”, Econometrica 57, 307-333
White, H. 1980. “A heteroscedastic-consistent covariance matrix estimator and a direct
22
8. Appendices
Appendix 1: Short description of the Vuong test
The test statistic is
,
Where
, and
.
Choose a critical value from the standard normal distribution that corresponds to the desired level of significance
If V > c, reject null that models are the same in favor of being better than
If V < -c, reject null that models are the same in favor of being better than
If , we cannot reject the null that the models are the same.
Appendix 2: Descriptive statistics: Data per share, in € per share
Mean Median Maximum Minimum Std. Dev. N
AbFVTPL 285,81 79,24 3668,25 4,44 549,51 266 AbAFS 283,95 85,73 3674,60 3,73 552,03 266 AbFVTPL_AFS 237,60 68,11 3663,64 3,71 497,28 266 FVTPL 46,35 3,22 1276,03 0 148,80 266 AFS 48,21 2,05 704,94 0 129,95 266 L 305,48 75,18 3609,16 2,58 591,06 266
23 AbFVTPL = assets before fair value through profit or loss
AbAFS = assets before available for sale
AbFVTPL_AFS = assets before fair value through profit or loss and available for sale FVTPL = financial assets at fair value through profit or loss
AFS = financial assets AFS L = liabilities
NI = net income
Appendix 3: Value relevance of financial assets accounting information Model 1:
Regressors Coef St. error t-statistic p-value
Const 14.54488 3.162025 4.599863 0*** AbFVTPL 0.687064 0.063716 10.78326 0*** FVTPL 0.677126 0.064432 10.50913 0*** L -0.69072 0.065071 -10.6149 0*** NI 2.996916 0.398084 7.52836 0*** Adj. R² 0.749326 N 266 Model 2:
Regressors Coef St. error t-statistic p-value
Const 13.85106 3.150507 4.396453 0.0000*** AbAFS 0.731696 0.070874 10.32385 0.0000*** AFS 0.718063 0.066985 10.71981 0.0000*** L -0.73641 0.071977 -10.23126 0.0000*** NI 3.001177 0.398357 7.533892 0.0000*** Adj. R² 0,749230 N 266
24
Model 3:
Regressors Coef St. error t-statistic p-value AbFVTPL_AFS 0.775335 0.087969 8.813715 0.0000*** FVTPL 0.769532 0.087676 8.776950 0.0000*** AFS 0.759516 0.082646 9.190042 0.0000*** L -0.779615 0.089188 -8.741270 0.0000*** NI 3.159624 0.554930 5.693735 0.0000*** Adj. R² 0.740045 N 266
Wald test results:
Restriction F-Stat p-value Chi-square p-value
0,4000028 0,5276 0,4000028 0,5271
Note: *: p<0.10; **: p<0.05; ***: p<0.01; FVTPL is the financial assets at fair value
through profit or loss; AFS is the financial assets available for sale; AbFVTPL is the financial assets at fair value through profit or loss, AbAFS is the total assets before available for sale; AbFVTPL_AFS is the total assets before fair value through profit or loss and available for sale; L is the total liabilities; NI is the net income.