for sensory data treatment applied to the sensory profile of Port wines
Alice Vilela1*, Bebiana Monteiro2 and Elisete Correia3
1 Chemistry Research Centre of Vila Real (CQ-VR), Dep. of Biology and Environment, Oenology building, University of Trás-os-Montes and Alto Douro (UTAD), 5001-801 Vila Real, Portugal
2 University of Trás-os Montes and Alto Douro (UTAD), 5001-801 Vila Real, Portugal
3 CMAT and Dep. of Mathematics, University of Trás-os-Montes and Alto Douro (UTAD), 5001 801 Vila Real, Portugal *e-mail: [email protected]
Abstract. Port wine is a fortified wine. After the grape spirit addition the fermentation stops and the wine
retains some of the natural sweetness of the grape. Port wine exhibits a variety of different styles, each with its own characteristic flavors. Ruby, Reserve Ports and Late Bottled Vintage Ports (LBV), Tawny Ports and White Ports. Information about the wines sensory characteristics is critical for the successful development and marketing of each new wine brand once brand management in today’s business world is extremely related to the organizations purpose and improvement of their strategies. The two main purposes of this study were to describe a specific sensory method, used by a trained sensory panel including chemical compounds reference development, to establish the most important descriptive and discriminative sensory attributes of different Port wine styles and brands and to compare the results of PCA with the results of CATPCA, in order to assess the feasibility of both techniques.
1 Introduction
Port wine is a fortified wine made by adding a proportion of grape spirit, or brandy, to the wine before the must/wine has finished fermenting. After the grape spirit addition the fermentation stops and the wine retains some of the natural sweetness of the grape, making it rich, round and smooth on the palate. Port wines are in the market with a variety of different styles, each style with its own sensory characteristic. Ruby, Reserve Ports and Late Bottled Vintage Ports (LBV) aged usually in vat for two, three years or even six years (LBV) share a deep red youthful colour and intense red-fruits/berries flavors, Tawny Ports (10, 20, 30 and 40 year old Tawny), which age for longer periods in oak casks, present delicious nuttiness and aromas of butterscotch and fine oak wood; White Ports, made from classic white grapes, usually aged for two or three years in large vats and are available in sweeter or drier styles. Within each Port wine style, there are several Port wine brands. Aiming at detecting different sensory descriptors in wines, and given that the collected variables are measured on an ordinal scale a Categorical Principal Component Analysis (CATPCA) can be performed. Hence, linear or standard Principal Component Analysis (PCA) could be not appropriate and should be used only after linearity in ordinal variables has been verified. However, multivariate analysis has been used for wine characteristic evaluation and PCA has long been applied to sensory data treatment 1-6. Currently, nonlinear PCA has been introduced and developed to avoid the limitations of standard PCA 7-8. The CATPCA procedure 9 belongs to such class of
methods, and it is based on quantification of categorical variables by applying optimal scaling techniques.
The main purposes of this study were to describe a sensory method, used by a trained sensory panel, including chemical compounds reference development 10-11, to establish the most significant descriptive sensory attributes of different Port wine styles and brands comparing the results of a PCA with the results of a CATPCA.
2 Material and Methods
2.1 Wines
28 samples of Port wines from 3 different styles: ten White Ports; nine Ruby Ports and nine Tawny Ports, all from different Demarcated Douro Region (DDR) wineries, with cellars in Oporto were evaluated (Tab. 1). The brands were coded in our work, to avoid revealing commercial names. The bottles were stored in a cellar, lying down and under the same conditions – relative humidity around 85% and at a temperature around 12°C. Prior to each tasting session the bottles were maintained at 6ºC until tasting.
Table 1 – Wine samples evaluated and respective code
numbers.
Wine Style Brand (B), Style (W, R or T) and Bottle number
White Ports (W) BW1 to BW10 Ruby Ports (R) BR11 to BR19 Tawny Ports (T) BT20 to BT28
2.2 Selection of descriptors for Port wines and development of references
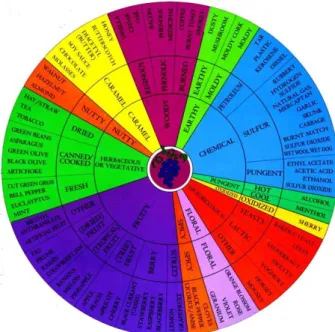
Of each Port style, two wines were tasted and discussed by twelve trained panellists over three sessions in an attempt to generate terms. Each session lasted around 1 hour. In all the sessions, the Wine Aroma Wheel 12 was provided to facilitate term generation (Fig. 1). Appearance (Fig. 2), aroma, taste, flavor and mouthfeel references were provided to facilitate the discussion. By analysing the frequency of citations, from an original long list of attributes, a reduced list was compiled. For the development of quantitative references, in order to make reference evaluation as close as possible to wine-tasting conditions, identical glasses as used for wine evaluation 13 were used for the aroma reference presentation (Fig. 3).
Figure 1. Wine Aroma Wheel, adapted from Noble and
Shannon 12, provided to the panellists.
Figure 2. References for Port wine colors.
After all the references were developed, 3 training sessions were carried out according to the methodology that would be used to evaluate the wines (Tab. 2, at the end of the article).
Figure 3. Natural products associated with Port Wine aroma. 2.3 Wine Tasting
All the wines (28 Port wines) were evaluated in triplicate in nine tasting sessions, one session per week, from 10:00 to 12:00 p.m. The wines were randomly distributed throughout the sessions of each series in a way that the three replications were consecutive.
Sessions were carried out under controlled temperature conditions (20±2°C) and relative humidity (60±20%). Aroma references (Tab. 2) were served in standardized wine-tasting glasses 13. Wine bottles were opened immediately before tasting, 35 ml samples of each wine were served in standardized glasses. The references and wines were evaluated in isolated booths according to the methodology describe by Vilela et al. 11. Attribute intensities were scored on a 5-point scale (ranging from 1-lowest intensity to 5-highest intensity) by comparison with the intensity of the references. The panellists were instructed to rinse with water between references and between wines, as well as to use unsalted crackers to decrease astringency carryover; they were also told to have a rest and to leave the tasting room if necessary.
2.4 Data Analysis
All statistical analysis was performed using SPSS (IBM SPSS Statistics 20). In order to establishing the most important descriptive and discriminative sensory attributes of different Port wine styles and brands, Principle Component Analysis (PCA) and Categorical Principle Component Analysis (CATPCA) were applied on the data set of 23 attributes.
3 Results
With the aim of establishing and interpreting the sensory descriptors of 28 Port Wines, a PCA was applied on the total data set of 23 attributes. To use a PCA is necessary to check some assumptions namely, the Bartlett test of sphericity and the measure of sampling adequacy of Kaiser-Meyer-Olkin (KMO) 14, which must exceed 0.5. As shown in Tab. 3, a statistically significant Bartlett’s test of sphericity, sig=0,00, indicates that sufficient correlation exist among the variables yet a lower value of KMO, 0.209, indicates a not good sampling adequacy.
Table 3 - KMO and Bartlett's Test (PCA analysis)
Kaiser-Meyer-Olkin Measure of Sampling Adequacy
0.209
Approx. Chi-Square 889.432 Bartlett's Test of Sphericity, df 253
Sig. 0.000
The two–dimensional model, Tab. 4, indicates that 40.451% of total variability is explained by PC1 and 19.874% by PC2. Thus, the two components explain 60.325% of the total amount of initial variance.
Table 4 - Eigenvalue obtained by the two–dimensional PCA
model.
Total Variance Explained
Initial Eigenvalues Extraction Sums of Squared Loadings
Total % of Var. Cum. % Total % of Var. Cum. % 9.304 40.451 40.451 9.304 39.850 39.850 4.571 19.874 60.325 4.571 19.874 60.325
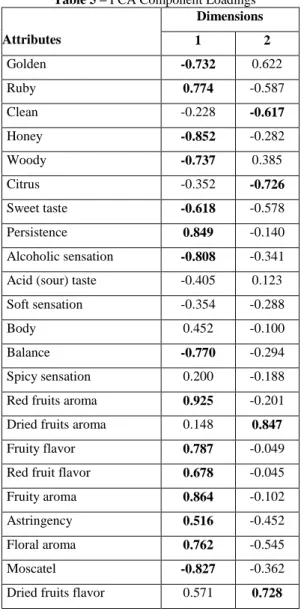
The principal components are illustrated in Fig. 4. The model did not highlight differences among wines from winery brands, however wine samples are grouped on the plane according to wine style. As we said before a PCA was applied on the data set of 23 attributes, however, only 19 of them contributed to the two– dimensional model in a meaningful way (factor loadings>0.5, Tab. 5), then the first component (PC1) was best described by attributes: Golden, Ruby, Honey, Woody, Sweet taste, Persistence, Alcoholic sensation, Balance, Red fruits aroma, Fruity flavor, Red Fruits flavor, Fruity, Astringency, Floral and Moscatel. The second component (PC2) was characterized by attributes such as: Clean, Citrus, Dried fruits aroma and Dried fruits flavor.
Figure 4 – Principal components loadings and scores of the
sensory attributes and wines for components 1 and 2.
Table 5 – PCA Component Loadings Attributes Dimensions 1 2 Golden -0.732 0.622 Ruby 0.774 -0.587 Clean -0.228 -0.617 Honey -0.852 -0.282 Woody -0.737 0.385 Citrus -0.352 -0.726 Sweet taste -0.618 -0.578 Persistence 0.849 -0.140 Alcoholic sensation -0.808 -0.341 Acid (sour) taste -0.405 0.123 Soft sensation -0.354 -0.288 Body 0.452 -0.100 Balance -0.770 -0.294 Spicy sensation 0.200 -0.188 Red fruits aroma 0.925 -0.201 Dried fruits aroma 0.148 0.847
Fruity flavor 0.787 -0.049 Red fruit flavor 0.678 -0.045 Fruity aroma 0.864 -0.102 Astringency 0.516 -0.452 Floral aroma 0.762 -0.545 Moscatel -0.827 -0.362 Dried fruits flavor 0.571 0.728
The first principal component distinguishes Ruby brands, located on the positive axis from White brands on the negative axis. In the Ruby brands, the attributes Ruby, Persistence, Red fruits, Astringency and Floral were dominant, whereas in the White brands, attributes like Honey, Sweet taste, Alcoholic sensation, Balance, and Moscatel are the ones that better characterize these wines. However the wine BW7 (White Port Wine, sample number seven) is better characterize by the attributes Golden and Woody. Tawny Port Wines are characterized by the nasal and orthonasal attributes Dried fruits.
When we used a Categorical Principal Components Analysis (CATPCA) the two-dimensional model have an internal consistency coefficient (Cronbach’s Alpha) of 0.954 and yields an eigenvalue of 11.383 for the first component, indicating that 49.492% of the variance is accounted by this component (Tab. 6). For the second component the internal consistency coefficient is 0.862 with an eigenvalue of 5.695, indicating that its proportion of variance is 24.761%. Thus, the two components explain 74.253% of the total amount of initial variance (Tab. 6), a higher value than the one achieved with PCA analysis.
Table 6 – CATPCA Model Summary
Dimension Cronbach's
Alpha a Variance Accounted For Total
(Eigenvalue) % of Variance 1 0.954 11.383 49.492 2 0.862 5.695 24.761 Total 0.984a 17.078 74.253
a. Total Cronbach's Alpha is based on the total Eigenvalue.
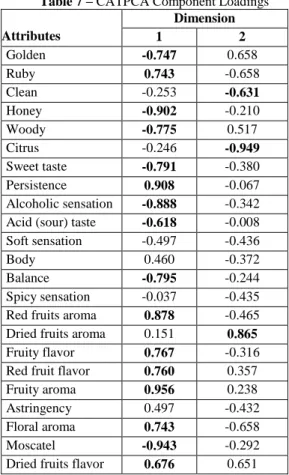
For the 28 Port Wines we obtained a biplot (Fig. 5) with each attribute and each wine plotted along dimension 1 and dimension 2. The attributes (factor loadings>0.5, Table 7) that best describe the first component are: Golden, Ruby, Honey, Woody, Sweet taste, Persistence, Alcoholic sensation, Acid taste, Balance, Red fruits aroma, Fruity flavor, Red Fruit flavor, Fruity aroma, Floral aroma, Moscatel and Dried fruits flavor. The second component (PC2) was characterized by attributes such as: Clean, Citrus, and Dried fruits flavor.
The first principal component (PC1) distinguishes Ruby brands, located on the positive axis from White brands on the negative axis. In the Ruby brands, the attributes Ruby, Red fruits, Fruity flavor, Astringency and Floral were dominant, whereas in the White brands, attributes like Honey, Sweet taste, Alcoholic sensation, Balance, Acid taste and Moscatel are the ones that better characterize these wines. Tawny Port Wines are characterized by the orthonasal attribute Dried fruits.
Table 7 – CATPCA Component Loadings Attributes Dimension 1 2 Golden -0.747 0.658 Ruby 0.743 -0.658 Clean -0.253 -0.631 Honey -0.902 -0.210 Woody -0.775 0.517 Citrus -0.246 -0.949 Sweet taste -0.791 -0.380 Persistence 0.908 -0.067 Alcoholic sensation -0.888 -0.342 Acid (sour) taste -0.618 -0.008 Soft sensation -0.497 -0.436 Body 0.460 -0.372 Balance -0.795 -0.244 Spicy sensation -0.037 -0.435 Red fruits aroma 0.878 -0.465 Dried fruits aroma 0.151 0.865
Fruity flavor 0.767 -0.316 Red fruit flavor 0.760 0.357 Fruity aroma 0.956 0.238 Astringency 0.497 -0.432 Floral aroma 0.743 -0.658 Moscatel -0.943 -0.292 Dried fruits flavor 0.676 0.651
Figure 5 – CATPCA analysis principal components loadings
and scores of the sensory attributes and wines for components 1 and 2.
4 Discussion
Principle Component Analysis and Categorical Principle Component Analysis are appropriate for “good” variable selection and dimension reduction. They can be used to analyse interrelationships among a large number of variables and explain these variables in terms of their common underlying dimensions (factors) 14. The objective is to find a few linear combinations of the variables (factors) that can be used to summarize the data without losing too much information in the process. As mentioned before, the PCA is a technique that should only, in principle, be applied when the variables are quantitative, have multivariate normal distribution, linearly related to each other and the sample size should be large enough, at least five times as many observations as the number of variables to be analysed 14. This statistical procedure requires three stages: validation of the model, factor extraction and factor rotation (optional). The first stage involves the calculation of the matrix correlation to determine the degree of association between the variables. A rule of thumb will be to consider correlations between 0.3 and 0.7. Another method of determining the appropriateness of PCA is the Bartlett test of sphericity, which provides the statistical significance that the correlation matrix has significant correlations among at least some variables. A statistically significant Bartlett’s test of sphericity (sig<0.05) indicates that sufficient correlation exist among the variables 14. A third measure to quantify the degree of inter-correlations among the variables and the appropriateness of this method is the measure of sampling adequacy (MSA). Measure of sampling adequacy values must exceed 0.5 14.
Categorical principal components analysis is a nonparametric method that quantifies categorical
variables through a process called optimal quantification (also referred to as optimal scaling, or optimal scoring) 9. Optimal quantification replaces the category labels with category quantifications in such a way that as much as possible of the variance in the quantified variables is accounted for. The most important advantages of nonlinear over linear PCA are that it incorporates nominal and ordinal variables and that it can handle and discover nonlinear relationships between variables. Because CATPCA directly analyses the data matrix and not the derived correlation matrix, there need not be the usual concern to have at least five times as many observations as the variables. In fact, CATPCA is suited for analysis in which there are more variables than objects 9.
As it was mentioned before, the PCA is a technique that should only, in principle, be applied to quantitative variables. However, in sensory sciences as well as in most studies of social sciences, many of the variables used are qualitative, nominal or ordinal. Thus, we recommend using the CATPCA instead of PCA. In some related works, PCA analysis prove to demonstrate interesting results. For instances, in a work that aimed to investigate the sensory and chemical characteristics of Blanc Du Bois wines to characterize quality differences among them, PCA analysis showed specific attributes to be correlated with high- or low-quality wines 5. In another interesting work that aimed to improve local wine aroma and quality of wines of Cabernet Sauvignon grape-must inoculated with twelve autochthonous strains of
Saccharomyces cerevisiae, PCA analysis of active aroma
compounds, which contents were higher than thresholds, distinguished wines prepared into four groups according to the yeasts applied for microvinifications 6. However, as we have demonstrated in our work, the CATPCA data analysis seems to be more robust: in the CATPCA biplot the two components explained 74.253% of the total amount of initial variance while in the PCA biplot the two components only explained 60.325% of the total amount of initial variance. Moreover, the CATPCA model did not highlighted differences among wines from winery brands while, in the PCA, Port Wines are grouped according to wine style and there are some discrimination between winery brands.
5 Conclusions
The work presented here allowed to obtain two solutions that must be properly weighted. It also demonstrated that the application of computational resources should be taken with some care in order not to commit methodological errors.
In both analyses were considered two components, however, the percentage of total amount of initial variance explained by CATPCA is higher (74.253%) than the one explained by PCA analysis (60.325%).
Clearly, the PCA violated some basic principles: the variables used were qualitative, the measure of sampling adequacy of Kaiser-Meyer-Olkin, which must exceed 0.5 gave a value of only 0.209, indicating a not good sampling adequacy. The sample size should be large
enough, at least five times as many observations as the number of variables to be analysed, which is not the case in our study where we had 23 variables and 28 observations. In fact, CATPCA is suited for analysis in which there are more variables than observations.
Moreover, the CATPCA grouped the wines according to wine style, independently of the wines brands and there is greater cohesion between groups which seems to be appropriated to the wine samples in question.
Acknowledgments
This work was sponsored by the Project I&D INNOVINE&WINE – Vineyard and Wine Innovation Platform n.º da operação NORTE-01-0145-FEDER-000038, cofinanciado pelo FEDER através do NORTE 2020. The authors would also like to thank the entire tasting panel (Gran-Cruz Company) that participated in this work.
References
1. Vilanova M., Zamuz S., Tardaguila J., Masa A. (2008) Characterization by descriptive analysis of Vitis vinifera cv, Albariño. Journal of the Science of Food and Agriculture, 88: 19– 823.
2. Vilanova M., Masa A., Tardaguila J. (2009). Evaluation of the aromatic variability of Spanish grape by quantitative descriptive analysis. Euphytica, 165: 383–389.
3. Rodriguez-Nogales J., Fernandez-Fernandez E., Vila-Crespo J. (2009). Characterization and classification of Spanish Verdejo young white wines by volatile and sensory analysis with chemometric tools. Journal of the Science of Food and Agriculture, 89: 1927–1935.
4. Esti M., Airola R.L, Moneta E., Paperaio M., Sinesio F. (2010). Qualitative data analysis for an exploratory sensory study of grechetto wine. Analytica Chimica Acta, 660: 63-67.
5. Dreyer E., Sims C., Rouseff R., Gray D., Sipowicz M. (2013). Sensory and compositional characteristics of Blanc Du Bois wine.
American Journal of Enology and Viticulture, 64: 118-125.
6. Liang H.-Y., Chen J.-Y. Reeves M., Han B.-Z. (2013). Aromatic and sensorial profiles of young Cabernet Sauvignon wines fermented by different Chinese autochthonous Saccharomyces
cerevisiae strains. Food Research International, 51: 855-865.
7. Gifi A. (1990). Nonlinear Multivariate Analysis. New York: J. Wiley.
8. Linting M., Meulman J.J., Groenen P.J.F., Van der Kooij A.J. (2007). Nonlinear principal components analysis: Introduction and application. Psychological Methods, 12: 336-358.
9. Meulman J. J., Van Der Kooij A., Heiser W. (2004). Principal Component Analysis with Nonlinear Optimal Scaling Transformations for Ordinal and Nominal Data. London: Kaplan Sage.
10. Monteiro B., Vilela A., Correia E. (2014). Sensory profile of pink port wines: Development of a flavor lexicon. Flavor and Fragrance
Journal, 29: 50-58.
11. Vilela A., Monteiro B., Correia E. (2015). Sensory profile of Port wines: Categorical Principal Component Analysis, an approach for sensory data treatment. Ciência e Técnica Vitivinícola, 30(1): 1-8. 12. Noble A.C. & Shannon M. (1987) Profiling zinfandel wines by
sensory and chemical analysis. American Journal of Enology and
Viticulture, 38: 1–5.
13. ISO (ISO 3591). (1977). Sensory analysis. Apparatus wine tasting glass. Geneva, Switzerland: International Organization for Standardization.
14. Hair J., Anderson R., Tatham R., Black W. (2009). Multivariate Data Analysis. New Jersey: Prentice Hall.
Table 2 – Descriptors (1) or attributes for Port wines White, Ruby and Tawny with more citations and respective references. The aroma
was perceived as an orthonasal perception and flavor as a retro nasal perception.
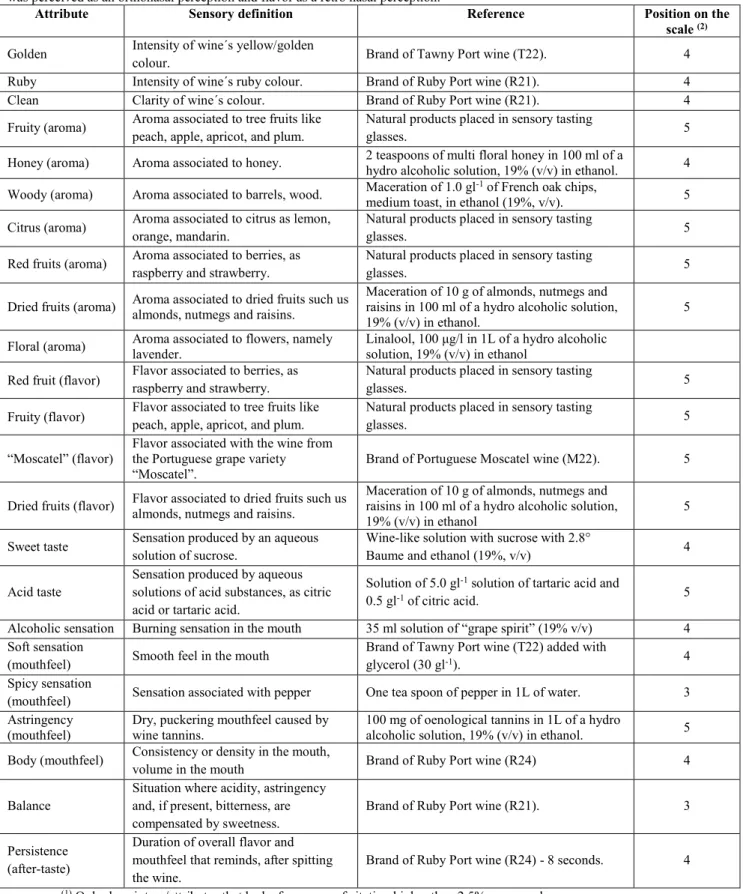
Attribute Sensory definition Reference Position on the
scale (2)
Golden Intensity of wine´s yellow/golden
colour. Brand of Tawny Port wine (T22). 4 Ruby Intensity of wine´s ruby colour. Brand of Ruby Port wine (R21). 4 Clean Clarity of wine´s colour. Brand of Ruby Port wine (R21). 4 Fruity (aroma) Aroma associated to tree fruits like
peach, apple, apricot, and plum.
Natural products placed in sensory tasting
glasses. 5
Honey (aroma) Aroma associated to honey. 2 teaspoons of multi floral honey in 100 ml of a hydro alcoholic solution, 19% (v/v) in ethanol. 4 Woody (aroma) Aroma associated to barrels, wood. Maceration of 1.0 glmedium toast, in ethanol (19%, v/v). -1 of French oak chips, 5 Citrus (aroma) Aroma associated to citrus as lemon,
orange, mandarin.
Natural products placed in sensory tasting
glasses. 5
Red fruits (aroma) Aroma associated to berries, as raspberry and strawberry.
Natural products placed in sensory tasting
glasses. 5
Dried fruits (aroma) Aroma associated to dried fruits such us almonds, nutmegs and raisins. Maceration of 10 g of almonds, nutmegs and raisins in 100 ml of a hydro alcoholic solution, 19% (v/v) in ethanol.
5 Floral (aroma) Aroma associated to flowers, namely lavender. Linalool, 100 μg/l in 1L of a hydro alcoholic solution, 19% (v/v) in ethanol
Red fruit (flavor) Flavor associated to berries, as raspberry and strawberry. Natural products placed in sensory tasting glasses. 5 Fruity (flavor) Flavor associated to tree fruits like peach, apple, apricot, and plum. Natural products placed in sensory tasting glasses. 5 “Moscatel” (flavor) Flavor associated with the wine from the Portuguese grape variety
“Moscatel”.
Brand of Portuguese Moscatel wine (M22). 5 Dried fruits (flavor) Flavor associated to dried fruits such us almonds, nutmegs and raisins. Maceration of 10 g of almonds, nutmegs and raisins in 100 ml of a hydro alcoholic solution,
19% (v/v) in ethanol
5 Sweet taste Sensation produced by an aqueous
solution of sucrose.
Wine-like solution with sucrose with 2.8°
Baume and ethanol (19%, v/v) 4 Acid taste
Sensation produced by aqueous solutions of acid substances, as citric acid or tartaric acid.
Solution of 5.0 gl-1 solution of tartaric acid and
0.5 gl-1 of citric acid. 5
Alcoholic sensation Burning sensation in the mouth 35 ml solution of “grape spirit” (19% v/v) 4 Soft sensation
(mouthfeel) Smooth feel in the mouth
Brand of Tawny Port wine (T22) added with
glycerol (30 gl-1). 4
Spicy sensation
(mouthfeel) Sensation associated with pepper One tea spoon of pepper in 1L of water. 3 Astringency
(mouthfeel)
Dry, puckering mouthfeel caused by wine tannins.
100 mg of oenological tannins in 1L of a hydro
alcoholic solution, 19% (v/v) in ethanol. 5 Body (mouthfeel) Consistency or density in the mouth,
volume in the mouth Brand of Ruby Port wine (R24) 4 Balance
Situation where acidity, astringency and, if present, bitterness, are compensated by sweetness.
Brand of Ruby Port wine (R21). 3 Persistence
(after-taste)
Duration of overall flavor and mouthfeel that reminds, after spitting the wine.
Brand of Ruby Port wine (R24) - 8 seconds. 4
(1) Only descriptors/attributes that had a frequency of citation higher than 2.5% were used. (2) Nominal scale for aroma and flavor attributes intensity scoring:
The attribute is not perceived at all 1 Doubts about the presence of the attribute 2 The attribute is clearly perceived, although it is slight 3 The attribute is clearly perceived, but the intensity is lower than the reference 4 The attribute is clearly perceived and the intensity is close or similar to the reference 5