Contribution to technological nutritional and toxicological characterization of two varieties of rice grown in Portugal: amylose, amino acids and arsenic
Contribuição para a caracterização tecnológica, nutricional e toxicológica de duas espécies de arroz cultivado em Portugal: amilose, aminoácidos e arsénio
Ana Margarida Cabral de Pinho
Orientada por: Professor Doutor Duarte Torres Co-orientada por: Mestre Carla Mota
Trabalho de investigação
1.º Ciclo em Ciências da Nutrição
Faculdade de Ciências da Nutrição e Alimentação da Universidade do Porto
Acknowledgments
I am grateful to all members of the Chemistry Laboratory on INSA, for all the support but especially to Dr. Carla Mota, for helping me in my practical and theoretical work and also to Dr. Isabel Castanheira for all the clues and suggestions. I would also like to thanks Prof. Dr. Duarte Torres for discussion time availability and orientation. Another acknowledgment goes to Dr. Inês Coelho and Dr. Sandra Gueifão, who kindly provide me the arsenic data for this work.
Índice
Acknowledgments ... i
Abbreviations and symbols ... iii
Abstract ... v Resumo ... vi Keywords ... vii Palavras-chave ... vii Introduction ... 1 Objectives ... 3
Material and methods ... 3
Sample collection and preparation ... 3
Reagents, standards and analytical procedures ... 4
Statistical analysis and modes of expressions of results ... 7
Results... 7
Discussion ... 9
Conclusions ... 14
References ... 16
Abbreviations and symbols Abbreviations
AA Amino Acid
AC Amylose Content AAS Amino Acid Scores Ala Alanine
AOAC American Organization of Analytical Chemists Arg Arginine
AAA Aromatic Amino Acid Asp Aspartic acid
BCAA Branched Chain Amino Acid Con A Concanavalin A
CV Coefficient of Variation DAD Photodiode Array Detector dw dry weight
EAA Essential Amino Acid
ex. Example
FAO Food and Agriculture Organization Glu Glutamic acid
Gly Glycine His Histidine
ICP/MS Inductively coupled plasma mass spectrometry
Leu Leucine
LOD Limits of Detection LOQ Limits of Quantification
Lys Lysine
NEAA Non-Essential Amino Acids
OECD Organisation for Economic Cooperation and Development PDCAAS Protein Digestibility Corrected Amino Acid Score
Pro Proline
PTFE polytetrafluoroethylene
Ser Serine
SAA Sulfuric Amino Acid Thr Threonine
TP Total Protein
USDA United States Department Of Agriculture UPLC Ultra performance Liquid Chromatography
Val Valine
WHO World Health Organization
Symbols
As Arsenic
Abstract
Recent data shows that Portugal has a rice consume of 15.8 kg/capita/year, the largest in Europe. Due to this importance in Portuguese diet, the present work aims to contribute to its technological characterization, through amylose content (AC) quantification; nutritional characterization, namely, total protein (TP) and amino acid (AA) quantification; and toxicological characterization through arsenic (As) quantification. Another goal of this work is to study the compositional differences between rice varieties, year and place of harvest.
A modified Concanavalin A (Con A) was used to quantify the amylose content, the Kjeldahl method to estimate the TP, the Ultra Performance Liquid Chromatography (UPLC) the AA and the Inductively coupled plasma mass
spectrometry (ICP/MS) the arsenic content.
Analyzed rice showed high AC (31.4%). With respect to protein quality, lysine (Lys) was considered the rice limiting AA, with protein digestibility corrected amino acid scores (PDCAAS) lower than 1. As mean level was 0.31 mg/kg and range from 0.13 to 0.70 mg/kg, which although is below than 1 mg/kg, the assumed safe level for food, it is considered a high level. In this study, a very weak correlation between As levels and AA content was demonstrated. Apart from the AA, only AC differed significantly depending on rice variety. Crop place showed to be the major source of variation in AA content.
Resumo
Dados recentes mostram que Portugal teve um consumo de arroz de 15,8 kg/capita/ano, o maior da Europa. Devido a esta importância do arroz na dieta portuguesa, o presente trabalho pretende ser um contributo para a sua caracterização tecnologia, através da determinação do conteúdo em amilose; caracterização nutricional, usando a Proteína Total (PT) e a quantificação em Aminoácidos (AA); e caracterização toxicológica, através da quantificação de arsénio. Paralelamente, outro objetivo foi verificar se existem diferenças significativas dentro da variedade de arroz, ano e local de colheita para os componentes analisados.
A amilose, PT, AA e arsénio foram quantificados através de um método baseado numa concavalina A modificada, método de Kjeldahl, cromatografia líquida de ultra performance e espectrometria de massa acoplado a plasma indutivo, respectivamente.
O arroz analisado tinha um alto conteúdo em amilose (31,4%). A Lys foi considerada o AA limitante no arroz, por terem um Score de Aminoácidos Corrigido pela Digestibilidade Proteica (SAACDP) inferior a 1. O valor médio obtido para o Arsénio foi de 0,31 mg / kg e varia de 0,13 a 0,70 mg / kg, que, embora seja inferior ao nível estabelecido como seguro para alimentos, é considerado um nível elevado. Há uma correlação muito fraca entre os níveis de arsénio e conteúdo AA. Excluindo os Aminoácidos, o conteúdo em amilose foi o único a diferir significativamente entre a variedade de arroz. O local de colheita mostrou ser a variável que mais influencia o teor de AA do arroz.
Keywords
Portuguese rice; amylose content; essential amino acids, protein quality, arsenic,
Palavras-chave
Arroz português; conteúdo em amilose; aminoácidos essenciais, qualidade proteica, arsénio
Introduction
Rice (Oryza sativa), one of the most popular cereal crop, was first cultivated around 10.000 years ago. Ever since, farmers and, recently, rice breeders have manipulated the crop to desired characteristics according to particular culinary traditions of different cultures, with its own particular set of preferences regarding to rice texture, taste, color and stickiness.(1, 2) Nowadays, rice is cultivated in more than 100 countries and is considered a staple food worldwide, mainly because it provides a basic source of energy, protein, and other nutrients to half of the world population. (2-5) (2-5)(2-5)
The references set the beginning of rice cultivation in Portugal between the XII and the XIII century, firstly in Mondego and then in Tejo estuary.(6) Today, about 80% of the rice growing area in Portugal is represented by Japonica variety (most known as carolino rice) and the remaining 20% belongs to Indica-like varieties (Indica grain type with Japonica genetic background), that corresponds to Agulha rice.(7) Both varieties are deeply rooted in portuguese culinary habits.(8) According to market studies, in 2011 Indica and Japonica varieties were clearly the most consumed rice in Portugal, with 45 and 44% of the market, respectively.(9) Recent data shows that in 2010-2011 Portugal had a rice consume of 15,8kg/capita/year (milled equivalent), which represents the largest consumer of rice in Europe.(10) According to the FAOSTAT food balance sheet, in 2009 Portugal had a total domestic supply of 1.64 million tons of rice (milled equivalent), corresponding to a rice supply of 14.80 kg/capita/year.(11) In a 2000 kcal daily diet, those values represent a contribution of 151 kcal/capita/day (8% of total kcal/capita/day) and 2.8 g of proteins/capita/day (7% of total kcal/capita/day).(11, 12)
Carbohydrates are the main macronutrient found in rice and are represented by a few free sugars and non-starch polysaccharides but especially by starch, which consists of two polysaccharides: amylopectin and amylose.(1, 2, 13-15) Rice´s amylose content (AC) influences two aspects of its marketing: price and culinary use. For ex., Indica rice has longer and narrower grains that use to remain separate after cooking, due to a higher AC, while the lower AC usually present in Japonica, with shorter and rounded grains, tend to stick together after cooking.(7) Thus, rice AC is closely related to its cooking quality traits with a determinant impact on physical, textural and pasting properties of cooked rice, consequently, influencing consumer preferences, which makes it an important focus for farmers and rice breeders.(1, 2, 13-16) In fact, generally, the higher AC in rice, the higher its commercial price.
Protein is the second most abundant component of milled rice and the most commonly analyzed nutrient in this cereal.(2, 17) Rice is not the richest supply of proteins, however, in developing countries, rice accounts for about 20% of dietary protein daily supply.(11) The most important aspect of a protein, from a nutritional point of view, is its Essential Amino Acids (EAA), because they have carbon skeletons that cannot be synthesized by humans, therefore they must be provided through the diet.(19) Digestibility is also a relevant factor for nutrition value of proteins. EAA content can be used to estimate the Protein Digestibility Corrected Amino Acid Score (PDCAAS) that measures the protein quality in human nutrition according to different stages of life. Even so, all Amino Acids (AA) play an important role in human nutrition due to their contribution to protein biosynthesis and sensory traits of products by directly contributing to the flavor of food, color and aroma precursor.(18, 19)
Besides of its nutritional composition, rice is considered one of the largest food dietary source of Arsenic (As), a non-threshold class I carcinogen.(20-22) As concentration in rice plant is approximately tenfold higher than other cereals as it is generally grown under flooded conditions, where As mobility is loud.(21-23) High levels of As in rice cultivars have been found all over the world.(24-28) Being a world staple food crop and an important element of Portuguese dietary habits, it is important to assure rice quality and safety. Besides its toxicology, there is also a suspicions that As accumulation in grain is associated with protein´s degradation.(29)
In addition, commercial value of rice is largely dependent on its AC, nutritive value and safety.
Objectives
Due to the importance of rice in Portuguese daily diet, the present work aims to contribute to its technological characterization, through AC quantification; nutritional characterization, namely, protein and AA quantification; and toxicological characterization through As quantification. Another goal of this work is to study the compositional differences between rice varieties, year and place of harvest.
Material and methods Sample collection and preparation
This study analyzes 19 rice samples from different variety (Indica and Japónica), from different cultivation area (Ribatejo and Sado) and 3 different crops years (2009, 2010 and 2011) (Table 1, Appendix 1). All seeds were provided, in milled form, by local producers, and stored at room temperature until processing.
Reagents, standards and analytical procedures
Required equipment and reagents for all procedures are listed in the Appendix 2. Moisture
Moisture content was determined by gravimetric measurement of weight loss after drying the samples (5g) in a hot-air oven at 102 ± 2 ºC for about 2 hours and then weighted every 60 minutes until constant weight (AOAC Method 925.10).(30) Amylose
AC was determined by a modified Con A method developed by Yun and Matheson (1990), with an assay kit from Megazyme International Ltd. (Bray, Ireland).(31)
Total protein
The Kjeldahl method was used to determine total nitrogen content. Total protein (TP) was calculated from nitrogen content multiplied by the Jones factor for rice of 5,95 (AOAC Method 920.53).(32)
Amino acids analysis and protein nutritional quality assessment
For the preparation of the rice hydrolysate sample, 30 mg of rice sample was weighed and put in a vial of hydrolysis. National Institute of Standards and Technology (NIST) Standard Reference Material (SRM) 3244 was used. In each vial 200 µL of the internal standard (norvaline) and 1 mL of a solution of HCl (6 N) containing 0.5% phenol was added. Then, 30 mL of HCl (6 N) were added into the cup rotor microwave and the rack of vials were put inside. The rotor was placed in the microwave, and the specific program was selected (15 min to reach 160°C, 10 min at 160°C and 30 min cooling). Samples were seal ed under vacuum after three alternating vacuum-nitrogen flushing steps, with 2 min each. All tubes were dried under vacuum. After complete hydrolysis the extracts were neutralized with 1 mL
NaOH (6 N). Each vial was washed until removal of the waste, with the aid of a vortex, to a 10 mL volumetric flask. Ultrapure water was added to the remnant volume. The content of the flask was filtered into an all-glass cap. Derivatization and UPLC conditions were the same as described by Boogers (2007).(33)
To estimate the nutritional quality of rice protein the PDCAAS was calculated as
follows: = ( ) , where
= )*+,-. +/ )) 012 02+.13- 3- 456\8!9\:;: 21/121-<1 0=..12- (*>/>) !! "#$ #% "$ #& ( '/') .(34) If the AA profile of the rice protein food does not match reference patterns, the AA that are in short supply are considered limiting (<1).(35) The lower AAS from all AA was used for represent rice´s global PDCAAS.
AA coefficient of variation and UPLC performance
The coefficient of variation (CV), Z-score, Limits of Detection (LOD), Limits of Quantification (LOQ) and Correlation Coefficient (R2) were calculated. Coefficient of variation was obtained through the formula: ? (%) = AB C DEE
F# (F), and it should be
lower than 25%. To calculate z-score the following formula was applied: G − = I=J,1 +K.=3-1L KM .N1 J=K+2=.+2MOI=J,1 +/ .N1 PQR S22+2 +2 ,-<12.=3-.M <+*K3-1L . Values between -2 and 2 are
considered excellent Z-score and 2 to 3 acceptable. To assess the Limit of Detection (LOD) and Limit of Quantitation (LOQ) the following formulas were used in 10 calibration curves:
LOQ=DE CAW / CX LOD=Z.Z CAW / C
X W/C = \
∑d_ef ^W_O( `X × C_)bc
;Og
Sy/x = method SD; a = intercept; b = slope; N = Number of calibration curves; x = point on the abscissa; y = point on the ordinate
The LOD and LOQ will be acceptable if: 10 x LOD - LOQ have a positive value. Linearity was calculated by the equipment according to the formula:
hg = i + hk + i lm i m ℎ om
Arsenic
For hydrolysis by microwave, 0.5000 g of samples were weighed in a polytetrafluoroethylene (PTFE) vessel. At least one of them should be the blank (vessel with all reagents but without sample) and the other should be the SRM (FAPAS 07134 – rice). Then, 4 ml HNO3, 3 ml H2O e 1 ml H2O2 were added into the cup rotor microwave and the vessels were put inside. The rotor was placed in the microwave, and the specific program was selected [(10 min, 180 ºC, 850 W); (5 min, 180 ºC, 0 W); (6 min, 210 ºC, 1100 W); (5 min, 210 ºC, 0 W); (6 min, 90 ºC, 650 W)]. Next, samples were transferred to 50 ml flasks and filled with ultrapure water.
Analysis by ICP-MS
To correct isobaric interferences the 75As isotope was selected and then the following correction equations were applied in the software itself and according to matrix studied interferences: 75As=75M-3.13220*77ArCl and 77ArCl=77M- 0.826*82Se. The working range for rice is 0.25 - 50 µg/L and the calibration curve was made according to Table 1 (Appendix 3). A dilute solution of 500 µg/L was daily prepared from commercial standard solutions. From this solution dilutions were made in a volumetric flask or using micropipettes, according to Table 2 (Appendix 3). The samples (such as patterns) were placed in an autosampler in disposable tubes 10-50 mL. For each tube, two readings were made and then the mean value was accepted.
Statistical analysis and modes of expressions of results
All samples were analyzed in duplicate. Moisture was expressed in g/100 g and AC and TP in % of dw (mean ± standard deviation). The amount of each AA was expressed as mg/g of rice (mean ± standard deviation). As content (mean ± standard deviation) was expressed in mg/kg of dw.
Normal distribution was previously check using One-Sample Shapiro Wilk Test. Differences between groups were determined using hypothesis tests, namely, the Independent Samples Mann-Whitney U Test for variety and crop place and the Independent Samples Kruskal-Wallis Test for year crop, both at the probability level α=0.05. The correlation between As and AA content was assessed using the Pearson’s Correlation Coefficient.
Data analysis was performed using Microsoft Excel 2010 and Statistical Package for Social Sciences 15.0 software for Windows.
Results Amylose
The mean AC in analyzed rice was 31.4 ± 7.1 %. (Table 2, Appendix 1). AC mean values were higher in Indica rice samples (36.4 ± 6.6), 2009 crop samples (36.8 ± 7.2) and Ribatejo crop samples (33.6% ± 6.8%). Significant difference in AC between rice varieties was found.
Total proteins
TP content was 7.1 ± 1.0% (Table 2, Appendix 1). Between varieties the highest value belongs to Indica with 7.7 ± 1.2%. Among crop year both 2009 and 2011 had 7.8% and Sado crop had the greatest value of 8.2 ± 0.8%. Nevertheless, no significant differences were found between varieties, regions or crop year.
Amino acids
The EAA and NEAA detected by UPLC are presented in Table 3 and 4 (Appendix 1), respectively, in mg/g dw and are presented in this section as % of TP dw. Analysed samples Non-Essential Amino Acids (NEAA) represents 65.5 ± 8.9% of TP while EAA contributes to 37.1 ± 4.5%. Regarding EAA, Aromatic AA (AAA) were the ones found in larger amount (11.32 ± 1.80 % of rice´s TP) followed by the Branched Chain AA (BCAA), Leucine (Leu), Valine (Val) and Isoleucine (Ile) with mean percentages 7.58 ± 0.95 %, 4.51 ± 0.60 % and 3.29 ± 0.46 %, respectively. Histidine (His) represents 2.78 ± 0.53 % and Threonine (Thr), 2.71 ± 0.37 %. Lower values were calculated for Sulfuric AA (SAA), 2.32 ± 0.30 %, and Lysine (Lys), 2.56 ± 0.67%.
His, Lys, AAA, TEAA, Arg, Gly and Pro content was significantly different between varieties and crop year. Between crop regions, only Try, Val, Asp and Ala were not significantly different.
With respect to PDCAAS, Lys was found to limit the nutritional quality of rice protein. (Table 5, Appendix 1).
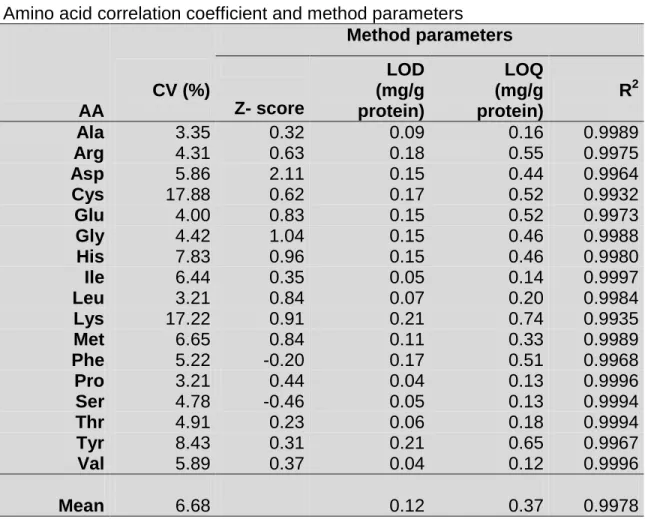
Data obtained a CV was lower than 8.5% for all AA, except Lys (the most limiting AA) with higher CV (~ 18%). Regarding methods parameters, all z-score values fall into -2 and 2, except Asp (2.2). LOD, ranged from 0.04 (Pro and Val) to 0.21 mg/g protein (Lys and Tyr), while the LOQ ranged from 0.12 (Val) to 0.74 mg/g protein (Lys). LOD and LOQ were in acceptable range. As shown in Table 6 (Appendix 1), the coefficient of correlation (R2) for these amino acids was from 0.9932 (Cys) to 0.9997 (Ile and Try).
Arsenic
Rice sample 2, 6, 8 and 9 were not available for As quantification. Analyzed samples showed mean As levels of 0.31 ± 0.20 mg/kg, ranging from 0.13 to 0.70 mg/kg (Table 2, Appendix 1). No significant differences were confirmed between varieties, regions or crop year. Pearson correlation test shows a 0.024 correlation between As and TAA content (Table 7, Appendix 1). Higher Pearson correlation belong to AAA (-0.204) and minimum value to Ser (0.015).
Discussion Amylose
In the current study a significant higher AC in Indica variety (36.3%) was shown (p < 0.05). That should result in more firm and separated grains when cooked, than the Japonica variety with AC close to 28.6%. This data is in agreement with the bibliography indicating that amylose/amylopectin ratio content of the grain is influenced by the rice variety.(16) AC is a key determinant for cooking, processing and eating quality. According to International Rice Research Institute (IRRI), the AC defines two kinds of rice: “waxy” or “nonwaxy” rice.(36, 37) The first one has an AC that does not exceed 2% and is used mainly in candy, children's food and cereals. Nonwaxy rice may be classified, in terms of AC (%) as low (10-20%), intermediate (20-25%) and high (>25%) and is used according to textural and pasting properties for cooking.(15) According to this definition, both analyzed Indica and Japonica varieties had high AC. Juliano (1993) analyzed 31 samples of Portuguese rice and concluded that its AC range varies from low to intermediate (19-21%).(17) The same study also refers that preferred AC type in Portugal was the low one. Literature also showed that, worldwide, Indica variety range from
intermediate to high and Japonica from low to intermediate AC and preferences varies locally.(38)
The rice starch has some special features such as small grains and wide size range of AC, which allows multiple industrial applications.(39) As culinary methods and consequently their commercial value depends on rice´s AC, its measurement is an important quality parameter for starch processing.
Total protein
In the analyzed rice samples TP content was 7.14% (ranging from 5.93 to 9.97%). These values are close to the previous cited study conducted by Juliano (1993), where TP content of Portuguese rice was 6.8%, ranging between 5 and 8%.(17) This author also analyzed a total 233 samples of milled rice from Europe and their protein mean value was 8.0% (5.7-14.8%). Samples analyzed in the current study also showed similar TP values when compared to the one reported by the Organisation for Economic Cooperation and Development (OECD) report (6.3 – 7.1 %).(40) No significant differences in TP content were found between varieties, regions or crop year.
Protein is the major functional and structural component of all cells in the body. Thus an adequate supply of dietary protein is essential to maintain cellular integrity and function, and for health and reproduction.(35, 41) Average requirement for protein in healthy adults is set in 0.66 g/kg.(35) Thus, for a 70 kg person, about 46 g of protein is required. A 100 g dose of rice covers 4.5% (2.2 g) of protein needs, accounting with 88% of its proteins digestibility.
Amino acids AA content
in agreement with the literature, as well as the verified biggest proportion of NEAA compared to EAA.(19, 40, 42) In this study, the amount and proportion of AA in rice´s protein were generally quite similar to the ones found in the literature.(40, 43)
Many studies have demonstrated that different rice varieties may have very different nutrient contents, including TP and AA.(2, 44) In agreement with that, AA content of His, Lys, AAA, TEAA, Arg, Gly and Pro was significantly different between the analyzed rice varieties. However, crop local showed to be the major source for differences in AA content. No studies were found with updated information concerning the influence of crop year and crop region on AA content. CV shows us the data variability from the average. Thus, the smaller the CV is, the more homogeneous the data gets. Data obtained a low CV (<25%), which indicates a data set reasonably homogeneous.
In order to estimate rice protein quality, the relative content of 17 AA were calculated by UPLC, which permits a very high-resolution separations performance in a short period of time with little organic solvent consumption.(45) Up to date, this accurate methodology has never been use for estimate AA in milled rice. The present study includes some parameters to test the UPLC reliability.
Z-score correspond to the difference between the values obtained and the SD of the CRM. According to obtained data, Z-score values were excellent, except for Asp. LOD is the minimum analyte concentration that can be detected by the UPLC while the LOQ the lowest concentration of analyte that can be determined with a reasonable degree of precision and accuracy. This LOQ correspond to the lower concentration of the calibration standard, thus the first point of the curve. Assessed LOD and LOQ were in acceptable range. The linear range of the system
was excellent, showing a direct proportionality of the detector signal vs solute concentration. These results demonstrated that the detection conditions were feasible and could be applied to a quantitative analysis of amino acids.
PDCAAS
The most limiting AA are: Lys, Ile and SAA. These AA have health implications. For example, deficiency of Lys in a rice based diet may lead to defective bone development, anemia, and body weight loss.(46) Similar to other cereals, rice samples proteins have Lys as the most cited limiting AA.(1, 19, 40, 47) Even so, the highest concentrations of Lys and SAA than in others cereals grains contributes to rice´s higher complete balance of AA among other cereals, such as wheat or corn.(40) Ile is also important for hemoglobin formation and help in maintaining normal blood glucose level and SAA has its main importance contributing to control of oxidative status.(48, 49)
AA requirement per day in the human body are well demonstrated, as well as their importance and role for human nutrition, especially EAA as they act as precursors of many coenzymes, hormones, nucleic acids, and other molecules essential for life and consequently their deficiency disturbs nitrogen equilibrium, growth, nutrition, fertility, and life span.(40, 41, 50, 51) The PDCAAS estimate if the effectiveness that dietary absorbed nitrogen is capable of meet the indispensable AA requirement at the safe level of protein intake.(35) Thus the PDCAAS may predict the biological value of proteins, because besides being dependent on the AA balance, by life stages, it also accounts with food protein´s true digestibility.(35) Generally, a diet based on a single staple food plant, like rice, do not ensure an optimal growth because the diet does not provide enough of the limiting AA, essential substrates for protein synthesis. That’s why rice doesn’t contain high
biological value proteins. The nutritional quality of rice protein can be increased when combined, for example, with pulse’s proteins, that have different but complementary limiting AA (limiting in Met but rich in Lys).(35) This kind of complementary information is not always in food compositions database because not enough information is available on AA content. The Eurofir and the United States Department of Agriculture (USDA) food composition databases show there is little information about starch and AA content on rice. But despite being more aware about the EAA question, many people and even nutritionists and dietitian intuitively do not have the protein digestibility in consideration. This kind of information would be enriching if extended to all food databases, especially when food protein digestibility and EAA are concerned because, in some pathological status, like severe disease states, catabolic or infectious status or even in liver disease, the plenitude of each AA and TP intake may be difficult to achieve.(41, 51) Although there is the need to compile more documentation on nutritional properties, many studies have demonstrated that different cultivars of the same species may have different nutrient contents, so, this data would also be important to be included on food databases, resulting in better streamlined recommendations.(19)
Arsenic
Arsenic content
Analyzed samples shows 0.31 mg/kg dw mean values, ranging from 0.13 to 0.70 mg/kg (Table 2, Appendix 1). These values fit on Willian et al. (2007) study that report an As concentration range from 0.01 to 0.82 mg/kg in market samples of rice grains.(52) However, results are the double than the ones reported by Rahman (2011) for European rice (0.15 mg/kg, ranging from 0.13 to 0.20
mg/kg)(26) and also exceeds the Zavala and Duxbury (2008) worldwide ‘‘normal’’ range (0.08–0.20 mg/kg).(53)
At the moment, there is no EU regulations upon As levels in foods.(54) However, 1 mg/kg is often cited in the literature as being a safe level for As in foods.(55, 56) The studied rice samples have lower values, so they may be considered safe. Still, we can be worried about the sample with the highest As value (0.70 mg/kg dw), probably, due to As accumulation in irrigated soils.(57)
As is naturally the 12th most abundant element in the human body but, besides being so present in human body, pollution associated with this toxic element may represents a serious threat to human health.(28), (58), (59, 60) It is well recognized that consumption of As, even at low levels, leads to carcinogenesis.(61, 62) As continuous intake can also lead to gastrointestinal symptoms, bone marrow depression, hemolysis, hepatomegaly, melanosis, polyneuropathy and encephalopathy severe disturbances of the cardiovascular and central nervous systems, and even death.(21, 41)
Arsenic correlation with amino acids
In recent studies total AA content in rice was negatively correlated with As accumulation. There are strong suspicious about increasing grain As accumulation results in modification and degradation of protein, subsequently leading to inhibition of AA synthesis.(29) However, in the present study, Pearson´s correlation between As and AA showed, in mean, a very weak and non-significant correlation.
Conclusions
This study demonstrated that Indica variety had significantly higher AC than Japonica. This kind information is useful because AC determines rice suitability for particular end-uses. This is an important information to small and big-scale
catering services, where small details, like knowing the optimal water-rice ratio for each kind of amylose content is relevant.(17)
Despite the increasing globalization of food, local ingredients will still be kept in all countries. In this regard, each country should have in the food composition table the most current and complete data as possible. Thus, the present study can be considered as a contribution to the Portuguese Food Composition DataBase (PFCDB), in the way that neither the amylose nor AA are included on this food database. With this supplementary information, nutritionists, dietists and other health professionals will be capable to guide their patients in a more reliable way and be sure that, for ex., their intake in EAA are the necessary. Besides, I believe that, with a solid nutrition background and complete food composition databases, national guidelines gets easier to establish. Worldwide the good management of this information might also be assumed as a challenge of reduce malnutrition, especially when EAA are concerned.
Rice is considered one of the few foods without relevant anti-nutritional substances, which result in higher digestibility, biological value and protein efficiency rate.(63) Those characteristics makes it a good source of well-balanced AA and provides hypoallergenic proteins, which provides an opportunity for industry to create specific products, based on this cereal, for celiac people and children.(64) However, besides its nutrition importance, rice may be a dangerous exposure to arsenic, especially for children.(64) Analyzed rice show potential high As levels contribution to the diet. So, for these reasons, As in specific foods and food products made with this cereal must be monitored.
References
1. Juliano BO. Rice in human nutrition. In: FAO, editor. Rice in human nutrition. Rome, Italy; 1993.
2. Kennedy G, Burlingame B. Analysis of food composition data on rice from a plant genetic resources perspective. Food Chemistry. 2003; 80(4):589-96.
3. Mohan BH, Malleshi NG, Koseki T. Physico-chemical characteristics and non-starch polysaccharide contents of Indica and Japonica brown rice and their malts. LWT - Food Science and Technology. 2010; 43(5):784-91.
4. Ning H, Qiao J, Liu Z, Lin Z, Li G, Wang Q, et al. Distribution of proteins and amino acids in milled and brown rice as affected by nitrogen fertilization and genotype. Journal of Cereal Science. 2010; 52(1):90-95.
5. Nations. FFaAOotU. The state of food insecurity in the world. . 1999:Rome, Italy.
6. Silva MVe. Arroz. Lisboa, Portugal: Fundação Calouste Gulenkian; 1969. 7. Jayamani P, Negrao S, Martins M, Macas B, Oliveira MM. Genetic relatedness of Portuguese rice accessions from diverse origins as assessed by microsatellite markers. Crop Sci. 2007; 47(2):879-86.
8. Amorim R. Da mão à boca: para uma história da alimentação em Portugal. 1987.
9. Company N. ARROZ- Qual a evolução no YTD 11? ; YTD 11 (year to date for 2011)
10. INE. Balanços de Aprovisionamento de Produtos Vegetais: Consumo humano de arroz branqueado e semibranqueado per capita (kg/ hab.) por Comprimento do grão Anual 2010/2011. INE; 2012. [actualizado em: 03.02.2012].
Disponível em:
http://www.ine.pt/xportal/xmain?xpid=INE&xpgid=ine_indicadores&indOcorrCod=0 000186&contexto=bd&selTab=tab2.
11. FAOSTAT. Food Balance Sheets - Portugal 2007. 2012. Disponível em:
http://faostat.fao.org/site/368/DesktopDefault.aspx?PageID=368#ancor.
12. Press NA. In: Dietary Reference Intakes for Energy, Carbohydrate, Fiber, Fat, Fatty Acids, Cholesterol, Protein, and Amino Acids (Macronutrients). United States of America; 2005.
13. Chung H-J, Liu Q, Lee L, Wei D. Relationship between the structure, physicochemical properties and in vitro digestibility of rice starches with different amylose contents. Food Hydrocolloids. 2011; 25(5):968-75.
14. Champagne ET. Rice starch composition and characteristics. In: World CF, editor. Rice starch composition and characteristics. 1996. 41, p. 833–38.
15. Institute IRR. Disponível em:
http://www.knowledgebank.irri.org/postproductioncourse/Additional/MilledRice/2._
Amylose_content.htm.
16. Lin J, Shi C, Wu M, Wu J. Analysis of genetic effects for cooking quality traits of japonica rice across environments. Plant Science. 2005; 168(6):1501-06. 17. Juliano BOaV, C. P. Grain Quality Evaluation of World Rices. 1993.
18. Lisiewska Z, Kmiecik W, Korus A. The amino acid composition of kale (Brassica oleracea L. var. acephala), fresh and after culinary and technological processing. Food Chemistry. 2008; 108(2):642-48.
19. Belitz H-Dea. Amino acids, peptides, proteins. In: Springer, editor. Food Chemistry. 4th ed. Berlin; 1999. p. 8-89.
20. Meharg AA, Sun GX, Williams PN, Adomako E, Deacon C, Zhu YG, et al. Inorganic arsenic levels in baby rice are of concern. Environmental Pollution. 2008; 152(3):746-49.
21. Rakesh Tuli DC, Prabodh Kumar Trivedi, Rudra Deo Tripathi. Recent advances in arsenic accumulation and metabolism in rice. Molecular Breeding. 2010; 26(SI: Quantitative Genetics and Plant Genomics/Guest Edited by P K Gupta, H S Balyan and R K Varshney):307-23.
22. Tripathi RD, Srivastava S, Mishra S, Singh N, Tuli R, Gupta DK, et al. Arsenic hazards: strategies for tolerance and remediation by plants. Trends in Biotechnology. 2007; 25(4):158-65.
23. Tuli R, Chakrabarty D, Trivedi PK, Tripathi RD. Recent advances in arsenic accumulation and metabolism in rice. Molecular Breeding. 2010; 26(2):307-23. 24. Alam MGM, Snow ET, Tanaka A. Arsenic and heavy metal contamination of vegetables grown in Samta village, Bangladesh. Science of The Total Environment. 2003; 308(1–3):83-96.
25. Meharg AA. Arsenic in rice – understanding a new disaster for South-East Asia. Trends in Plant Science. 2004; 9(9):415-17.
26. Rahman MA, Hasegawa H. High levels of inorganic arsenic in rice in areas where arsenic-contaminated water is used for irrigation and cooking. Science of The Total Environment. 2011; 409(22):4645-55.
27. Hossain MF. Arsenic contamination in Bangladesh—An overview. Agriculture, Ecosystems & Environment. 2006; 113(1–4):1-16.
28. Mandal BK, Suzuki KT. Arsenic round the world: a review. Talanta. 2002; 58(1):201-35.
29. Dwivedi S, Mishra A, Tripathi P, Dave R, Kumar A, Srivastava S, et al. Arsenic affects essential and non-essential amino acids differentially in rice grains: Inadequacy of amino acids in rice based diet. Environ Int. 2012; 46C:16-22.
30. AOAC. Official Methods of Analysis of AOAC International. Ed. t. method 92510. Maryland, USA.: AOAC International; 2005.
31. Megazyme. Amylose / amylopectine assay procedure. Ireland; 2011.
32. AOAC. Official Methods of Analysis of AOAC International. Ed. t. method 92053. Maryland, USA.: AOAC International; 2005.
33. Boogers I, Plugge W, Stokkermans YQ, Duchateau ALL. Ultra-performance liquid chromatographic analysis of amino acids in protein hydrolysates using an automated pre-column derivatisation method. Journal of Chromatography A. 2008; 1189(1-2):406-09.
34. WHO/FAO/UNU. Amino acid requirements of adults. In: series Wtr, editor. Protein and amino acid requirements in human nutrition : report of a joint FAO/WHO/UNU expert consultation. Geneva, Switzerland; 2007. 935, p. 135-81. 35. Consultation WFUE. Protein and amino acid requirements in human nutrition
2007.
36. Unnevehr BD, B. Juliano. Consumer demand for ricegrain quality. Ottawa, Canada: International Rice Research Institute, Manila Philippines and International Development Research Center; 1992.
37. Jayamani P, Negrão S, Brites C, Oliveira MM. Potential of Waxy gene microsatellite and single-nucleotide polymorphisms to develop japonica varieties
with desired amylose levels in rice (Oryza sativa L.). Journal of Cereal Science. 2007; 46(2):178-86.
38. Zhang WW, Liu SJ, Wang YH, Zheng LN, Liu F, Han XH, et al. A study of the in vitro protein digestibility of indica and japonica cultivars. Food Chemistry. 2010; 122(4):1199-204.
39. Zavareze Eea. Teor de amido resistente e perfil de textura de amino acidos de arroz com diferentes níveis de amilose modificados hidrotermicamente Brazilian Journal Food Technology. 2010; III:96-100.
40. Development OfEC-oa. Consensus document on compositional considerations for new varieties of rice (oryza sativa): key food and feed nutrients and anti-nutrients. Organization for Economic Co-operation and Development; 2004.
41. Academies IomoTN. Dietary Reference Intakes for Energy, Carbohydrate, Fiber, Fat, Fatty Acids, Cholesterol, Protein, and Amino Acids (Macronutrients) In: Press TNA, editor. Washingyon; 2005. p. 589-768.
42. Li X, He XY, Luo YB, Xiao GY, Jiang XB, Huang KL. Comparative analysis of nutritional composition between herbicide-tolerant rice with bar gene and its non-transgenic counterpart. Journal of Food Composition and Analysis. 2008; 21(7):535-39.
43. Wu JG, Shi C, Zhang X. Estimating the amino acid composition in milled rice by near-infrared reflectance spectroscopy. Field Crops Research. 2002; 75(1):1-7.
44. Hoseney RC. Principles of Cereal Science and Technology. In: Chemists AAoC, editor. Proteins. St. Paul, MN; 1986. p. 69-88.
45. Swartz ME. UPLC™: An introduction and review. Journal of Liquid Chromatography and Related Technologies. 2005; 28(7-8):1253-63.
46. Gillespie Mea. Further studies on lysine deficiency in rats. National Institute for Medical Research. 1954; 39:202-08
47. Brosnan JT, Brosnan ME. The sulfur-containing amino acids: An overview. J Nutr. 2006; 136(6):1636s-40s.
48. Doi M, Yamaoka I, Nakayama M, Sugahara K, Yoshizawa F. Hypoglycemic effect of isoleucine involves increased muscle glucose uptake and whole body glucose oxidation and decreased hepatic gluconeogenesis. Am J Physiol-Endoc M. 2007; 292(6):E1683-E93.
49. Métayer S, Seiliez I, Collin A, Duchêne S, Mercier Y, Geraert P-A, et al. Mechanisms through which sulfur amino acids control protein metabolism and oxidative status. The Journal of Nutritional Biochemistry. 2008; 19(4):207-15. 50. Development OfEC-oa. CONSENSUS DOCUMENT ON COMPOSITIONAL CONSIDERATIONS FOR NEW VARIETIES OF RICE (Oryza sativa): KEY FOOD AND FEED NUTRIENTS AND ANTI-NUTRIENTS. 2004.
51. Krause. Krause alimentos, nutrição e dietoterapia. 6ª ed. São Paulo: Editora Roca; 2005.
52. Williams PN, Villada A, Deacon C, Raab A, Figuerola J, Green AJ, et al. Greatly enhanced arsenic shoot assimilation in rice leads to elevated grain levels compared to wheat and barley. Environmental science & technology. 2007; 41(19):6854-59.
53. Zavala YD, Johnm. Arsenic in Rice: I. Estimating Normal Levels of Total Arsenic in Rice Grain
54. Francesconi KA. Toxic metal species and food regulations—making a healthy choice. The Royal Society of Chemistry. 2007; 132:17-20.
55. P. N. Williams MRI, E. E. Adomako, A. Raab, S. A. Hossain, IY. G. Zhu, J. Feldmann, A. A. Meharg Increase in Rice Grain Arsenic for Regions of Bangladesh Irrigating Paddies with Elevated Arsenic in Groundwaters
Environ Sci Technol. 2006; 40:903-4908.
56. Organization WH. Guidelines for drinking water quality. fourth edition ed.; 2011.
57. Casentini B, Hug SJ, Nikolaidis NP. Arsenic accumulation in irrigated agricultural soils in Northern Greece [Research Support, Non-U.S. Gov't]. The Science of the total environment. 2011; 409(22):4802-10.
58. Woolson EA. The persistence and chemical distribution of aesanilic acid in the soils.; 1975.
59. Masotti A, Sacco LD, Bottazzo GF, Sturchio E. Risk assessment of inorganic arsenic pollution on human health. Environmental Pollution. 2009; 157(6):1771-72.
60. Ng JC, Wang JP, Shraim A. A global health problem caused by arsenic from natural sources. Chemosphere. 2003; 52(9):1353-59.
61. Meharg AAR, M. D. M. Arsenic contamination of Bangladesh paddy field soils: Implications for rice contribution to arsenic consumption. Environ Sci Technology. 2003; 37:229-34.
62. Bank TW. 2011. Strategies to mitigate arsenic contamination of water
supply. Disponível em:
http://www.who.int/water_sanitation_health/dwq/arsenicun8.pdf.
63. Cheftel JCea. Aminoacids, peptides and proteins. 2nd ed. New York: Food Chemistry; 1985.
64. Singh N, Kaur L, Sandhu KS, Kaur J, Nishinari K. Relationships between physicochemical, morphological, thermal, rheological properties of rice starches. Food Hydrocolloids. 2006; 20(4):532-42.
Appendix
Appendix Index
Appendix A - Tables ... 1 Appendix B – Required equipment and reagents for used procedures ... 7 Appendix C – As preparation of dilute solutions and calibration curve ... 12
Appendix A - Tables
Table 2
Rice nutritional information (Values are presented as Mean ± standard
deviation) Moisture * Amylose ** Total Protein ** Arsenic *** Indica 13.25 ± 0.46 a 36.38 ± 6.57 a 7.67 ± 1.22 a 0.29 ± 0.15 a Japonica 12.79 ± 0.49 a 28.57 ± 4.49 b 7.29 ± 0.56 a 0.19 ± 0.23 a 2009 13.32 ± 0.42 a 36.79 ± 7.17 a 7.77 ± 1.32 a 0.30 ± 0.16 a 2010 12.90 ± 0.54 a 30.53 ± 3.13 a 7.08 ± 0.46 a 0.18 ± 0.25 a 2011 12.63 ± 0.32 a 27.97 ± 6.81 a 7.75 ± 0.32 a 0.26 ± 0.06 a Ribatejo 13.11 ± 0.32 a 33.57 ± 6.81 a 7.14 ± 0.32 a 0.19 ± 0.06 a Sado 12.96 ± 0.42 a 32.27 ± 6.88 a 8.16 ± 0.84 a 0.34 ± 0.16 a Total mean 12.40 ± 0.54 31.44 ± 7.14 7.14 ± 1.04 0.31 ± 0.20 Min 11.80 18.36 5.93 0.13 Máx 13.96 52.93 9.97 0.70 * g/100g; ** %dw; *** mg kg-1 dw
Values followed by the same letter for the same variable are not significant different (p<0.05) Table 1
Rice samples characterization Variety Crop place Crop year Number (n) Indica Ribatejo 2009 6 Ribatejo 2010 1 Sado 2009 3 Sado 2011 1 Japonica Ribatejo 2010 5 Sado 2010 1 Sado 2011 2
Table 3
Essential amino acid concentration (mg/g) comparision between diferente varieties, crop year and place (average ± standard deviation)
n His ILe Leu Lys SAA AAA Thr Val TOTAL EAA
Indca 11 2.04 ± 0.07 a 2.36 ± 0.11 a 5.42 ± 0.17 a 1.89 ± 0.28 a 1.59 ± 0.10 a 8.12 ± 0.54 a 1.91 ± 0.10 a 3.20 ± 0.18 a 26.53 ± 1.65 a Japonica 4 1.54 ± 0.24 b 2.03 ± 0.18 a 4.65 ± 0.14 a 1.42 ± 0.33 b 1.43 ± 0.13 a 6.58 ± 0.48 b 1.69 ± 0.08 a 2.81 ± 0.17 a 22.15 ± 1.49 b 2009 9 2.05 ± 0.07 a 2.40 ± 0.12 a 5.53 ± 0.18 a 1.93 ± 0.30 a 1.59 ± 0.11 a 8.18 ± 0.56 a 1.94 ± 0.10 a 3.26 ± 0.19 a 26.88 ± 1.74 a 2010 7 1.45 ± 0.25 b 1.98 ± 0.16 a 4.50 ± 0.13 a 1.29 ± 0.36 b 1.43 ± 0.10 a 6.29 ± 0.43 b 1.65 ± 0.06 a 2.73 ± 0.13 a 21.33 ± 1.25 b 2011 3 2.04 ± 0.12 c 2.14 ± 0.18 a 5.01 ± 0.19 a 1.95 ± 0.11 c 1.58 ± 0.12 a 7.92 ± 0.44 c 1.78 ± 0.12 a 2.96 ± 0.25 a 25.38 ± 1.65 c Ribatejo 8 1.73 ± 0.07 a 2.04 ± 0.11 a 4.69 ± 0.17 a 1.51 ± 0.31 a 1.44 ± 0.09 a 6.79 ± 0.43 a 1.68 ± 0.09 a 2.81 ± 0.16 a 22.70 ± 1.25 a Sado 7 2.01 ± 0.27 b 2.48 ± 0.19 b 5.71 ± 0.16 b 2.02 ± 0.26 b 1.67 ± 0.13 b 8.56 ± 0.61 a 2.03 ± 0.09 a 3.37 ± 0.21 a 27.86 ± 2.05 b Mean 0 1.84 ± 0.16 2.20 ± 0.15 5.07 ± 0.16 1.72 ± 0.28 1.53 ± 0.11 7.49 ± 0.50 1.81 ± 0.09 3.02 ± 0.19 24.69 ± 1.58 Values followed by the same letter for the same variable are not significant different (p<0.05)
Table 4
Non Essential amino acid concentration (mg/g) comparison between from different varieties, crop year and place (average ± standard deviation)
n Ser Arg Gly Glu Asp Ala Pro TOTAL NEAA
Indca 11 3.39 ± 0.17 a 6.17 ± 0.24 a 3.19 ± 0.12 a 13.20 ± 0.57 a 5.52 ± 0.37 a 3.48 ± 0.14 a 2.92 ± 0.11 a 37.86 ± 1.73 a Japonica 4 2.98 ± 0.14 a 5.22 ± 0.28 b 2.74 ± 0.16 b 11.71 ± 0.39 a 5.19 ± 0.24 a 3.12 ± 0.07 a 2.46 ± 0.06 b 33.42 ± 1.12 a 2009 9 3.46 ± 0.18 a 6.25 ± 0.24 a 3.22 ± 0.12 a 13.56 ± 0.59 a 5.69 ± 0.38 a 3.56 ± 0.15 a 2.96 ± 0.12 a 38.69 ± 1.79 a 2010 7 2.87 ± 0.12 b 5.01 ± 0.25 b 2.66 ± 0.17 a 11.16 ± 0.46 a 5.03 ± 0.24 a 3.03 ± 0.08 a 2.39 ± 0.05 b 32.16 ± 1.11 a 2011 3 3.22 ± 0.14 c 6.00 ± 0.27 c 3.08 ± 0.09 a 12.40 ± 0.32 a 4.98 ± 0.28 a 3.21 ± 0.07 a 2.69 ± 0.06 c 35.58 ± 1.23 a Ribatejo 8 2.96 ± 0.16 a 5.29 ± 0.24 a 2.78 ± 0.15 a 11.52 ± 0.53 a 5.03 ± 0.30 a 3.10 ± 0.11 a 2.51 ± 0.09 a 33.19 ± 1.44 a Sado 7 3.62 ± 0.14 b 6.55 ± 0.26 b 3.36 ± 0.11 b 14.15 ± 0.44 b 5.86 ± 0.34 a 3.67 ± 0.10 a 3.05 ± 0.07 b 40.26 ± 1.47 b Mean 0 3.21 ± 0.15 5.78 ± 0.25 3.00 ± 0.13 12.53 ± 0.47 5.33 ± 0.31 3.31 ± 0.10 2.71 ± 0.08 35.88 ± 1.41
Table 5 Rice Protein Digestibility Corrected Amino Acid Score by variables«
His ILe Leu Lys SAA AAA Thr Val
Rice protein Indica 1.81 1.02 1.19 0.56 0.96 2.82 1.08 1.06 0.56 Japónica 1.40 0.92 1.08 0.43 0.89 2.35 1.00 0.99 0.43 2009 1.80 1.03 1.21 0.56 0.94 2.82 1.09 1.08 0.56 2010 1.36 0.93 1.06 0.40 0.87 2.53 1.00 0.96 0.40 2011 1.77 0.92 1.10 0.56 0.93 2.70 1.00 0.99 0.56 Ribatejo 1.71 0.97 1.13 0.50 0.91 2.67 1.03 1.01 0.50 Sado 1.65 1.01 1.19 0.55 0.94 2.80 1.08 1.06 0.55 Mean 1.64 0.98 1.14 0.50 0.93 2.62 1.05 1.03 0.50
Table 6 Amino acid correlation coefficient and method parameters
AA CV (%) Method parameters Z- score LOD (mg/g protein) LOQ (mg/g protein) R2 Ala 3.35 0.32 0.09 0.16 0.9989 Arg 4.31 0.63 0.18 0.55 0.9975 Asp 5.86 2.11 0.15 0.44 0.9964 Cys 17.88 0.62 0.17 0.52 0.9932 Glu 4.00 0.83 0.15 0.52 0.9973 Gly 4.42 1.04 0.15 0.46 0.9988 His 7.83 0.96 0.15 0.46 0.9980 Ile 6.44 0.35 0.05 0.14 0.9997 Leu 3.21 0.84 0.07 0.20 0.9984 Lys 17.22 0.91 0.21 0.74 0.9935 Met 6.65 0.84 0.11 0.33 0.9989 Phe 5.22 -0.20 0.17 0.51 0.9968 Pro 3.21 0.44 0.04 0.13 0.9996 Ser 4.78 -0.46 0.05 0.13 0.9994 Thr 4.91 0.23 0.06 0.18 0.9994 Tyr 8.43 0.31 0.21 0.65 0.9967 Val 5.89 0.37 0.04 0.12 0.9996 Mean 6.68 0.12 0.37 0.9978
CV (%): Coefficient of variation; LOD: Limit of Detection; LOQ: Limit of Quantitation; R2: Correlation Coefficient
Table7
Pearson Correlation As-AA
His Ile Leu Lys SAA AAA Thr Val TEAA Ser Arg Gly Glu Asp Ala Pro TNEAA TAA
Pearson relation
Appendix B – Required equipment and reagents for used procedures
Amylose Equipment:
- Glassware: Volumetric flask (25 mL); glass test tubes (16 x 120 mm, 15 mL); screw capped sample tubes (Kimax®) (10 mL).
- Micro-pipettors, to dispense 50-1000 µL (e.g. Gilson
Pipetman).
- Positive displacement pipettor e.g. Eppendorf Multipette®. - Eppendorf® microfuge tubes (2.0 mL capacity).
- Boiling water bath.
- Bench centrifuge (capable of 2.000 g).
- Vortex mixer (e.g. IKA® Yellowline Test Tube Shaker TTS2). - Spectrophotometer (set at 510 nm).
- Stop clock.
- Analytical balance.
- Microfuge (capable of 14.000 g). - Thermostated water bath set at 40°C.
Reagents:
Besides Megazyme Kit (bottle 1 to 6), buffer and solvents: - Sodium Acetate Buffer (100 mM, pH 4.5)
Add 5.9 mL of glacial acetic acid (1.05 g/mL) to 900 mL of distilled water. Adjust the pH to pH 4.5 by the addition of 1 M (4 g/100 mL) sodium hydroxide solution (approx. 30 mL is required). Add 0.2 g of sodium azide and adjust the volume to 1 L. Stable for > 2 years at room temperature.
- Concentrated Con A Solvent (600 mM, pH 6.4 sodium acetate buffer)
Dissolve 49.2 g of anhydrous sodium acetate (Sigma cat. no. 71183), 175.5 g of sodium chloride (Sigma cat. no. S 7652), 0.5 g of CaCl2.2H2O (Sigma cat. no. C 5080), 0.7 g of MgCl2.6H2O (Sigma cat. no. M 2670) and 0.7 g of MnCl2.4H2O (Sigma cat. no. M 3634) in 900 mL of distilled water. Adjust the pH to 6.4 by dropwise addition of glacial acetic acid and then adjust the volume to 1 L with distilled water.
- Con A Solvent (working concentration)
Dilute 30 mL of Concentrated Con A Solvent to 100 mL with distilled water.
- Dimethyl sulphoxide (DMSO)
Analytical reagent grade (BDH Analar cat. no. 10323).
Total protein Equipment:
- Analytical balance with a resolution of 0.0001 g. - Tecator Kjeltec equipment.
- Volumetric flasks.
- Automatic Titrator "Titrando 808” - 300 ml erlenmeyer flasks
- 5 mL pipette calibrated - 250 mL digestion tubes
- Electric oven set at 102 º C ± 2 ° C
Reagents:
- Concentrated sulfuric acid - 95-98% (H2SO4, r20 = 1.84
g/cm3).
Commercially available in the form of tablets: 3.5 g K2SO4 + 0.4 g CuSO45H
- Boric acid, at 4
- 1L flask. Complete the volume. Measure and record the pH. - Solution of sodium hydroxid at 40
- Solution of 0.1 N HCl or H
- Tryptophan (98.5%) (C11H12182.65 g/mol) - Ammonium sulfate (99.5%) (NH)
- Solution of de (NH4)2SO4 1.2% (m/v). - pH 4.0 and 7.0 standard solutions
Amino acids
Material and equipment:
- Ultra Performance Liquid Chromatography of ACQUITY™ UPLC® (Waters) system equipped with a photodiode array
detector (DAD) with a pre-column derivatisation 6-N-aminoquinolil hidroxisuccinimidilcarbamate
- BEH C18 column (100 mm × 2.1 mm. Diameter, 1.7 mM particle) certified by Waters.
- Microwave, model brand a Milestone Ethos. - Analytical balance with a resolution of 0.0001 g. - 5 and 10 mL volumetric flask
- Small aliquots.
- Calibrated micropipettes, fixed and variable volume and respective ends.
- Filters - 10 mL flask
- Glass tube and its lid.
. Kit AccQ-Tag Chemistry Kit including: Waters Amino Acid Hydrolysate standard; Waters AccQ Flúor Borate Buffer; Waters AccQ Flúor Reagent Powder; Waters AccQ Flúor Reagent Diluent; AccQ-Tag Ultra Eluente A; AccQ-Tag Ultra Eluente B. . D-Norvaline - 99% purity
. HPLC grade acetonitrilo
. Hydrochloric acid fuming 37%, (p.a.) . Pure phenol (Crystal)
. Sodium hydroxide lentils, (p.a.)
. Ultra Pure water – Milli-Q (18-megaohm)
Arsenic
Material and equipment
- Calibrated micropipets, fixed and variable volume and respective ends.
- Centrifuge tubes from 10 to 50ml, PFA or PP.
- PFA bottles of various volumes - Volumetric flasks, PFA
- Beakers, PFA and PP, multivolume - Test tubes, PP or PFA, several volumes.
- Analytical balance with a resolution of 0.0001 g - Funnels, PFA or PP.
- On-line system for internal standard addition - Microwave
- ICP-MS - Acids distiller. - Traceclean.
Reagents and standards
- Ultra Pure water – Milli-Q (18-megaohm)
- Nitric acid (HNO3)
- Standard solutions for calibration and internal quality control: Pattern may be multielement or monoelementares solutions. The concentration should preferably be 1000 mg L-1, but may be different. Ideally, these solutions must be stabilized in HNO3. The standard solutions used for internal quality control (IQC) must be independent of the standard solutions used for the calibration curve. In order to ensure this independence, the solutions should be from different brands or, if from the same tag cannot be the from the same batch.
- Internal standard solution (PI)
The concentration of elements in the sample chosen as internal standard should be negligible and cannot be present in the standards referred to before.
Rhodium was used as internal standard. A commercial solution of internal standard should be monoelementar. All solutions prepared (samples, standard white, QC, etc.) shall
contain the same concentration as the internal standard. The internal standard can be added immediately before the reading of each solution, or added on-line system by applying the "T". In both situations, there is prepared a solution of intermediate 1-1000 microg.L with the chosen elements which must be stored in a bottle or flask of PFA. To add the IP individually add 5 microg/kg of the intermediate solution to each solution prepared. When it is added on line prepares a solution of 15 microg/kg from the intermediate solution which is introduced before reaching the nebulizer.
- White
The solution containing white water and the same amount of acid and internal standard the calibration solution
- Optimization of the product solution, 10 æg (tune A)
Appendix C – As preparation of dilute solutions and calibration curve
Table 1
Preparation of dilute solutions Inicial concentration (µg/l) Final concentration (µg/l) Standard Volume (µl) Water volume (µl) Final volume (ml) 100 000 500 50 9950 10 250 9750 50 10 000 500 500 9500 10 2500 7500 50
Table 2
Calibration curve (final volume 50 ml): Curve point (µg/l) Standard Volume (µl) Water volume (µl) 0 0 50.000 0.25 25 49.975 0.5 50 49.950 1 100 49.900 2.5 250 49.750 5 500 49.500 10 1000 49.000 20 2000 48.000 30 3000 47.000