FACULDADE DE CIÊNCIAS
DEPARTAMENTO DE ENGENHARIA GEOGRÁFICA, GEOFÍSICA E ENERGIA
Refurbishment measures versus geothermal district heating
for residential buildings in the Netherlands
João Francisco Andrade da Silva Pinto
Mestrado Integrado em Engenharia da Energia e Ambiente
Dissertação orientada por:
Professor Doutor Guilherme Carrilho da Graça (FCUL)
Com a descoberta do maior reservatório de gás natural da Europa nos anos 60, a Holanda tornou-se desde então um dos maiores produtores e exportadores europeus deste recurso. Hoje, mais de metade do gás natural dessa fonte foi utilizado e a necessidade de redução energética torna-se cada vez mais aparente.
A área dos edifícios residenciais é das que mais consome gás natural. Actualmente, 96% de todas as habitações estão conectadas à rede de gás natural, mais de 60% da electricidade provém de fontes de produção a gás e praticamente todos os edifícios residenciais com aquecimento central utilizam gás natural. Devido a esses factores, o interesse numa transição energética para um recurso mais sustentável tem vindo a crescer, nomeadamente usando energia geotérmica. Neste trabalho, o recurso à geotermia é comparado com a aplicação de medidas de eficiência energética em habitações na cidade de Groningen, onde se insere um dos maiores projetos para o desenvolvimento de uma rede de distribuição de calor geotérmico.
Assim, procedeu-se à simulação térmica de dois edifícios residenciais típicos da cidade antes e depois de serem remodelados, de forma a igualar o atual consumo dos mesmos ao valor simulado, e de modo a saber-se que poupança energética resultaria das medidas de eficiência energética aplicadas. Esta abordagem é então comparada ao recurso à geotermia não só do ponto de vista de energia poupada mas também dos custos associados a cada uma das metodologias para redução de consumo de gás natural.
Palavras-Chave: Simulação térmica, eficiência energética, energia geotérmica, remodelação de
With the discovery of the largest natural gas reservoir in Europe in the 60s, the Netherlands has become one of the leading natural gas exporters and producers in the continent. Today, more than half of the natural gas from that source is depleted and the need for an energy reduction approach becomes more and more necessary.
The residential buildings sector is responsible for one of the highest natural gas consumption shares. Currently, 96% of all households are connected to a natural gas grid, over 60% of electricity comes from gas-fired generation and almost all space heating comes from natural gas. Thus, interest in an energy transition to a more sustainable resource has been increasing, particularly with the use of geothermal energy.
In this work, the use of geothermal energy is compared to the application of energy efficiency measures in homes in the city of Groningen, where one of the largest projects for the development of geothermal heat distribution network is taking place.
A thermal simulation of two typical residential buildings in the city before and after being refurbished was performed, so that their current gas consumptions and their simulation values could be match, and in order to find out what energy savings would result from the refurbishment measures applied. This approach is then compared to the use of geothermal energy not only in terms of the amount of energy saved but also in terms of the costs spent.
Contents
Resumo ... ii
Abstract ... iii
List of Figures ... vi
List of Tables ... vii
1. Introduction ... 8
1.1. Residential energy use and efficiency in the Netherlands ... 9
1.2. Geothermal district heating in Dutch homes ... 10
1.3. The Groningen geothermal grid project ... 10
1.4. Research Aim ... 11
1.5. Research questions ... 12
1.6. Relevance ... 12
1.7. Structure of the Thesis... 13
2. Fundamental concepts ... 14 2.1. Heat transfer ... 14 2.1.1. Conduction ... 14 2.1.2. Convection ... 14 2.1.3. Radiation ... 15 2.2. Insulation ... 15 2.3. Infiltration ... 16 2.4. Energy systems ... 17
2.4.1. Mechanical ventilation with heat recovery ... 17
2.4.2. Boilers ... 18
2.4.3 Geothermal ... 19
2.5. EnergyPlus ... 20
3. Case study ... 23
3.1. Buildings representativity and description ... 23
3.1.1. High-rise building ... 24
3.1.2. Townhouse building ... 24
3.1.3. Measured buildings energy consumption ... 25
3.3. Building Materials ... 27
3.4. Infiltration ... 29
3.5. Heating equipment ... 29
3.6. Occupant behavior model ... 30
3.6.1. Heating use ... 31
3.6.2. Natural ventilation ... 31
3.6.3. Internal gains ... 32
4. Refurbishment measures ... 34
4.2. Increasing the airtightness ... 36
4.3. Replacing the boiler ... 36
4.4. Improving occupant behavior ... 36
5. Building thermal simulation ... 37
5.1. Weather file ... 37
5.2. Buildings geometry ... 37
5.3. Simulation and building parameters ... 38
5.4. Energy consumption simulation ... 39
5.4.1. Calibration procedure ... 40
5.4.2. Energy performance before refurbishments ... 41
6. Results ... 44
6.1. Energy performance after refurbishments ... 44
6.2. Overheating risk ... 46
6.3. Cost of energy refurbishment measures ... 48
6.4. Full Initial Engagement ... 51
6.5. Phased engagement ... 54
7. Conclusions ... 56
8. References ... 58
List of Figures
Figure 1- Energy labels for households in the Netherlands. ... 9
Figure 2 - Structure of this work. ... 13
Figure 3 - Types of MVHR systems for residential buildings (figure modified from [31]). ... 18
Figure 4 – Simplified diagram of a condensing boiler [33]. ... 18
Figure 5 - Types of geothermal energy systems... 19
Figure 6 - Geothermal district heating process and its components. ... 20
Figure 7 - Work phases on EnergyPlus. ... 21
Figure 8 – a. High-rise building; b. Floor plan of the apartments in the high-rise building. ... 24
Figure 9 - a. Townhouse building; b. Floor plan of the apartment in the townhouse building showing the ground floor, first floor, and attic... 25
Figure 10 – Energie in beeld software display showing the gas consumption for several buildings in Groningen. The buildings circled were the ones used to calculate average natural gas consumptions for typical high-rise and townhouse apartments... 26
Figure 11 - Average time use in the Netherlands during weekdays (in the left) and weekend days (in the right). ... 32
Figure 12 - Time spent at home and outside by the Dutch population. The figure in the left depicts weekdays and the right weekends. ... 33
Figure 13 - Simulation architecture for the high-rise and townhouse apartments... 37
Figure 14 - Thermal blocks multiplying factor for the high-rise (a.) and townhouse (b.) buildings.39 Figure 15 - Monthly heating demand for the high-rise and townhouse apartments with the corresponding average dry bulb temperatures. ... 41
Figure 16 - Yearly heat losses in the high-rise and townhouse apartments. ... 42
Figure 17 - Relation between infiltration and natural ventilation (NV) losses and wind speed. ... 43
Figure 18 - Heat losses before and after refurbishments in the high-rise apartment. Columns with a B represent heat losses before the refurbishments and columns with an A denote heat losses after the refurbishments. ... 45
Figure 19 - Heat losses before and after refurbishments in the townhouse apartment. Columns with a B represent heat losses before the refurbishments and columns with an A denote heat losses after the refurbishments. ... 46
Figure 20 - Operative temperatures range before and after the refurbishments in the high-rise and townhouse dwellings. ... 47
Figure 21 - Indoor operative temperatures and thermal comfort lower and upper limits according to ASHRAE Standard 55-2013 [88]. Only zones reaching the highest temperatures are considered, which are the Living Room and Bedroom A in the high-rise and the Living Room and Bedroom South in the townhouse. ... 48
Figure 22 - Energy consumption for the three scenarios considered. The first scenario reflects the whole 10.000 homes following a business as usual model with the mandatory upgrades being implemented at a 5%/year rate. The second scenario considers that the whole household sample is refurbished in the first year with a 5%/year boiler replacement rate during the following years. The last scenario has the same characteristics as the latter, with an added energy efficient occupant behavior (OB). ... 52
Figure 23 - Energy savings caused by the phased engagement to the geothermal source or to the refurbishment measures compared to those in the full initial engagement. ... 55
List of Tables
Table 1 - Predicted costs for the deployment of a geothermal district heating grid in Groningen. .. 11
Table 2 – Number of buildings (x1000) per archetype in Groningen. 2 under 1 roof are terraced houses with one apartment above the other; corner houses are apartments located at the corner of a street; flat apartments are located in medium and high-rise buildings [41]. ... 23
Table 3 - Number of buildings (x1000) per construction year in Groningen [41]. ... 23
Table 4 – Number of apartments (x1000) per their amount of bedrooms in Groningen [41]. ... 24
Table 5 – Yearly gas consumption in the high-rise and townhouse buildings divided by their number of apartments. ... 26
Table 6 – Correlation between the different building group consumptions. ... 27
Table 7 - Normalized indicators for the high-rise and townhouse buildings. ... 27
Table 8 – High-rise building materials. ... 28
Table 9 – Townhouse building materials. ... 28
Table 10 – Typical boiler used in most of the dwellings from the 1970s in Groningen. ... 29
Table 11 – Radiator power per zone in the high-rise and townhouse apartments. ... 30
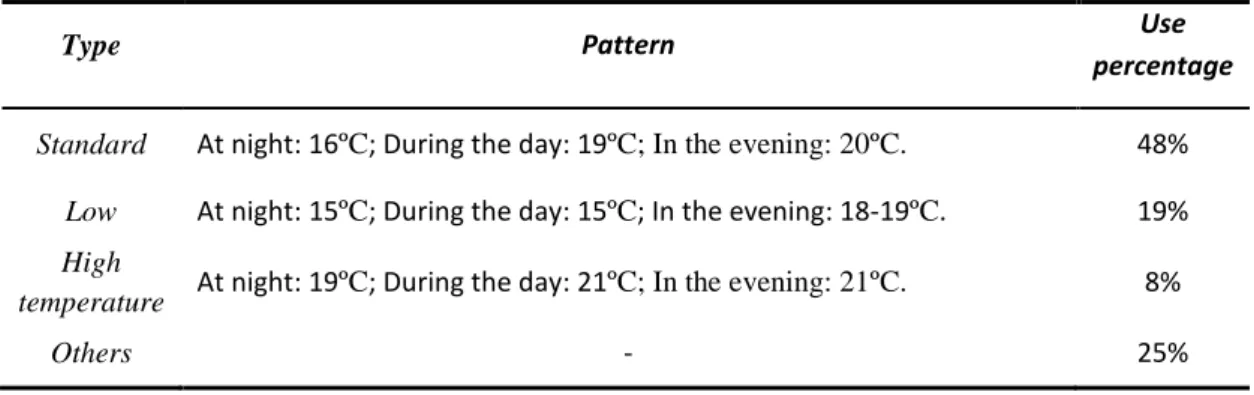
Table 12 – Used temperature patterns in the thermostat settings. ... 31
Table 13 - Typical occupant behavior on window-opening behavior in the Netherlands [59]. ... 32
Table 14 – Home and outside time distribution in the Netherlands. ... 33
Table 15 – Typical lighting and electric equipment use by the Dutch population [70]. ... 33
Table 16 - Overview of studies focused on heating energy consumption reduction in residential buildings. DEAP: Dwelling Energy Assessment Procedure – model developed by the Sustainable Energy Authority of Ireland to produce Energy Performance Certificates. IOA: Input-output analysis; I: Walls, roof and/or windows insulation; B: Boiler; V: Vegetated roof; I*: Infiltration; SS: Solar Shading; ST: Solar thermal hot water. ... 35
Table 17 – Current window opening behavior versus improved window opening behavior. ... 36
Table 19 – Floor area and glazing area per typology zone... 38
Table 20 – Simulated annual gas consumption for the high-rise and townhouse thermal blocks. ... 40
Table 21 - Actual and simulated annual gas consumption with the corresponding use distribution for space heating, hot water and cooking. ... 40
Table 22 - Centered high-rise and townhouse apartments total and heating annual gas consumption used for the case study. ... 41
Table 23 - Annual gas consumption reduction through each refurbishment measure phase. ... 44
Table 24 - Change in the annual heat losses after all measures were implemented. ... 45
Table 25 - Summary of the refurbishment measures considered in this study. ... 49
Table 26 - Costs used, energy saved and payback time in regards to each refurbishment measure. Cost and energy values rounded. ... 50
Table 27 - Measures and geothermal approaches’ gross costs (in Euros) during the whole case study. The running costs considered on the measures side account for the gas demand with no changes in occupant behavior, while on the geothermal side account for the OPEX costs for the 40-year period. Total costs are related to a single dwelling, while overall costs reflect the communal investment. ... 53
Table 28 - Running costs with changes in occupant behavior in the refurbishment measures approach. Total costs comprise the sum of these costs with the initial and reinvestment costs. ... 54
Table 29 – Business as usual natural gas consumption and total costs for single high-rise and townhouse dwellings during the 40-year period. ... 54
1. Introduction
Over the last decade the Netherlands became the leading natural gas trading hub in Europe and the second highest natural gas producer, following Norway [1]. The largest natural gas field in Europe is located in the Netherlands, being the country’s main energy source [2-3]. This gas reserve is being explored since 1963 in the city of Groningen and, by now, more than half of its capacity has been used. At current consumption rate this reserve will be depleted in the next 50 years [4] and there is need to develop alternative energy sources or reduce consumption by increasing energy efficiency.
The Dutch Administration has thereby set a maximum allowance for total production from the field as of 2015, which was also driven from seismic activity linked to gas extraction [5]. Hence, natural gas prices are expected to rise over the next decades and upcoming reductions in production will cause the Netherlands to change from a net exporter of gas to a net importing nation [6]. Furthermore, concerns over climate change and greenhouse gas emissions resulted in targets of 60% reduction in building energy consumption by 2050 [7]. Reducing natural gas consumption by expanding the energy sources, increasing renewable energy use and applying energy refurbishment measures are crucial to materialize the current Dutch energy transition.
In the Netherlands, the residential sector accounts for the second largest share of natural gas use (22%), only surpassed by the transformation sector [4]. Moreover, 96% of all households are connected to gas supplies, over 60% of electricity is from gas-fired generation and almost all space heating comes from natural gas sources [8]. The potential to reduce natural gas demand from the building sector is immense. According to a recent study [9], the built environment has the highest potential for increased energy efficiency: nearly 42TWh per year could be saved worldwide up to 2020. The same study shows that average residential gas consumption in the Netherlands represents 79%, 19% and 2% for space heating, domestic hot water and cooking respectively, clearly, reducing the energy needs for space heating is a priority. In total, a Dutch dwelling uses on average 3.5MWh electricity and 1500m3 gas every year [9]. Thus, interest in finding solutions to reduce heating demand in residential buildings has been increasing not only in the Netherlands but also worldwide [10], mostly by improving the buildings skin in its insulation and infiltration values, by replacing the boiler to a more efficient one, by installing heat recovery systems or by using renewable technologies such as solar or geothermal energy.
In this study, two energy reduction approaches in terms of energy savings and costs for a time period of 40 years in the city of Groningen were compared. The first approach is to implement refurbishment measures focused on lowering heating demand in typical Dutch homes, while the second is to connect those homes to a geothermal grid, where the heat is transferred from an underground aquifer to the individual heaters inside the dwellings. This comparison centers on what is more beneficial to homeowners from individual and communal perspectives, both in terms of energy savings and costs.
Groningen is the largest province and eponymous city in the north of the Netherlands, having currently nearly 200.000 inhabitants and a total area of 83.75km2. In the last few years, the municipality of Groningen has been strongly supporting and encouranging the application and expansion of new renewable heat applications, with the main ambition of making Groningen an energy neutral city by 2035. However, due to the high number of buildings in the city that could be
renovated and significantly decrease their gas demand for heating, a different path could be taken into achieving the zero energy goal. Therefore, Groningen is ideal for our case study.
1.1. Residential energy use and efficiency in the Netherlands
In the Netherlands, the residential sector accounts for the second largest share of natural gas use (22%), only surpassed by the transformation sector [1]. However, there has been a decline on average residential gas consumption over the years, having the average annual gas demand per dwelling in the past decades fallen sharply from about 2200m3 in 1995 to about 1500m3 in 2012. It is also expected to be further reduced to approximately 1350m3 by 2020 [5]. These reductions are due to the increasing use of energy efficient appliances and improved building insulation, along with a higher share of renewable energy which as incremented from 1.4% to 4.5% over the past decade. Nonetheless, this value is still way below the 14% renewable energy goal agreed with the European Union (EU) by 2020. In addition, there is still a long way to go if all households are to be converted into energy neutral ones by 2035.
Since the beginning of 2015, the Energy Performance Coefficient (EPC) – which is an instrument used by the government to lower CO2 emissions consisting of minimum norms for new to-be-built buildings – was reduced to 0.4, which is a value that substantially requires a high energy performance of new homes [5]. Related to the EPC is the Energy Label (EL) each building must have, which shows the energy efficiency of a building by rating it from A to G (to keep up with advances in energy efficiency, A+, A++, A+++ and A++++ were later introduced) - Figure 1 shows a relation between the EPC and the EL [11]. For instance, dwellings built before the 21st century that have not been renovated are typically rated between the B and G marks, which are clearly
far from the 0.4 EPC level. Homes with a higher EL are evidently preferable, since more energy efficient homes means lower energy bills, more comfort and less CO2 emissions, becoming also more attractive to potential buyers or tenants than less energy efficient homes. Hence, investing in energy-saving measures is an incentive [12].
In order to improve the energy efficiency of a building, several measures are usually implemented in the Netherlands, by using mature technologies in terms of insulation, lighting, and heating. Usually, improvements in insulation account for not only the walls and the floor but also the roof. However, it is crucial to have in mind that dwellings in the Netherlands are not regularly equipped with air conditioning or any other active cooling system. Considering the effects of climate change over the next decades [6], it is imperative that these improvements are adaptive to such reality so overheating inside the buildings can be prevented. In terms of lighting, using CFL’s or LED’s is also a better choice, since they use little energy compared to other types (such as incandescent lamps). There are also several ways to improve the heating efficiency either by using solar energy or by having highly efficient boilers [9]. Lately, the number of buildings using solar-powered heat sources has also increased and has been growing anually, being one of the few European countries who have a positive annual growth in the last few years [13].
Figure 1 – Energy labels for households in the Netherlands.
Figure 1- Energy labels for households in the Netherlands.
1.2. Geothermal district heating in Dutch homes
As previously mentioned, demand for heat in the Netherlands is a major factor in the Dutch energy sector, representing the most dominant energy function in Dutch dwellings nowadays and accounting for 40% of national energy output (over 300GWh per year) [14-15]. Therefore, implementing a system for distributing heat for residential and commercial requirements in a stable, sustainable, renewable and carbon neutral manner appears as the ideal option for the upcoming goals set by the Dutch government. Moreover, this technology would diminish the high number of earthquakes caused by extracting gas, which has been a problem for the last decades in the Netherlands [16].
Interest in deep geothermal energy arose since it started being used to heat greenhouses in a few places, but the risk of unsuccessful drilling limited its possibilities since a large part of the costs come from deep underground drilling [17]. Nonetheless, deep geothermal energy is already economically feasible and used where aquifers can be found near the surface in a district heating network for different types of heat. On the other hand, shallow geothermal energy is currently less costly and already established for offices, horticultural greenhouses and new buildings [17]. According to [5], the number of Stimulation of Sustainable Energy Productiona applications for geothermal projects increased significantly and the consumption of renewable heat has also been rising in the Netherlands. There are already 13 large district heating networks with over 227 thousand homes connected [18]. For instance, a 44MW biomass-to-heat facility was installed in Purmerend to replace a combined cycle natural gas plant and to provide district heating to 25.000 homes, reducing natural gas demand in 30 million cubic meters per year [19]. Direct use of geothermal heat is also being developed in The Hague (4000 homes) and three doublets have already been planned to be built in Delft and Pijnacker [20].
1.3. The Groningen geothermal grid project
According to the municipality of Groningen, the city’s annual use of natural gas equivalentsb accounts for 305 million m3. Assuming that, following the national trend, half of this energy is used for heat generation, about 100 million euros are being spent every year on this sector only [21]. Hence, considerable savings regarding heat can truly be made and have an impact in the overall gas consumption in the Netherlands.
In the city of Groningen, a wide variety of locations are appropriate for the use of geothermal heat. One of those locations is in the northwest of the city, which has led to the start of a project between the municipality of Groningen (WarmteStad BV) and Groningen’s water company to deploy a geothermal district heating grid. At this point, the business case has already been carried out and demonstrates that district heating in the northwest can be a success. It is estimated that the energy will be extracted from a water bearing sandstone at a depth between 2750-3200m with temperatures ranging 120-125ºC [22]. The geothermal grid is expected to provide heat to 10.000
a
The Stimulation of Sustainable Energy Production (SDE+) is an operating grant where producers receive financial compensation for the renewable energy they generate. Since renewable energy production is usually not profitable, differences in cost compared to fossil fuels are compensated by the SDE+ for a fixed number of years.
b
homes and buildings to the nearby neighborhoods and is planned to be completed in 2017 -
Appendix I displays a map of the project. The effect of no longer having gas demand for space
heating and hot water in these households would reduce greenhouse gas emissions in about 15.000 tons of CO2.
The estimated costs for the capital and operational expenditures account for 51 million euros and 2.55 million euros respectively. The capital expenditure (CAPEX) represents the double and grid construction costs plus the surface installation costs, while the operational expenditure (OPEX) refers to the yearly maintenance and electricity consumption costs. There are also projected costs for homeowners who do not want to participate in the investment, represented in Table 1. These include the cost to connect to the grid, the yearly fee and tariff for metering, and the heat price per kWh consumed.
Table 1 - Predicted costs for the deployment of a geothermal district heating grid in Groningen. *: Yearly costs.
CAPEX 51 M€ OPEX* 2.55 M€ Cost for new connections 963€
Connection fee* 276€ Tariff for metering* 150€ Heat price* 0.9x(Gas
cost)
1.4. Research Aim
Having in mind that current natural gas stocks in the Netherlands have already led to an energy production equivalent to more than half their capacity and that the need to reduce CO2 emissions accentuates over the years, more renewable and carbon neutral energy carriers are needed so that a sustainable energy transition can be made.
Geothermal district heating appears as a possibility to not only help reduce natural gas dependence and greenhouse gas emissions but also to lower the energy cost that is currently being afforded for space heating and hot water in households. At the same time, it is now required that new homes follow high energy efficiency standards so that their footprint and energy consumption are minimized. It is also advantageous for old dwellings to be upgraded, since investing in energy-saving measures makes them more attractive to potential buyers or tenants, and more and more owners are starting to follow this trend. For those reasons, households are expected to change over time towards higher energy efficiency, which can have an impact on the heat grid.
Hence, the research aim of this study is: “To compare whether it is more feasible for homeowners to go for better energy labels by refurbishing their homes or to connect their dwellings to a geothermal district heating grid”.
1.5. Research questions
The research aim of this study leads to the core research question: “Is it more feasible for homeowners to go for better energy labels by refurbishing their homes or to connect their dwellings to a geothermal district heating grid?”.
Following the main research question, other sub questions have been identified:
1) What type of residential buildings are the most suitable to be refurbished in Groningen? There are approximately 77 thousand apartments in Groningen, distributed through different building typologies such as detached, semi-detached, high-rise and townhouse buildings, all built between the 19th and the 21st century. It is then crucial to find what the most representative dwellings with the need for refurbishment measures are in the city.
2) What are the most appropriate refurbishment measures to be done in typical Dutch homes? Having in mind not only the refurbishments that are usually implemented in the Netherlands but also others that are commonly used in Nordic countries and are suitable for Dutch homes, thoroughly choosing the ideal measures to implement is an important step to optimize the apartment’s energy need.
3) How much energy can be saved by implementing the refurbishment measures or by connecting the homes to the geothermal grid?
Reducing natural gas consumption is the main goal of this study. Therefore, assessing how much energy can be saved by each approach and which saves the most energy can influence the homeowners and investors decision, particularly on which is the most beneficial to achieve the goals set by the municipality of Groningen and the Dutch government.
4) What are the costs for either following a refurbishment or geothermal approach to homeowners?
The energy saved is one of the most relevant factors in decision-making yet not sufficient. The feasibility of each approach is also highly dependent on their cost, which is crucial for a project to move forward. In this case, a much higher cost for one of the approaches can lead homeowners to admit the other.
1.6. Relevance
This research was initially proposed by WarmteStad, which is the company responsible for providing renewable heat in Groningen and in charge of the project taking place in the northwest of the city. Groningen’s Water Company and the municipality of Groningen are both fifty percent shareholders of WarmteStad.
This work serves as a complement for the energy transition that is currently being planned by the municipality, which is only focused on the implementation of the geothermal district heating grid. Therefore, this master thesis discusses a different way of achieving that energy transition, based on refurbishing the households into more energy efficient ones.
1.7. Structure of the Thesis
This Master Thesis is divided in six more chapters, as shown in Figure 2. Chapter 2 describes some of the fundamental concepts in heat transfer, serving as a basis to understanding the types of heat losses that occur in residential buildings. This chapter also defines insulation, infiltration, mechanical ventilation with heat recovery and boilers, since comprehending these concepts is crucial to understand the refurbishment measures that are further presented in this work. Also, a short explanation about EnergyPlus (the thermal simulation software used) is provided. Chapter 3 reflects the case study, emphasing on the residential buildings chosen and their energy consumption. Two typical Dutch buildings are considered based on current literature and statistical analysis, with the building materials, infiltration levels, heating equipment and occupant behavior all set for what represents the majority of buildings with the same typology in the Netherlands. Chapter 4 presents the refurbishment measures implemented in the two buildings. In Chapter 5, all information regarding the buildings thermal simulation is presented, from the weather file, geometry and simulation input parameters to the residential buildings simulation model applied. The results from the first simulation are presented in this chapter, in order to calibrate the dwellings natural gas consumptions and to assess their current energy performance. Chapter 6 discusses the simulation results obtained with the refurbishment measures implemented and whether or not these cause overheating indoors. The comparison between implementing these measures and connecting to the geothermal source is then debated from both energy saving and cost perspectives. In the last chapter, answers to the research questions are given.
2. Fundamental concepts
The fundamental concepts described in this chapter form the basis for the case study further presented in the document. These include the three heat transfer mechanisms; insulation and infiltration; mechanical ventilation with heat recovery, boilers and geothermal energy systems; and EnergyPlus.
2.1. Heat transfer
Heat transfer occurs when there is a temperature difference between two points until these reach thermal equilibrium. The direction of heat transfer is from the highest temperature point to the lowest, without any changes in the energy transferred (conservation of energy). There are three fundamental modes of heat transfer: conduction, convection and radiation. These heat transfer mechanisms are crucial to evaluate the performance of a building in its thermal behavior, so that the building itself and all energy systems installed can be optimized.
2.1.1. Conduction
Heat conduction happens when adjacent atoms and molecules collide against each other, or when electrons exchange from one atom to another. It is the most significant heat transfer mechanism within solids or between solids in thermal contact, since these have their atoms tightly bond to each other. Conduction also occurs in liquids and gases due to the vibrations caused by their random motion, leading to the collisions and diffusion of molecules [23].
Fourier’s law, also known as the law of heat conduction, states that a material’s heat flux density is proportional to the negative gradient in the temperature and to the area, where the heat flux density corresponds to the amount of energy flowing through a unit area per unit time:
𝑞′′𝑥= −𝑘
𝑑𝑇
𝑑𝑥 (1)
where:
q’’x is heat flux density [W/m 2
];
k is the material’s thermal conductivity [W/m.K];
𝑑𝑇
𝑑𝑥 is the temperature gradient [K/m].
2.1.2. Convection
Convective heat transfer occurs when the movement of fluids causes the transfer of heat from one point to another. It implies that both conduction and advection (heat transfer by bulk fluid flow) happen simultaneously, leading to the transfer of heat mostly between a solid surface and a fluid. Typically, the energy is transferred as sensible heat, where macroscopic variables such as volume and pressure remain unchanged, but it can also be transferred as latent heat where a phase change occurs [24].
In buildings, convection takes place between the building envelope and the air surrounding it, where a phase change might happen, causing air condensation. Water particles are then formed, and are usually visible in the windows. The convective heat flux is given by Newton’s Law of cooling:
𝑞′′𝑐𝑜𝑛𝑣= ℎ𝑐(𝑇𝑠− 𝑇∞) (2)
where:
q’’conv is the convective heat flux [W/m 2
];
hc is the heat transfer coefficient; Ts is the object’s surface temperature; T∞ is the fluid temperature.
2.1.3. Radiation
All matter with a temperature above the absolute zero (0K) emits thermal radiation, with the transmission being performed by electromagnetic waves generated by the thermal motion of charged particles in the substance. Radiation does not need the presence of matter to propagate, infinitely traveling in vacuum if unobstructed [23-24].
A surface with perfect absorptivity and emissivity at all wavelengths is characterized as a black body. The Stefan-Boltzmann law relates the power radiated from a black body to its absolute temperature. In the real world, the radiative transfer between two surfaces is influenced by their emissivity, following the equation:
𝑞𝑟𝑎𝑑= 𝜀σ(𝑇𝑎4− 𝑇
𝑏4) (3)
where:
qrad is the radiative heat flux [W/m 2
];
ε is the emissivity;
σ is the Stephan-Boltzmann constant; Ta is the surface a temperature [K]; Tb is the surface b temperature [K].
2.2. Insulation
Thermal insulation reduces heat transfer between two objects due to their temperature difference. Good thermal insulation always has poor thermal conductivity, thus having a high heat capacity. Therefore, the amount of energy needed to move from a low temperature to a high temperature increases. For that reason, the temperature gradient between both objects is smaller, and the heat transfer reduced.
Resistance to the transfer of heat is often expressed by a material’s R-value. The R-value is calculated by dividing the material’s thickness by its thermal conductivity, being expressed in m2K/W. The higher the value the better it works as an insulator. The R-value is also used when it is necessary to calculate the heat flux through materials in parallel, by adding the inverse of all the
adjacent layers R-values. U-values, which are the reciprocal R-values, are often used for systems that are made up of different materials, such as windows.These are calculated as the inverse of R, therefore the lower the U-value the more slowly heat is transmitted through the material. Hence, the R-value describes resistivity to heat, while the U-value defines thermal conductivity.
In cold climates, thermal insulation in buildings is an effective way to achieve thermal comfort for its occupants. There are two types of building insulation: bulk insulation and reflective insulation. The first blocks conductive heat transfer and convective flows, while the second serves as a radiant barrier that reflects infra-red energy from within the building. Several types of materials are used as bulk insulation, with the most common being spray foams, rigid panels, glass wools and natural fibers. These are typically added to the wall and roof cavities, or added as another layer to the wall and roof surfaces. As for the reflective insulation, materials such as foil, reflective painting and low emissivity coatings are usually used, which are often installed in the walls, roof and windows.
2.3. Infiltration
Infiltration can be defined as an uncontrolled air leakage across a building envelope, having a significant impact in the energy performance of a building. Its level is mainly influenced by the climate (mainly wind conditions) and the building structure such as the size of cracks [25-26]. The units of measurement usually used for infiltration are cubic meters per second (m3/s) and air changes per hour (ach). The first defines the volumetric flow rate of outside air into a building, while the second describes the air volume added or removed from a space divided by its volume. According to [27], measurement standards for building envelopes such as in the infiltration level are defined by the power law, which relates pressure differences and the corresponding leakage air flows:
𝑄 = 𝐶∆𝑃𝑛 (4)
where:
Q is the leakage air mass flow rate [m3/s];
C is the flow coefficient related to the size of the opening [m3/sPa];
ΔP is the pressure difference across the crack [Pa]; n is the flow exponent characterizing the flow regime.
In order to find out the leakage rate of a building, a blower door is installed to pressurize the building at a constant pressure (usually at 50Pa) or to depressurize the building to be 50Pa less than the exterior. Both tests are different and deliver different results, since the cracks are most of the times not pure and in places that are partially blocked. This means that, for instance, housewrap would be tight under negative pressure, but leak the other way around. These values are often described as ach50.
It should be noted that the calculated value does not correspond to an average infiltration rate during the year, since the obtained value widely depends on the weather conditions from when the tests were performed. Moreover, the infiltration rate also varies from location to location, both with site exposure and building height. For those reasons, an average infiltration rate is calculated by dividing the pressurization test result by a factor usually between 20 and 25 [28]. This factor varies depending on the location, with the highest corresponding to colder and windier climates. Thus, ach50 is converted to what is usually seen in literature as achnat.
A building with less than 0.6ach50 is considered extremely airtight, with airtightness within the Passive House requirements [29]. Buildings with airtightness between 3-5ach50 are considered typical and buildings with over 5ach50 are considered leaky.
2.4. Energy systems
2.4.1. Mechanical ventilation with heat recovery
Infiltration has a significant impact on heat energy consumption. For instance, ventilation and infiltration losses account for 48% of the energy consumption needed for space heating [30]. Moreover, air leakage can also increase moisture levels in the apartments, deteriorating building fabric or other materials inside the dwelling [31]. To avoid high levels of infiltration or/and moisturing issues, the buildings airtightness is increased. This is often achieved by installing mechanical ventilation with heat recovery (MVHR), which ensures that the necessary amount of fresh air to maintain indoor air quality is injected to the building at the lowest possible energy consumption [32].
MVHR works by continuously extracting the stale air from the home, where its heat is recovered via a heat exchanger located inside the heat recovery (HRV) unit. At the same time, fresh air from the outside draws into the property, passing through the heat exchanger where it is pre-heated before it is pumped to the inside. MVHR systems can be installed in three different ways: centralized, in a single room unit and in pair-wise units - Figure 3. The centralized system is mostly used for detached or townhouse dwellings, where the HRV unit is easily installed in the attic. In this case, a ductwork is needed to transport both supply and extract air. The single room unit is a decentralized system where each unit works as a small centralized system per room, providing and extracting air using two fans and a cross counterflow heat exchanger. The pair-wise units are also a decentralized system where each unit has a regenerative heat exchanger and an axial fan. It works in pairs, by having the first unit transporting the fresh air from the outside to the inside and the second unit extracting the air from the inside to the outside. Both decentralized systems are more suitable for high-rise apartments, since installing a centralized system in those building typologies is more complicated.
A centralized system has the drawbacks of higher pressure losses and harder installation procedures due to the ductworks, which also require some level of maintenance. However, it has the advantage of lower noise pollution and stack effects compared to decentralized systems, due to their location.
Figure 3 - Types of MVHR systems for residential buildings (figure modified from [31]).
2.4.2. Boilers
The most common heat generation method in households involves the combustion of natural gas in a boiler, which is then distributed in the dwelling by circulating the warmed up water through pipes in a loop. There are several types of boilers, with the most recurrent being conventional boilers (also known as regular boilers or open vent boilers) in older homes and condensing boilers in newer buildings [33].
In conventional boilers, natural gas is burned to heat the water, producing water vapour, carbon dioxide and other residues as by-products of the combustion reaction. Then, these gases escape through a flue to the outside atmosphere, as well as some of the heat generated in the boiler. In condensing boilers, these gases travel through a heat exchanger, where they are cooled down and condensed. The condensed fluid is then used to recover most of the heat that otherwise would have been lost – Figure 4. With this technology, up to 1200kg of carbon emissions a year can be avoided. State of art condensing boilers can reach theoretical efficiencies of 107%, being at least 25% more efficient than conventional boilers. However, since boilers are mostly used in conditions where optimum efficiency is not guaranteed, particularly during cold days where losses increase, the actual efficiency is a bit lower than the theoretical efficiency set by the manufacturers.
2.4.3 Geothermal
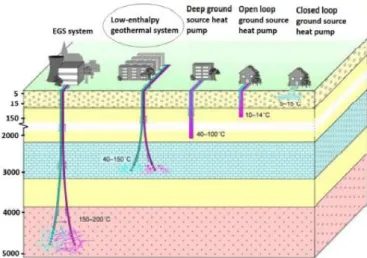
Geothermal energy is thermal energy derived from the Earth’s internal heat, generated from the radioative decay of isotopes in the earth’s core and from the planet’s formation [34]. The heat stored in the subsurface can reach temperatures up to 200ºC, being useful not only for the direct supply of heat but also for electricity generation. For that reason, different types of geothermal energy systems can be developed depending on the reservoir’s temperature – Figure 5 [35]. This study focus on low-enthalpy geothermal systems, where the temperature range is located between 40ºC and 150ºC. Nevertheless, Figure 5 shows other ways of using the geothermal heat. For instance, closed and open loop ground source heat pumps, with temperatures between 5ºC and 15ºC, are typically dedicated to single households, while deep ground source heat pumps, where temperatures range between 40ºC and 150ºC, are used for the connection to multi-storey buildings. On the other hand, the highest temperatures are used for electricity generation with Enhanced Geothermal Systems (EGS), where temperatures are located between 150ºC and 200ºC [34]. Low-enthalpy geothermal systems are better for the direct supply of heat, due to these being mostly low temperature. Thus, only heat generation and no electricity production are considered in the study. These systems are used to provide energy to neighborhoods for both space heating and hot water. Depending on the reservoir’s size they could last more than half a century [34]. The Groningen geothermal grid is an example of a low-enthalpy geothermal system.
A geothermal district heating system is characterized by three main components: the geothermal doublet, the heat distribution system and the customer [36]. The geothermal doublet comprises two wells drilled into the ground until they reach the reservoir’s depth, where the hot water is located. One of the wells is the production well, which is used to pump the hot water up from the aquifer with an electric submersible pump located inside the wellbore. [37]. The other well is used to pump the cold water back into the aquifer so that a closed loop between production and injection is created. Both wells are drilled in the same location but deviated along their depth 1.5-2km apart [36-38].
Figure 6 shows the geothermal district heating process of a low-enthalpy geothermal system [39]. After the hot water is pumped up from the aquifer, it goes through a heat exchanger where the heat is transferred to the fresh water used in the heat distribution network. The water extracted from the aquifer is not supplied to the customers due to its corrosive nature, where dissolved salts, heavy metals and possibly radioactive materials can be found in it. The fresh hot water is then piped to the consumers, which in this study are only residential buildings. Then, the cold water goes through a district heating return pipe where it is injected back into the ground [38]. The geothermal system is also composed by a back-up/peak-load system, which is used when an alternative energy source is needed due to either maintenance or technical issues, or when there is higher heat demand than the base load set (particularly during winter’s coldest days) [40]. Moreover, the heat distribution system is equipped with pumping stations to maintain water pressure, and with a secondary heat exchanger at the consumer, in case the network does not have a direct connection to the customers. The district heating network is insulated to diminish heat losses during transport, that fall between 15-40% depending on the network’s age, flow rate, distance, and pipe diameter. In state of the art district heating networks, heat losses reach values as low as 5% [35].
2.5. EnergyPlus
Thermal simulation tools allow us to analyze buildings thermal behavior and test energy efficiency measures before they are even built or implemented, by using models that have been developed in the last decades.
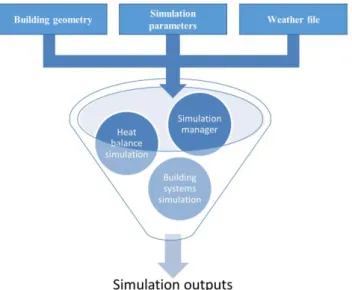
EnergyPlus is one of the few simulation tools that can be used to perform such calculations. It is a validated software developed by the United States Department of Energy that calculates heating and cooling loads according to highly detailed building parameters. It resulted from the combination of two other softwares: DOE-2 and Building Loads Analysis and System Thermodynamics (BLAST). Figure 7 depicts, in a simplified manner, the three main phases a user goes through to achieve the desired results.
In the first phase, the user has to input the building geometry, the simulation parameters and a weather file. Since EnergyPlus does not have a graphical interface, the building geometry has to be defined in a software that allows doing so. Thus, Google Sketchup was used along with the plugin Legacy OpenStudio that exports the geometry to EnergyPlus in a compatible format. Here, various zones in the apartment are divided in thermal zones, defining areas with similar thermodynamic properties. A weather file that adequately represents the climate surrounding the buildings is also required to perform the simulation. These files contain information about weather data in general that are crucial for the thermal calculations performed by the software. Several other parameters are needed for the simulation, such as the building orientation, the building materials, infiltration, occupancy, lightings, electric equipment, etc.
In the second phase, EnergyPlus calculates inside and surface heat balances assuming perfectly mixed air and uniform temperature conditions in each thermal zone. The software has three main components: the heat balance simulation module, the building systems simulation module and the simulation manager. The heat balance simulation module calculates thermal and mass loads, where factors such as heat transfer by conduction, heat transfer by convection, infiltration, etc. are taken into account. The building system simulation module handles HVAC water and air loops, as well as their attached components, such as coils, boilers, pumps, chillers, etc. Finally, the simulation manager controls the whole simulation process and links the two modules.
Figure 7 - Work phases on EnergyPlus.
The heat balance on the thermal zone air is calculated as follows:
𝐶𝑧𝑑𝑇𝑧 𝑑𝑡 = ∑ 𝑄𝑖̇ 𝑁𝑠𝑙 𝑖=1 + ∑ ℎ𝑖 𝑁𝑠𝑢𝑟𝑓𝑎𝑐𝑒𝑠 𝑖=1 𝐴𝑖(𝑇𝑠𝑖− 𝑇𝑧) + ∑ 𝑚̇𝑖 𝑁𝑧𝑜𝑛𝑒𝑠 𝑖=1 𝐶𝑝(𝑇𝑧𝑖− 𝑇𝑧) + 𝑚𝑖𝑛𝑓𝐶𝑝(𝑇̇∞− 𝑇𝑧)+ 𝑄𝑠𝑦𝑠̇ (5) where: 𝐶𝑧𝑑𝑇𝑧
𝑑𝑡 is the energy stored in zone air;
∑𝑁𝑠𝑙𝑄̇𝑖
∑𝑁𝑠𝑢𝑟𝑓𝑎𝑐𝑒𝑠𝑖=1 ℎ𝑖𝐴𝑖(𝑇𝑠𝑖− 𝑇𝑧) is the convective heat transfer from the zone surfaces;
∑𝑁𝑧𝑜𝑛𝑒𝑠𝑚̇𝑖
𝑖=1 𝐶𝑝(𝑇𝑧𝑖− 𝑇𝑧) is the heat transfer due to interzone air mixing;
𝑚𝑖𝑛𝑓𝐶𝑝(𝑇̇∞− 𝑇𝑧) is the heat transfer due to infiltration of outside air; 𝑄𝑠𝑦𝑠 is the air systems output;
𝐶𝑧= 𝜌𝑎𝑖𝑟𝐶𝑝𝐶𝑇
𝜌𝑎𝑖𝑟 is the zone air density; 𝐶𝑝 is the zone air specific heat;
𝐶𝑇 is the sensible heat capacity multiplier (equal to one by default).
The heat balance on the outside faces is calculated as: 𝑞′′𝛼𝑠𝑜𝑙+ 𝑞′′𝐿𝑊𝑅+ 𝑞′′𝑐𝑜𝑛𝑣− 𝑞′′
𝑘𝑜 = 0 (6)
where:
𝑞′′𝛼𝑠𝑜𝑙 is the absorbed direct and diffuse solar (short wavelength) radiation heat flux;
𝑞′′𝐿𝑊𝑅 is the net long wavelength (thermal) radiation flux exchange with the air and surroundings; 𝑞′′𝑐𝑜𝑛𝑣 is the convective flux exchange with the outside air;
𝑞′′
𝑘𝑜 is the conduction heat flux into the wall.
The heat balance on the inside faces is written as:
𝑞′′𝐿𝑊𝑋+ 𝑞′′𝑆𝑊+ 𝑞′′𝐿𝑊𝑆+ 𝑞′′𝑘𝑖+ 𝑞′′𝑠𝑜𝑙+ 𝑞′′𝑐𝑜𝑛𝑣= 0 (7) where:
𝑞′′𝐿𝑊𝑋 is the net longwave radiant exchange flux between zone surfaces; 𝑞′′𝑆𝑊 is the net short wave radiation flux to surface from lights;
𝑞′′𝐿𝑊𝑆 is the longwave radiation flux from equipment in zone; 𝑞′′𝑘𝑖 is the conduction flux through the wall;
𝑞′′𝑠𝑜𝑙 is the transmitted solar radiation flux absorbed at surface; 𝑞′′𝑐𝑜𝑛𝑣 is the convective heat flux to zone air.
The third phase consists in choosing the simulation outputs desired. These are only available after successfully running the simulation once, being then possible to export a wide variety of data from the simulation. This data can be exported in summary reports, tables and schemes. It addresses outdoor site weather components and characteristics; internal zone temperatures, energy gains and losses; surfaces heat gains and losses; infiltration and natural ventilation heat losses; heating systems energy, and a lot more.
3. Case study
Since this study is aimed at reducing the energy consumption of typical Dutch residential buildings and because the geothermal source is located in Groningen, the most common archetypes in the city were first explored. Consequently, research on actual building energy consumption and the main factors influencing energy needs such as building materials, infiltration and occupant behavior was also carried out, being presented in the following subchapters.
3.1. Buildings representativity and description
According to a construction and housing study carried by Statistics Netherlands (CBS), terraced houses (29%) and flat buildings (56%) such as medium and high-rise account for the highest share of residential constructions in the city – Table 2 [41]. Nevertheless, it is important to note that besides detached and flat buildings, all other archetypes have a very similar typology. In addition, the same study shows that most residential buildings were built between 1960 and 1990 – Table 3. Thus, two different residential buildings are considered for the study: a terraced house and a high-rise building.
Considering the facts that residential buildings in the Netherlands were not typically built with wall insulation and were poorly insulated in the roofs until the late 1970s, targeting these would be ideal so that a wider energy consumption reduction could be achieved. Hence, both buildings considered for this study are from the early 1970s.
Table 2 – Number of buildings (x1000) per archetype in Groningen. 2 under 1 roof are terraced houses with one apartment above the other; corner houses are apartments located at the corner of a street; flat apartments are located in
medium and high-rise buildings [41].
Detached 2 under 1 roof Corner house Terraced house Flat 2.5 4.2 5.0 22.4 43.0
Table 3 - Number of buildings (x1000) per construction year in Groningen [41].
Before 1906 1906 to 1945 1945 to 1960 1960 to 1975 1975 to 1990 1990 to 2000 2000 to 2012 2.9 19.3 7.4 17.0 16.9 8.1 5.6
The buildings chosen are ideal since their apartments have two to four rooms, which are what typical Dutch apartments have – Table 4. The high-rise apartment considered has two bedrooms while the townhouse has three to four, since using the attic as a bedroom is quite common in the Netherlands. In this study, the attic is divided in two: half is a bedroom and the other half is a storage room.
Table 4 – Number of apartments (x1000) per their amount of bedrooms in Groningen [41].
0 to 2 3 4 5 6 7 or more
11.8 24.6 21.6 11.4 4.1 3.5
3.1.1. High-rise building
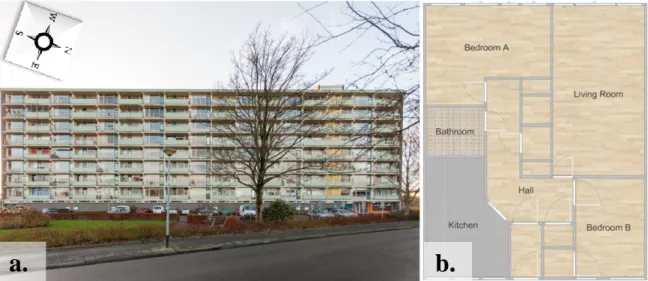
The high-rise building chosen for this study is located northwest from the city center, south from the geothermal source. It was built in 1974 and it has 63 apartments, each with a floor area of 90m2. The average energy label among all apartments in the building is E [42]. Figure 8 shows a photo of the high-rise building and a floorplan of the apartments inside. These have two bedrooms, one living room, one kitchen and one bathroom. An apartment like this usually has two to four occupants. This study considers three occupants per high-rise apartment.
Figure 8 – a. High-rise building; b. Floor plan of the apartments in the high-rise building.
3.1.2. Townhouse building
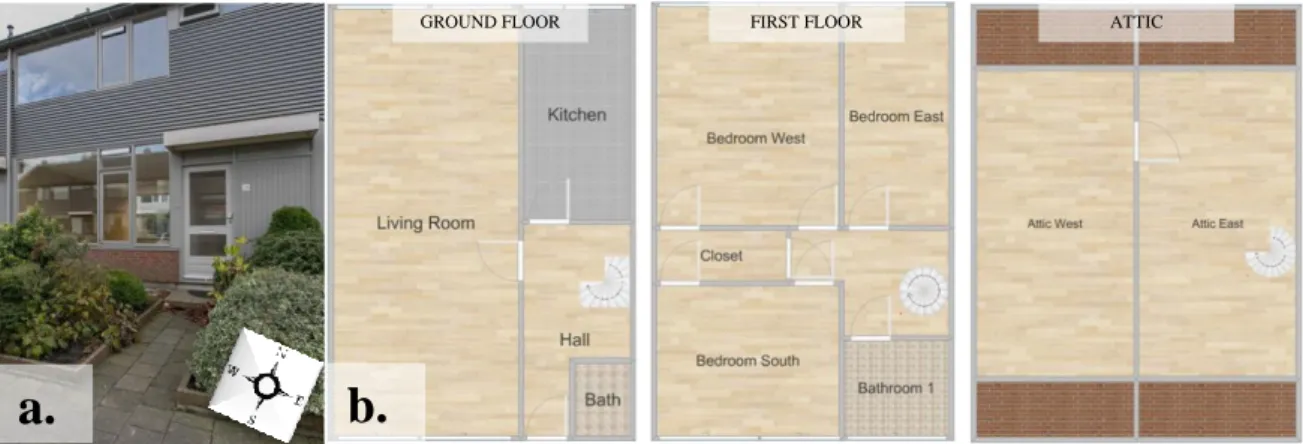
The townhouse building used is also located northwest from the city center, but southeast from the geothermal source. Since townhouses are located between buildings of the same type, the one in the center was chosen. This row of townhouses comprises eight similar looking buildings, each with one apartment, and was built in 1970. Each apartment has three floors with a total floor area of 141m2. The row of townhouse apartments has an average energy label of D [42]. An apartment like this usually has three to seven occupants. This study considers five occupants per townhouse home. Figure 9 displays a photo of the townhouse building and the floorplans for the three floors in the apartment.
Figure 9 - a. Townhouse building; b. Floor plan of the apartment in the townhouse building showing the ground floor, first floor, and attic.
3.1.3. Measured buildings energy consumption
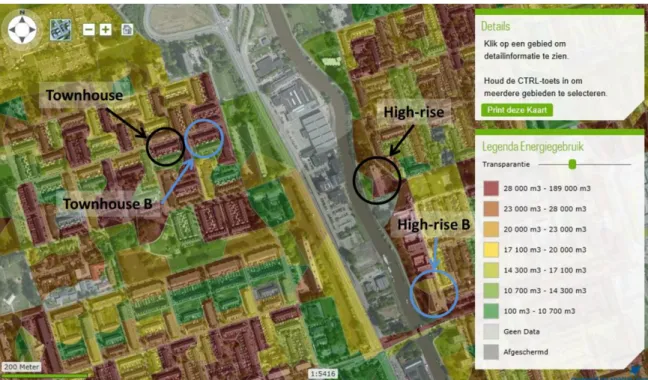
In order to find out the average energy consumption for these building types, a monitoring energy consumption software run by the main energy operators in Groningen named Energie in beeld was used [43]. Figure 10 shows how the software is displayed. This software shows the yearly gas consumption data throughout the city at a neighborhood level, with the summed energy consumption for groups of dwellings of the same type. A color code from red to green throughout the buildings in the city represents the amount of gas consumption in 2014 according to the description in the bottom right. The image can be either zoomed in or zoomed out to show the energy consumption for large or small groups of buildings, e.g. the whole gas consumption in Groningen or the gas consumption in a neighborhood. Figure 10 shows it at maximum zoom in, meaning that it is possible to know the gas consumption for a group of apartments, but not for a single apartment (due to privacy legislations). Thus, the average gas consumption for an apartment in a high-rise and in a townhouse building was calculated using more than one group of apartments displayed.
For the high-rise apartments, two buildings were used: the one mentioned in 3.1.1. and an identical one, named high-rise B in Figure 10. Each building has consumption data for 45 to 47 apartments from 2009 to 2014. For the townhouse apartments, a group of 16 buildings including the one in 3.1.2. and a group of 14 buildings identical to the previous named townhouse B were used. The first group also had consumption data for the whole fraction from 2009 to 2014, while the second had consumption data for 12 to 14 apartments over these years.
GROUND FLOOR FIRST FLOOR ATTIC
Figure 10 – Energie in beeld software display showing the gas consumption for several buildings in Groningen. The buildings circled were the ones used to calculate average natural gas consumptions for typical high-rise and townhouse apartments.
Table 5 shows the high-rise and townhouse buildings yearly gas consumption divided by the number of apartments in each one of them, obtained from Energie in beeld. In Table 6, the correlation between both high-rise and townhouse gas consumption values is presented, showing how similar the variation of the yearly energy consumption between buildings is. The obtained correlation values prove that some of these vary in a very similar way due to climate changes and other possible factors, such as occupant behavior. Hence, by averaging the yearly gas demand for each building type, gas consumption values for the high-rise of 1 296m3 and for the townhouse of of 1 899m3 were used.
Table 5 – Yearly gas consumption in the high-rise and townhouse buildings divided by their number of apartments.
Year High-rise gas
consumption (m3) High-rise B gas consumption (m3) Townhouse gas consumption (m3) Townhouse B gas consumption (m3) 2014 1 319 1 008 1 758 1 739 2013 1 340 1 147 1 907 1 753 2012 1 398 1 260 2 028 1 877 2011 1 409 1 287 2 018 1 877 2010 1 468 1 287 2 021 1 912 2009 1 366 1 261 2 076 1 953
Table 6 – Correlation between the different building group consumptions.
Correlation R2
High-rises 0.65
Townhouses 0.84
High-rise and Townhouse 0.45 High-rise B and Townhouse 0.93 High-rise and Townhouse B 0.47 High-rise B and Townhouse B 0.76
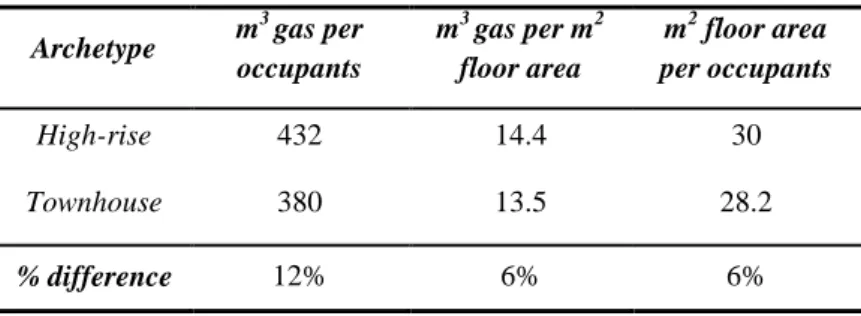
Assuming that the high-rise apartment has three occupants and the townhouse apartment has five, a comparison between both high-rise and townhouse archetypes in terms of their their gas consumption per number of occupants, gas consumption per floor area and floor area per number of occupants was made. The results, presented in Table 7, show that the two apartment types are relatively similar in all of the three normalized indicators. Both gas consumption per floor area and floor area per number of occupants values differ only in 6%, while the gas consumption per number of occupants values differ in 12% between the two archetypes.
Thus, it is assumed that typical Dutch high-rise and townhouse apartments do not diverge much from these profiles, with these being suitable representations for the whole residential building portfolio in the city.
Table 7 - Normalized indicators for the high-rise and townhouse buildings.
Archetype m 3 gas per occupants m3 gas per m2 floor area m2 floor area per occupants High-rise 432 14.4 30 Townhouse 380 13.5 28.2 % difference 12% 6% 6%
3.3. Building Materials
A base case for typical residential building materials from the 1970s in the Netherlands was used for both high-rise and townhouse constructions [44], with the corresponding thermal properties from [45]. Moreover, a common exterior floor layout including riprap, ground slab and screed was considered in the second [46]. Since a few other materials such as brick, metal siding and wood floor are part of the two buildings considered, these were also included – Table 5 and Table 6. Windows were selected according to the fact that 75% of all Dutch dwellings have double glazing in every room [41]. The settings used for these were based on a study about courtyard and atrium dwellings in the Netherlands, with generic double glazed 3 mm clear windows and an air cavity of 13 mm between the layers [47]. Internal shading was also added to the living room, kitchen and bedrooms for both base case scenarios.
Table 8 – High-rise building materials.
Table 9 – Townhouse building materials.
Material Thickness (m) Conductivity (W/m.K) Density (Kg/m3) Specific Heat (J/Kg.K) Thermal resistance (m2.K/W) Exterior Wall Outside Inside Brick 0.1016 0.89 1920 790 - Air space - - - - 0.15 Plaster board 0.012 0.22 800 840 - Interior Wall Outside Inside Plaster board 0.012 0.22 800 840 - Air space - - - - 0.15 Plaster board 0.012 0.22 800 840 - Exterior Roof Outside Inside Slate/tile 0.0127 1.59 1920 1260 - Fiberboard sheating 0.0127 0.07 400 1300 - Batt Insulation 0.089 0.05 19 960 - Plaster board 0.012 0.22 800 840 - Interior Ceiling Outside Inside Concrete 0.1 0.53 1280 840 - Air space - - - - 0.15 Acoustic tile 0.02 0.06 368 590 - Floor Outside Inside Soil 1.64 1.14 1000 1280 - Riprap 0.25 1.20 1000 800 - Ground Slab 0.1 2 2100 880 - Screed 0.1 1.35 1800 1000 - Wood Floor 0.01 0.107 681 1210 - Material Thickness (m) Conductivity (W/m.K) Density (Kg/m3) Specific Heat (J/Kg.K) Thermal resistance (m2.K/W) Exterior Wall Outside Inside Metal Siding 0.0015 44.96 7689 410 - Plaster board 0.012 0.22 800 840 - Air space - - - - 0.15 Plaster board 0.012 0.22 800 840 - Interior Wall Outside Inside Plaster board 0.012 0.22 800 840 - Air space - - - - 0.15 Plaster board 0.012 0.22 800 840 - Interior Ceiling Outside Inside Concrete 0.1 0.53 1280 840 - Air Space - - - - 0.18 Acoustic tile 0.02 0.06 368 590 - Floor Outside Inside Concrete 0.1 0.53 1280 840 - Wood Floor 0.01 0.107 681 1210 -
3.4. Infiltration
In a wide variety of articles, infiltration and ventilation values are presented as one. In this study, infiltration values are considered as the leakage rate of a building from cracks and ventilation values as natural ventilation.
Few publications address infiltration measurements in the Netherlands. Hasselaar E. [48] showed that the infiltration level ranged between 0.5-0.7achnat for 38 dwellings, while De Gids [49] showed that over 50% of the ventilation rate reaches levels over 0.5achnat. Moreover, Entrop et Al. [50] measured a maximum of 0.53achnat for buildings built since 1988, while van der Wal et Al. [51] showed that Dutch apartments averaged an air change rate of 0.6achnat. Therefore, standard infiltration flow rate the levels of 0.55achnat and 0.65achnat for the high-rise and for the townhouse respectively are considered.
3.5. Heating equipment
Latest data on housing settings in the Netherlands was made available by the Ministry of the Interior and Kingdom Relations in a report completed in 2013 [52]. It shows that 77% of the buildings are equipped with hot water boilers that have efficiencies between 85% and 93%, while 23% have efficiencies lower than 85%. This goes along with the information given to us by the Municipality of Groningen, showing the characteristics for a standard boiler currently used in most residential buildings – Table 10. Since this study focuses on older buildings that likely have lower boiler efficiency values, it is assumed an 85% yield for both case studies. Moreover, it is considered that these buildings are centrally heated with a hot water loop that has 20% distribution and emission losses [53-54].
Table 10 – Typical boiler used in most of the dwellings from the 1970s in Groningen.
Boiler Power Pressure
class Supply temperature Return temperature AWB Thermomaster SV 24kWth PN16 90ºC 70ºC
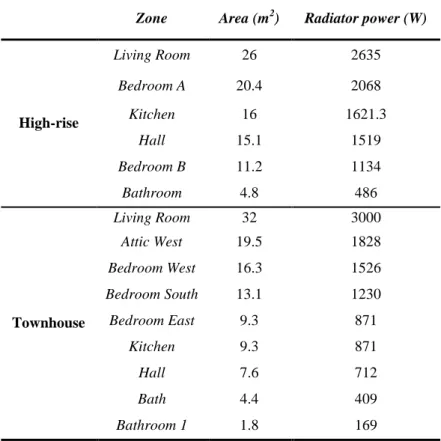
The radiators inside the apartments were sized considering the fact that in rooms with a height over 2.50m, which is the case for all rooms in the high-rise and townhouse dwellings, the power should be equal to 30W per room volume [55]. Furthermore, [55] also states that in poorly insulated buildings the power should be increased in 20%, which is also the case for the two households. Table 11 shows the sized radiator power per zone according to the floor plans presented in the subchapters 3.1.1. and 3.1.2.
![Figure 3 - Types of MVHR systems for residential buildings (figure modified from [31])](https://thumb-eu.123doks.com/thumbv2/123dok_br/15474737.1035585/18.892.136.775.94.333/figure-types-mvhr-systems-residential-buildings-figure-modified.webp)
![Figure 6 shows the geothermal district heating process of a low-enthalpy geothermal system [39]](https://thumb-eu.123doks.com/thumbv2/123dok_br/15474737.1035585/20.892.213.694.468.749/figure-shows-geothermal-district-heating-process-enthalpy-geothermal.webp)