PERSISTENCE, VALUE RELEVANCE, AND
ACCRUALS QUALITY IN EXTREME EARNINGS
AND CASH FLOW SITUATIONS
LUISA TOMI YANAGUIBASHI LEAL
Master’s Degree student from the Department of Finance and Accounting, Federal University of Paraíba (UFPB).
Universidade Federal da Paraíba, Campus I, Jardim Cidade, João Pessoa, Paraíba – PB – Brasil – CEP 58059-900
E-mail: [email protected]
LUIZ FELIPE DE ARAÚJO PONTES GIRÃO
PhD in Accountig from the Department of Finance and Accounting, Universidade de Brasília (UnB).
Adjunct Professor at the Department of Finance and Accounting, Federal University of Paraíba (UFPB).
Universidade Federal da Paraíba, Campus I, Jardim Cidade, João Pessoa, Paraíba – PB – Brasil – CEP 58059-900
E-mail: [email protected]
WENNER GLAUCIO LOPES LUCENA
PhD in Accountig from the Department of Finance and Accounting, Universidade de Brasília (UnB).
Adjunct Professor at the Department of Finance and Accounting, Federal University of Paraíba (UFPB).
Universidade Federal da Paraíba, Campus I, Jardim Cidade, João Pessoa, Paraíba – PB – Brasil – CEP 58059-900
E-mail: [email protected]
VINÍCIUS GOMES MARTINS
PhD in Accountig from the Department of Accounting and Actuarial Sciences, Universidade de Brasília (UnB).
Adjunct Professor at the Department of Accounting and Actuarial Sciences, Federal University of Pernambuco (UFPE).
Av. Prof. Moraes Rego, 1235 – Cidade Universitária, Recife – PE – Brasil – CEP 50670-901
ABSTRACT
Purpose: To analyze the impact of extreme earnings and cash flows on the persistence, value relevance, and accruals quality of Brazilian public firms.
Originality/gap/relevance/implications:The present study contributes to the literature by analyzing extreme earnings and cash flows. Because they change the results of the period in which they occur in an unusual manner, this study suggests that studying their behaviors and impacts on the quality of the information disclosed by companies tends to con-tribute to optimal decision making in the capital market.
Key methodological aspects:The analyzed sample comprised non-finan-cial public companies traded on the BM&FBovespa stock exchange from 2005 to 2014, with estimates made using quantile regression.
Summary of key results: The main results indicate that cash flows are more persistent than earnings because the accruals component of the latter makes them less persistent. Extreme values of both earnings and cash flows affect the persistence of these variables, with a strong and negative effect on cash flows. Finally, extreme values of accruals negatively affect accruals quality because, compared to moderate quantiles, they signifi-cantly alter the standard deviation of extreme quantiles.
Key considerations/conclusions: The presence of extreme values in this study’s focus variables negatively influenced market information quali-ty, reducing its predictive power and, consequently, its relevance. Fur-thermore, controlling for extreme values, it was possible to observe the incremental information content of these two metrics.
KEYWORDS
Value Relevance. Accruals Quality. Extreme Earnings. Extreme Cash
205
1. INTRODUCTION
The uncertainties inherent to the market as a whole require the inves-tor to seek sufficient information to reduce any risks associated with them. In this sense, accounting information is an essential source of information about companies and their roles in negotiation, with regard to the inputs necessary for estimating future cash flows.
As discussed by Bowen, Burgstahler, and Daley (1987), the informa-tion content of cash flows and earnings is an important area of accounting research because it focuses on two issues of fundamental importance for financial statements: 1. it shows the degree to which cash flow data are capable of increasing the usefulness of information provided by the accrual basis, from which financial statements are constructed; and 2. it provides evidence on the extent to which accruals change cash flow data to provide useful information to the capital market (Clubb, 2003, p. 117).
Hendriksen and Van Breda (2012, p. 206) state that “a crucial aspect of research on the impact of accounting earnings on the capital market is the determination of the information content of earnings data.” Accounting information content is supported by a number of attributes, including per-sistence, accruals quality, and value relevance; quality information is expec-ted to have greater information content and, therefore, to better support the decisions of accounting information users.
However, extreme earnings situations may cause the reported number to have no information content, leading users to turn to other information, with cash flow as a possible substitute. Nonetheless, it is possible that cash flow may also be extreme and uninformative. Thus, Chen and Yang (2003) analyze the incremental content of both accounting measures in situations with extreme values. Their sample comprises 25,993 company-years of data from the NYSE, AMEX and NASDAQ covering the 1989-1997 period. Their results show that extreme values of both earnings and cash flows affect the value relevance of these measures.
traded on the London Stock Exchange from 1995 to 2002. Their evidence suggests that the two measures provide incremental information beyond each other and that this is only the case for extreme earnings when the cash flow is moderate, or vice versa.
In Brazil, Silva Filho (2013) analyzes the persistence and relevance of accruals, in addition to the existence of accruals anomaly in the Brazilian capital market. The sample comprises 139 company-years, from January 1, 1995, to December 31, 2001. The study finds that the persistence of accruals is actually smaller than the cash flow component in explaining earnings in Brazilian companies; that accruals are correctly priced in the market; and that accruals anomaly is not confirmed. However, the relationship of varia-bles with extreme values is not investigated.
Based on the above, the objective of this study is to analyze the impact of extreme earnings and cash flows on the persistence, value relevance, and accruals quality of Brazilian public firms.
This study follows a line of thought proposed by Chen and Yang (2003) and Mostafa and Dixon (2013), bringing to the Brazilian context an analysis of the quality of the numbers reported by companies, controlled by extreme earnings and cash flows.
The studies conducted by Chen and Yang (2003), Mostafa and Dixon (2013), and Arkadani, Arkadani, and Heyrani (2013) all use the ordinary least squares (OLS) method, with a dummy variable to represent extre-me values. This article advances this extre-method by using quantile regression, making it possible to control not only extreme values from the previous year, as in the other studies, but also contemporary extreme values. It is thus possible to capture the effect of the previous year’s extreme accoun-ting number in the current year’s numbers more effectively and to control the effect of outliers, heterogeneity, scale problems, and other econometric issues that cannot be controlled using OLS.
Thus, this study seeks to analyze the impact of these extreme values on the persistence of accounting numbers, then value relevance itself, and,
finally, accruals quality. The results corroborate the literature cited above,
adding the fact that accruals quality is also negatively affected by extreme values.
The sections that follow include a literature review (2); followed by the methodology (3), which comprises the population and sample (3.1), the
mea-surement of extreme earnings and cash flows (3.2), the value relevanceof
earnings and cash flows (3.3), and accruals quality (3.4); the results (4);
207
2. LITERATURE REVIEW
Accounting is the main source of information for external users interes-ted in a firm, whether to monitor its efficiency or for investment purposes
(Beyer et al., 2010). It is therefore critical that the information quality level
is sufficient to reliably supply information to users. When investors choo-se to allocate their available resources available in the capital market, they tend to seek information that will improve their decision process, aiming to identify the best opportunity for the allocation of capital, assuming as a parameter the capacity to generate future returns.
In this context, accounting information is an essential source of infor-mation, considering earnings to be a primary source of information and cash flows to be a secondary measure (Arkadani, Arkadani, & Heyrani, 2013; Mostafa & Dixon, 2013). Earnings are considered both a primary measure and a broad measure, comprising two components, namely: 1. operating cash flows (secondary measure); and 2. accruals, a component that contri-butes to the superiority of earnings over cash flows.
Accruals is an accounting concept used for the accrual basis, which seeks to measure the result in an economic sense, independent of transac-tions and events (Paulo, 2007). In other words, accruals are components of accounting results that adjust the recognition of the cash flow over time, with the objective of improving the measurement of the firm’s economic performance (Paulo, 2007). Accruals are thus all the earnings accounts that are on the profit statement but do not imply a necessary movement of cash (Martinez, 2008). A company’s total accruals can therefore be measured as the difference between net earnings and the operating cash flow, thus repre-senting a significant component of corporate earnings.
Earnings have been defined as a central measure in accounting and are considered a “summary” of a company’s activities, able to summarize the company’s past and present performances and to provide inputs for forecas-ting future results, which is mainly sought as an efficiency measure, predic-tion tool, and measure for assessing investment risk. Furthermore, studies
such as those by Biddle et al. (1995), Francis et al. (2003), and Liu et al.
(2002) have shown that investors are more likely to be guided by this
sim-ple measure than any other (Francis et al., 2004; Dechow, Kothari, & Watts,
1998; Lambert, 2004; Arkadani, Arkadani, & Heyrani, 2013; Hendriksen & Van Breda, 2012; Sunder, 2014).
correlation in cash flow changes. In other words, it becomes a better measu-re for fomeasu-recasting futumeasu-re cash flows than curmeasu-rent cash flows.
Chan et al. (2001) claim that focusing only on analyzing bottom-line
earnings, i.e., what is directly observable in the income statement,
disre-gards important information about earnings quality. Income is based on the accrual basis and has two main components: the cash flows component and
the accruals component. Each of these components has its own characteristics
that add specific – and in this case, complementary – types of information about the results obtained in a given period.
The cash flow is paramount because it constitutes control over the company’s cash, and accruals are a key tool of accounting, adding timeliness to the reporting of the company’s economic financial situation (Dechow & Schrand, 2004). The cash flow is basically conceptualized as the amount of inflows and outflows of financial resources that a company has within a certain period, i.e., it considers the effective movement of cash and cash equivalents. The main feature of this component is that its measurement involves no estimation because it will effectively be the movement of cur-rency (Paulo, 2007).
Despite being measured more objectively, the cash flow has the weak-ness of not fully recognizing the economic effects of transactions, which directly affects the competence and timeliness of reported information. Accruals are thus used to try to fill the gap left by measuring cash. For the purposes of calculating the period’s result, the total cash flow comprises the sum of the flows recognized in the previous period and received in the current period, plus what is recognized and received in the current period and what is received in the forecast period for recognition in the following period; note that the basis for identifying the cash flow is the current period.
To complement the information provided by cash flows, accruals are adjustments for competence, whose origin is how, when, and how much revenues and costs are recognized, making it possible to respect the main concepts of the accrual basis: revenue recognition and the matching prin-ciple. Basically, accruals adjust the recognition of cash flows over time and contribute by recognizing economic transactions in the period’s result, even those for which effective cash movements have not been generated, such that the recognition of the event and the economic benefit coincide (Chan
et al., 2001; Dechow & Dichev, 2002).
209 usefulness of accounting information because it is able to report the firm’s present and past performances and to provide insights into future perfor-mance, based on, for example, an anticipation of future cash inflows and outflows and deferrals (Dechow, 1994; Dechow & Dichev, 2002; Dechow, Sloan, & Zha, 2014).
Accrualshave an error term, represented by the residuals of the
regres-sions of variations in the company’s working capital, whose standard devia-tion will determine its quality. Accruals quality is directly related to earnings quality, with regard to persistence; the error process and subsequent cor-rection of accruals create noise in the reported information, decreasing its predictive content.
In short, the greater the error is, the lower the accruals quality. Dechow
and Dichev (2002) obtain further evidence that accruals quality is one of the main factors determining earnings persistence and state that the accruals quality measure can be used for different purposes, including tests to obtain
the relationship between share prices and earnings. In this sense, Chan et al.
(2001) conclude that the accruals component tends to have a negative rela-tionship with share market returns. In other words, an increase in earnings accompanied by a high level of accruals suggests low quality, resulting in low future returns.
Lopes and Martins (2012) conclude that the relevance of accounting information, or accounting information content, is in the accrual basis. They also add that accounting information content can be found in accruals because they have the ability to fill the informational gap left by measuring cash flows, recognizing the essence of economic transactions and adding timeliness to the result information.
Hendriksen and Van Breda (2012, p. 206) state that “a crucial aspect of research on the impact of accounting earnings on the capital market is the determination of the information content of earnings data.” Because earnings represent the primary measure of corporate profitability for inves-tors, Ardakani, Ardakani, and Heyrani (2013) explain that the emphasis on the study of its information content (earnings and losses) seeks to enable the prediction and evaluation of future earnings and cash flows, as well as dividends and increases in share prices, emphasizing the need to explain its components (operating cash flows and accruals) to help identify any possi-ble transience or instability.
decision-making contexts. With this rationale, the study seeks to analyze information quality based on the specification of each of its components, evaluating the impacts of extreme values on their compositions and seeking evidence on the representativeness of the information for the user.
Seven attributes of accounting information are described in the litera-ture, classified by authors into two groups: accruals quality, persistence, predictability, and smoothness, as accounting-based measures; and value relevance, timeliness, and conservatism, as market-based measures (Francis
et al., 2004). This study focuses on persistence, value relevance, and accruals
quality.
Persistence is viewed as a desirable attribute because it means that the presented results are recurrent and sustainable across the periods, i.e., not sporadic. The first consequence concerns the predictability of earnings, which is the ability of earnings to predict themselves. This is another desira-ble aspect of earnings, particularly from the perspective of market regulators and analysts. The consequences of earnings persistence in the capital market are basically the tendency to obtain greater appreciation and future gains as well as a stronger relationship between earnings and share market values. In other words, the greater the persistence is, the stronger the relationship between earnings and share value and the market reaction to variations in the level of the reported results (Dechow, Ge, & Schrand, 2010; Komendi & Lipe, 1987; Collins & Kothari, 1989).
Value relevance is a construct that measures the ability of earnings to
explain variations in returns, and it can also be understood as a measure of the usefulness of accounting information in decision making in the capi-tal market. Therefore, the greater the explanatory power of earnings over returns is, the greater the information’s relevance, capturing the notion that the earnings are high quality and able to explain the firm’s market value and/or the market return (Ewert & Wagenhofer, 2011).
211 Special, extraordinary or non-recurring items are primarily characteri-zed as items that are infrequently repeated over the course of the company’s activities and that therefore change the result of the period in which they occur in an unusual manner. Special items fulfill the objective of portraying an activity in the period, but their predictive power is reduced as a conse-quence of their lower persistence. Cheng and Yang (2003) give some exam-ples of these items: failed predictions for receivables, earnings from the equity method, restructurings, or unrealized gains and losses that do not represent market changes.
Some of the factors that can influence earnings quality include special items, which generate extreme earnings and cash flows. Mostafa and Dixon (2013) claim that the relationship between earnings and profitability is affected by earnings extremity. Examples of special items include currency conversions, an extraordinary gain, losses from company restructuring, and gains and losses from changes in an accounting standard, which only occurs in the initial adoption period.
Hendriksen and Van Breda (2012) cite the following as examples of extraordinary items: the need to pay overtime in periods of greater activity and the acquisition of raw materials at extremely low prices, extraordinary gain from the early settlement and refinancing of debt, and extraordinary cre-dit from using the right to transfer net operating losses to future periods. In other words, they are events that occur once and are not recurrent.
Some examples of extraordinary earnings items are long- and short--term accruals that refer to gains and losses from financial investments, adjustment of foreign currency conversion, losses related to restructuring the company, recognizing changes in market value (when selling shares), or isolated gains and losses related to the impacts of changes in
accoun-ting standards (Cheng et al., 1996; Christensen et al., 2005 apudMostafa &
Dixon, 2013). It is worth considering that extraordinary items contribute to the emergence of extreme values that consequently contribute to reducing the persistence of the company’s earnings components, particularly accruals, which are the portion of earnings directly affected by extraordinary items.
The reduced persistence of extreme values creates the assumption that they are less informative than moderate values (Ali, 1994; Nissim & Penman, 2001; Dechow & Ge, 2005). Cheng and Yang (2003) corroborate this thinking, claiming that studying the information content of cash flows without controlling for extremes does not provide satisfactory results.
changes of the environment in which a company operates influence the manner in which decisions are made, particularly macroeconomic aspects (Houqe, Kerr, & Monem, 2015). In other words, the level or parameters that would characterize quality information changes, or adjusts, to the envi-ronment in which it is being analyzed. Therefore, comparing the results of studies conducted in developed and emerging countries, divergences and peculiarities are likely to be observed.
3. METHODOLOGY
3.1. Population and Sample
This study’s sample came from all non-financial companies that tra-ded their securities or had their securities tratra-ded at least once on the BM&FBovespa stock exchange from 2004 to 2014; thus, the study effecti-vely analyzed the 2005-2015 period. The need for 2004 data stems from the use of a return variable.
The initial period of 2005 was chosen because there were already a good number of Brazilian companies voluntarily disclosing their Cash Flow Sta-tements (CFSs) in Brazil, given that disclosing CFSs became mandatory in Europe that year. Companies that did not present sufficient data to calcu-late the variables used and presented throughout the methodology were excluded, in addition to any financial companies because they have specific
accounting regulations. The data were obtained through Economatica®.
The data were processed in four stages, namely: 1. measurement of extreme earnings and cash flows, which, based on the method used by Mos-tafa and Dixon (2013), separates values considered extreme from those considered moderate; 2. analysis of earnings and cash flow persistence, with the objective of observing the impact of extreme values on each mea-sure through dummy and interaction variables; 3. analysis of value relevan-ce, seeking evidence of the market reaction to these items; 4. and, finally, analysis of accruals quality, as an additional assessment of the information content.
3.2. Measurement of Extreme Earnings and Cash Flows
213 of the period and operating cash flow divided by the asset at the beginning of the period. According to Mostafa and Dixon (2013), (a) negative indicators were separated from positive indicators, and (b) positive indicators were separated into nine deciles. Companies with indicators located in deciles 3 to 8 were considered to have moderate earnings/cash flows, whereas the others were considered to have extreme indicators. This work was perfor-med for each year of the study sample.
3.3. Value Relevance of Earnings and Cash Flows
First, earnings and cash flow persistence were analyzed, measured by a model in which the variables of interest (earnings or cash flow) are explai-ned by themselves but with a temporal lag. To analyze earnings persistence, the model by Dechow and Dichev (2002) was used; this model decomposes
earnings into its cash flow and accruals components. It is expected that α1
will be less than α2, indicating that accruals are less persistent than the cash
flow component.
NEit+1 = α0 + α1ACCRUALSit + α2OCFit + α3EXT_ACCit +
α4EXT_ACC *ACCit + α5EXT_OCFit + α6EXT_OCFit∗OCFit + εit (1)
where:
NEit+1 is the value of the net earnings variable of company i in year t+1;
ACCRUALSit is the value of the total accruals variable of company i in
year t, calculated by the difference between net earnings and the operating cash flow (OCF) in year t;
OCFit is the value of the operating cash flow of company i in year t;
EXT_ACC and EXT_OCF are dummy variables that take the value of 1
when operating cash flow/accrualsare considered extreme and 0 otherwise;
EXT*ACCit is the interaction variable between accruals and the extreme
dummy variable;
EXT*OCFit is the interaction variable between the cash flow and the
extreme dummy variable; and,
εit is the regression error.
The variables used in the model were not weighted by the total assets at the beginning of the period to maintain data heterogeneity due to the use of quantile regression.
OCFit+1 = α0 + α1OCFit + α2EXT_OCFit +
α3OCF* EXT_OCFit + εit (2)
where:
OCFit+1 is the value of the operating cash flow variable of company i in year t+1;
OCFit is the value of the operating cash flow variable of company i in
year t;
EXT_OCFit is a dummy variable that takes the value of 1 when the
ope-rating cash flow is considered extreme and 0 otherwise;
OCF*EXT_OCFit is the interaction variable between the operating cash
flow and the extreme dummy variable; and,
εit is the regression error.
The de facto analysis of the value relevance of the two variables of inte-rest in this article, namely, earnings and cash flow, was given by Equation 3:
Retit+1 = α0 + α1∆Eit + α2∆OCFit + α3Eit + α4OCFit +
α5∆E*ExtremeEit +α6∆OCF*ExtremeCFit + (3)
α7*ExtremeEit + α8OCF*ExtremeCFit + εit
where:
Retit+1 is the share return in period t+1 in relation to t;
∆Eit is the variation in net earnings in relation to period t-1;
∆OCFit is the variation in the operating cash flow in relation to period
t-1;
Eit is the net earnings in period t;
OCFit is the cash flow in period t;
Extreme is a dummy variable that takes the value of 1 when the value is considered extreme and 0 when it is considered moderate;
∆E*Extremeit, ∆OCF*Extremeit, E*Extremeit, and OCF*Extremeit are
interaction variables between the earnings and cash flow variables and the extreme dummy; and
The ExtremeE and ExtremeCF dummies refer to extreme earnings and extreme cash flows, respectively, defined from the methodology described in the previous subsection.
posi-215 tive impact on the information content of cash flows because earnings will be theoretically less persistent and consequently less informative.
3.4. Accruals Quality
The last part of this study’s analysis used the model by Dechow and Dichev (2002), adapting it for extreme earnings and cash flow situations, according to the previous section.
Equation 4 presents Dechow and Dichev’s (2002) model:
∆WCit = α0 + α1OCFit-1 + α2OCFit + α3OCFit+1 + εit (4)
where:
∆WC is the variation in working capital of company i from year t to year
t-1; and
OCF is the operating cash flow of company i in years t-1, t, and t+1.
According to the theory presented by Dechow and Dichev (2002): (i) accruals are temporary adjustments that delay or anticipate the recognition of realized cash flows, plus an estimation error term; (ii) accruals are nega-tively related to current cash flows and posinega-tively related to past and future cash flows; and (iii) the error term (regression residual) captures the extent to which accruals are connected to cash flow realizations, and it can be used as a measure of accruals and earnings quality.
The lower the standard deviation of each quantile’s residuals is, the better the information quality. It is thus expected that companies with less extreme (moderate) earnings will have accruals with higher quality; that is, it is expected that quantiles 10, 20, and 90 will have higher standard devia-tions of residuals than quantiles 30 through 80.
3.5. Quantile Regression
To estimate the equation, it is necessary to choose a quantile that is
con-ditioned to the dependent variable (Y), given an x as a linear function of the
form Q(Y|x) = x’β(τ), where β(τ) is represented by a vector of coefficients.
It is thus possible to estimate β(τ), finding the β¤(τ) that minimizes minβ∈Rm
Σin = 1rt( yi – x'ib) (Koenker & Bassett, 1978).
One of the advantages (Coad & Rao, 2008; Wu & Liu, 2009; Ohlson & Kim, 2015) of using quantile regression – in addition to not assuming the normality of the residuals – is that it is possible to estimate regres-sions without “correcting” the problem of outliers because quantiles are not very sensitive to them; in contrast, OLS regression has a high sensitivity to extreme data because it is a conditional mean.
Another common problem in accounting and finance research is data heterogeneity, which leads to heteroscedasticity. In quantile regression, this heterogeneity is a good characteristic because the results can be better explored through data analysis.
An example of how much better the results can be analyzed by using robust regressions, such as quantile regression and the Theil-Sen estimator, rather than OLS with its different adjustments and assumptions, is the arti-cle published by Ohlson and Kim (2015). Using models for accounting infor-mation quality that are similar to those used in this article, these authors show that the model estimated using OLS fares worse, in most experiments, than the robust models. Furthermore, the process of data winsorization, which is very common in the accounting and financial field, reduces the pos-sibility of exploring extremes, which is the main focus of this study.
4. RESULTS
To better analyze the impact of extreme values in the study variables, the models were estimated using quantile regression. Following the method proposed, the quantiles at the extremities were analyzed as extreme, where-as the central quantiles were analyzed where-as moderate. Furthermore, the varia-bles were not weighted by the total assets of the previous periods to preser-ve data heterogeneity, which is not a problem for estimation using quantile regression. Quantiles 10, 20, and 90 were considered extreme, whereas quantiles 30 to 80 were considered moderate.
com-217 ponent. Additionally, with regard to the interaction variables of the extreme dummies and the components, it is expected that they will present lower coefficients than the isolated components because the theory indicates that extreme values tend to further reduce the persistence of the results due to their transience.
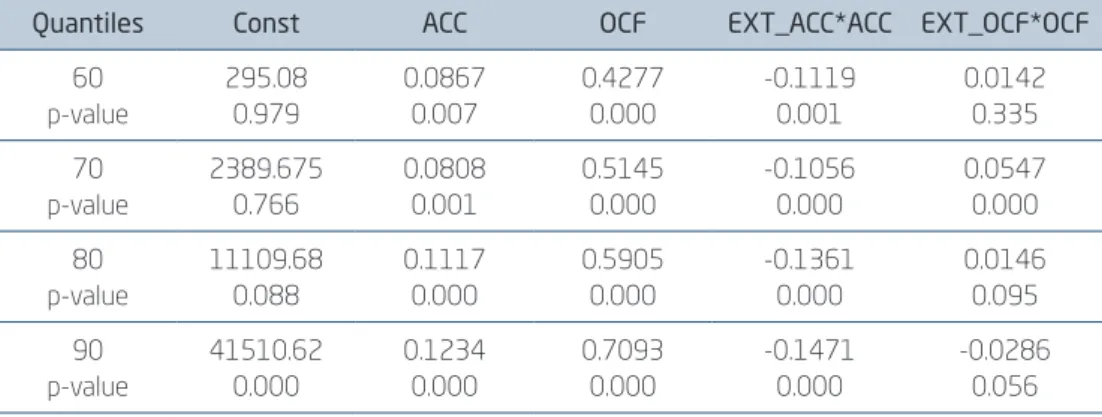
Model (1) was estimated using a total of 2,484 observations. Analyzing the extreme quantiles (10, 20, and 90), it was found that accruals are more persistent than cash flows in the lower quantiles whereas the expected result was observed at the upper extreme because cash flows are signifi-cantly more persistent than the accruals component. In the intermediate or moderate quantiles (30 to 80), the accruals component was found to actu-ally have less persistence than cash flows, except for quantile 50.
The analysis of the interaction variables of the earnings components and the extreme dummies aimed to determine whether there is a change in the coefficients of persistence when there are extreme values. With regard to the lower extreme quantiles, the signs of the coefficients switched to negative, indicating that there would be a reduction in persistence, which is more accentuated in accruals and only significant in the latter. With regard to the upper extreme, the coefficients behaved similarly and were both sig-nificant. With regard to the moderate quantiles, accruals once again had their persistence negatively and significantly affected; the cash flow presen-ted significance only in quantiles 30 and 70 but with positive signs, contrary to expectations.
Table 1
RESULTS OF MODEL 1 – EARNINGS PERSISTENCE
Quantiles Const ACC OCF EXT_ACC*ACC EXT_OCF*OCF
Quantiles Const ACC OCF EXT_ACC*ACC EXT_OCF*OCF 60 p-value 295.08 0.979 0.0867 0.007 0.4277 0.000 -0.1119 0.001 0.0142 0.335 70 p-value 2389.675 0.766 0.0808 0.001 0.5145 0.000 -0.1056 0.000 0.0547 0.000 80 p-value 11109.68 0.088 0.1117 0.000 0.5905 0.000 -0.1361 0.000 0.0146 0.095 90 p-value 41510.62 0.000 0.1234 0.000 0.7093 0.000 -0.1471 0.000 -0.0286 0.056
Note: The isolated dummies were removed from the model due to multicollinearity.
Source: Elaborated by he authors.
Figure 1 shows the behavior of the main variables of interest estimated from Model 1. The dotted lines represent the coefficient of the model esti-mated using OLS and, therefore, unchanged over the quantiles; the thinner dotted line is the limits defined by the confidence interval of the coefficient using OLS, which means that the variables have different behaviors in quan-tile regression when their coefficients exceed the limits of this interval.
With regard to the ACC variable, the behavior approaches the OLS coefficient in the intermediate quantiles and approaches the upper limit in quantiles considered extreme in this study (10, 20, and 90). A similar trajec-tory is observed in the EXT_ACC*ACC variable when the extreme dummy is added to the analysis; it differs only in the direction of the coefficients, tending toward the lower limit of the OLS confidence interval with the pre-sence of extremes.
With regard to the OCF variable, the coefficients are located beyond the confidence interval of the coefficient using OLS, coinciding only approxima-tely with the coefficient of quantile 40. The coefficients increase from the lower to the upper quantiles, showing that the higher the cash flow compo-nent, the greater its influence in increasing earnings persistence.
Finally, in the graph of the cash flow variable controlled by extremes (EXT_OCF*OCF), it is possible to observe a volatile behavior of the coeffi-cients, mainly along the lower limit of the OLS confidence interval. Extreme values thus affect cash flows more significantly than accruals because they are more persistent, which corroborates the literature.
Table 1 (Conclusion)
219 Figure 1
GRAPH OF THE ACC, OCF, EXT_ACC*ACC, AND EXT_OCF*OCF VARIABLES (MODEL 1)
Note: The isolated dummies were removed from the model due to multicollinearity.
Source: Elaborated by the authors.
Table 2 presents the results of the cash flow persistence model, which is estimated using a total of 2,064 observations. In general, all coefficients are significant, except for the EXT_OCF*OCF variable in quantiles 30, 80, and 90. The signs presented by the coefficients suggest that extreme values only affect cash flow persistence in the upper quantiles (70 through 90), with the others corroborating this component’s characteristic of being naturally more persistent.
Quantile
A
CC
0 .2 .4 .6 .8 1
-0.20 0.00 0.20 0.40 0.60
Quantile
EXT_A
C
C*A
C
C
0 .2 .4 .6 .8 1
-0.60 -0.40 -0.20 0.00 0.20
Quantile
F
CO
0 .2 .4 .6 .8 1
-0.20 0.00 0.40 0.60 0.80
Quantile
EXT_FC
O*FC
O
0 .2 .4 .6 .8 1
Table 2
RESULTS OF MODEL 2 – CASH FLOW PERSISTENCE
Quantiles Const OCF t-1 EXT_OCF*OCF
10 p-value 42366.65 0.000 -0.1422 0.000 0.336 0.000 20 p-value 831.0736 0.968 0.1616 0.000 0.2534 0.000 30 p-value -10118.8 0.873 0.8156 0.000 0.0515 0.499 40 p-value 28156.81 0.018 0.8306 0.000 0.1042 0.000 50 p-value 9581.71 0.372 1.01 0.0000 0.0261 0.043 60 p-value 20848.99 0.001 1.0803 0.000 0.0464 0.000 70 p-value -70911.4 0.000 1.2529 0.000 -0.091 0.000 80 p-value 102156.6 0.141 1.3062 0.000 -0.1225 0.142 90 p-value 323441.6 0.009 1.3248 0.000 -0.0436 0.768
Note: The isolated dummies were removed from the model due to multicollinearity.
Source: Elaborated by the authors.
221 Figure 2
RESULTS OF MODEL 2 – OCF T-1 AND OCF*EXT_OCF VARIABLES
Note: The isolated dummies were removed from the model due to multicollinearity.
Source: Elaborated by the authors.
With regard to the results of Model 3 (presented in Figure 3), used to analyze the impact of extreme values on value relevance, i.e., to observe the actual impact on share return, it was expected that extreme values would have a negative impact on the information content of earnings. With regard to cash flows, it was expected that there would be a positive impact on the information content of cash flows because earnings will theoretically be less persistent and consequently less informative. The model was estimated using 1,387 observations.
In general, it was found that both earnings and cash flow information have an influence on market returns. With regard to cash flows, it was obser-ved that when they were moderate, they were actually more informative than earnings; however, if they were extreme, they had a more pronounced negative impact than earnings. Furthermore, there was some evidence that information from the two metrics was incremental because they presented
opposite signs for the coefficients of the ΔE_ExtremeE and ΔOCF_Extreme -CF variables, with an emphasis on moderate quantiles 40 and 50.
Quantile
FC
O t–1
0 .2 .4 .6 .8
0.00 0.50 1.00 1.50 2.00
1
Quantile
EXT_FC
O*FC
O
0 .2 .4 .6 .8
-0.20 0.00 0.20 0.40 0.80
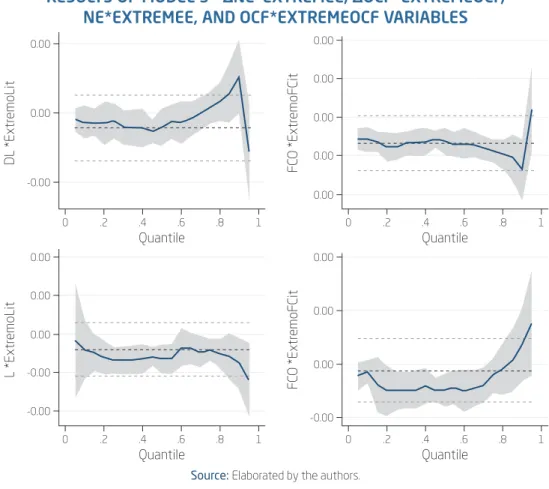
Figure 3 illustrates the trajectories of the estimated coefficients of Model
3’s variables of interest, namely: ΔNE*ExtremeE, ΔOCF*ExtremeOCF,
NE*ExtremeE, and OCF*ExtremeOCF. With regard to interactions with net
earnings (ΔNE*ExtremeE and NE*ExtremeE), the coefficients approximate
that estimate using OLS, with greater distances from the center line obser-ved at the extremities and the most significant differences at the upper end (quantile 90), demonstrating that extreme values actually change the rela-tionship between earnings and share returns.
With regard to the cash flow interaction variables (ΔOCF*ExtremeOCF
and OCF*ExtremeOCF), there is a behavior similar to that observed in the earnings variables, with respect to the proximity of the OLS coefficient line for most quantiles, and distortions at the upper end of both (quantile 90). Howe-ver, the lines point in opposite directions, illustrating the predicted relationship that the value relevance of cash flows increases when earnings are extreme.
Figure 3
RESULTS OF MODEL 3 – ∆NE*EXTREMEE, ∆OCF*EXTREMEOCF, NE*EXTREMEE, AND OCF*EXTREMEOCF VARIABLES
Source: Elaborated by the authors.
Quantile
DL *Extr
emoLit
0 .2 .4 .6 .8 1
-0.00 0.00 0.00
Quantile
FC
O *Extr
emoFCit
0 .2 .4 .6 .8 1
0.00 0.00 0.00 0.00 0.00
Quantile
L *Extr
emoLit
0 .2 .4 .6 .8 1
-0.00 -0.00 0.00
Quantile
FC
O *Extr
emoFCit
0 .2 .4 .6 .8 1
-0.00 0.00 0.00 0.00
223 Finally, Table 4 presents the results of Dechow and Dichev’s (2002) accruals quality estimation model, which is estimated using a total of 1,053 observations. It was expected that accruals would be negatively related to current cash flows and positively related to past and future cash flows and that the standard deviations of the residuals, calculated per quantile, would be higher in the extreme quantiles and lower in the moderate quantiles.
Analyzing the signs of cash flows, it was found that the lower extreme quantiles of past cash flows presented signs that were contrary to those expected, with significance, whereas current cash flows were not significant. With regard to future cash flows, positive signs were observed, as expected, but with no significance.
Table 4
RESULTS OF MODEL 4 – DECHOW & DICHEV’S MODEL (2002)
Quantiles Const OCF T-1 OCF T OCF T+1
10 p-value -68166.8 0.254 -0.3561 0.000 0.1137 0.637 0.0082 0.73 20 p-value -36964.5 0.54 -0.1023 0.000 0.0273 0.91 0.0057 0.812 30 p-value -8333.97 0.753 0.0001 0.978 -0.0197 0.853 0.0041 0.694 40 p-value 22888.05 0.457 0.118 0.000 -0.0113 0.927 0.0024 0.844 50 p-value 52711.34 0.088 0.1784 0.000 -0.0041 0.973 0.001 0.934 60 p-value 71121.79 0.003 0.2285 0.000 -0.0034 0.972 0.007 0.468 70 p-value 179182.7 0.018 0.2547 0.000 0.0235 0.938 0.0046 0.878 80 p-value 263563.8 0.145 0.5815 0.000 0.0465 0.949 -0.0087 0.904 90 p-value 251459.9 0.128 0.9888 0.000 0.0442 0.947 -0.0174 0.793
Source: Elaborated by the authors.
coefficient estimated using OLS, showing a positive relationship with the independent variable above the median, which strengthens above quantile 70, approximately. The others are close to zero, illustrating the lack of signi-ficance demonstrated by the estimated coefficients.
Figure 4
RESULTS OF MODEL 4 – GRAPHS OF THE OCFT-1,
OCFT, AND OCFT+1 VARIABLES
Source: Elaborated by the authors.
With regard to the analysis of accruals quality via the standard deviation of residuals, it is found that the expected results are corroborated. Stan-dard deviations are higher numbers in extreme quantiles than in moderate quantiles, suggesting that extreme quantiles have lower accruals quality and
Quantile
FC
O T–1
0 .2 .4 .6 .8 1
-0.50 0.50 1.00 1.50 2.00
Quantile
FC
O T+1
0 .2 .4 .6 .8 1
-0.40 -0.20 0.00 0.20 0.40
Quantile
FC
O T
0 .2 .4 .6 .8 1
-4.00 0.00 2.00 4.00
225 are therefore less informative. To test whether the difference between the variances of the extreme and non-extreme groups is significant, Levene’s test was performed.
Table 5
STANDARD DEVIATIONS OF THE RESIDUALS OF MODEL 4 AND LEVENE’S TEST FOR HOMOGENEITY OF VARIANCES
Quantiles Standard Deviation of Residuals
10 1,891,135
20 547,023.3
30 10,039.96
40 628,116.4
50 950,351.6
60 1,217,891
70 1,358,724
80 3,101,239
90 5,271,172
Levene’s test* Ratio > 1** p-value 0.0556
* Levene’s test performed between two groups (extreme and non-extreme). ** Ratio < 1 and Ratio = 1 data not tabulated because they were not significant (p-values of 0.944 and 0.111, respectively).
Source: Elaborated by the authors.
Based on Levene’s test, there was a significant difference between the variances of the standard deviation groups of the extreme and non-extreme quantiles, given a p-value of 0.0556 for the null hypothesis that the test ratio is greater than 1, i.e., they are different.
5. CONCLUSION
information were separated into moderate and extreme groups, identified by dummy variables, to obtain evidence regarding whether the presence of values considered to be extreme influenced the value relevance of accoun-ting information in the Brazilian capital market.
The main results indicated that cash flows are more persistent than ear-nings. This result corresponded to the theoretical expectations that, due to the presence of accruals, earnings tend to be less persistent because accruals reflect the economic effects of variations in assets and liabilities that tend to not be constant over time. Regarding to the presence of extreme values, they were found to affect both earnings and cash flow persistence but with a more pronounced negative impact on cash flows. This finding suggests that, ultimately, extreme values negatively interfere in earnings quality because they may reduce its predictive power, given the increase in volatility cau-sed by the reduction in persistence, particularly in the presence of negative extreme values.
Moreover, with further analysis, it was possible to observe that this behavior allows the information of these two metrics to be incremental with respect to the information content of companies in the capital market. In other words, it was found that both earnings and cash flow information affect share market returns. With regard to cash flows, when they are mode-rate, they are actually more informative than earnings; however, if they are extreme, they have a stronger negative impact than earnings. This evidence thus shows that extreme values actually change the relationship between earnings and share returns.
With regard to accruals quality, extreme values were found to negatively affect this measure because, compared to moderate quantiles, they signi-ficantly alter the standard deviation level of extreme quantiles. Thus, it is found that extreme values once again play a negative role in this earnings component, suggesting that these extreme values should be treated when using earnings and their components for estimating future results, future cash flows, and any performance measures that use earnings or their com-ponents as an estimator.
227
PERSISTÊNCIA,
VALUE RELEVANCE
E QUALIDADE
DOS
ACCRUALS
EM SITUAÇÕES DE LUCROS E FLUXOS
DE CAIXA EXTREMOS
RESUMO
Objetivo: Analisar o impacto dos lucros e fluxos de caixa extremos na
sua própria persistência, value relevance e na qualidade dos accruals das
empresas com ações negociadas no Brasil.
Originalidade/lacuna/relevância/implicações: O estudo contribui anali-sando os lucros e fluxos de caixa extremos. Por alterarem de modo não típico o resultado do período em que ocorrem, sugere-se que o estudo dos seus comportamentos e impactos na qualidade das informações divulga-das pelas empresas tende a contribuir com a tomada de decisões ótimas no mercado de capitais.
Principais aspectos metodológicos: Analisou-se uma amostra das empre-sas de capital aberto negociadas na BM&FBovespa durante o período de 2005 a 2014, com estimações realizadas por meio de regressão quantílica.
Síntese dos principais resultados:Os principais resultados apontaram que os fluxos de caixa são mais persistentes que os lucros, este sendo
menos persistente dado o seu componente “accruals”. Tem-se que os
valores extremos, tanto dos lucros quanto dos fluxos de caixa, afetam a persistência de tais variáveis, de efeito mais acentuado negativamente
nos fluxos de caixa. E por fim, acerca da qualidade dos accruals,
observou--se que valores extremos de accruals afetam negativamente essa medida,
pois altera significantemente o patamar do desvio padrão dos quantis extremos, em comparação aos quantis moderados.
Principais considerações/conclusões:Observou-se que a presença de valo-res extremos das variáveis foco desta pesquisa influencia negativamente na qualidade das informações no mercado, reduzindo seu poder prediti-vo e consequentemente, sua relevância; além de que foi possível observar que as informações dessas duas métricas são incrementais no que tange ao conteúdo informativo, quando há o controle dos itens extremos.
PALAVRAS-CHAVE
Value Relevance. Qualidade dos Accruals. Lucros Extremos. Fluxos de
PERSISTENCIA,
VALUE RELEVANCE
Y LA CALIDAD
DE LOS
ACCRUALS
EM SITUACIONES DE LUCROS
Y FLUJOS DE CAJA EXTREMOS
RESUMEN
Objetivo:Analizar el impacto de los beneficios y flujos de caja extremas en su propia persistencia, value relevance y la calidad de las acumula-ciones de las empresas con acacumula-ciones negociadas en la bolsa de valores brasileña.
Originalidad/laguna/relevancia/implicaciones:El trabajo contribuye ana-lizando los beneficios y flujos de caja extremas. Ellos alteran los resul-tados en el período en que ocurren, en esos casos se sugiere el estúdio del comportamento y los impactos em la calidad de las informaciones difundidas por las empresas hán tendido a contribuir com la tomada de buenas deciosiones el la bolsa de valores.
Principales aspectos metodológicos:Há sido analizada uma muestra de empresas con negociación en la BM&FBovespa en el periodo que va de 2005 a 2014, con estimaciones realizadaz por médio de regresiones cuantilicas.
Síntesis de los principales resultados: Los principales resultados apon-tam que los flujo de cajá son más persistentes que los beneficios, que es
menos persistente ya que tiene um componente “accruals”. Los valores
extremos, tanto los beneficios y los flujos de caja, afectar a la persisten-cia de estas variables, con efecto negativo más intenso en el flujos de
caja. Después de todo, la calidad de los “accruals” són negativamente
afectadas por los valores extremos porque se cambia el nível de la des-viación estándar de los cuantiles extremos, en comparación a los cuan-tiles moderados.
229
PALABRAS CLAVE
Value Relevance. Calidad de los Accruals. Lucros Extremos. Flujos de Caja
Extremos. Regresion Cuantilica.
REFERENCES
Arkadani, S. S., Arkadani, M. D., & Heyrani, F. (2013). The Impact of High Earnings on the Informational Content of Cash Flows in the Listed
Com-panies on Tehran Stock Exchange. Internacional Journal of Academic Research
in Accounting, Finance and Management Sciences. 3(4), 215-223. DOI: 10.6007/
IJARAFMS/v3-i4/393.
Beyer, A., Cohen, D. A., Lys, T. Z., & Walther, B. R. (2010). The financial
reporting environment: Review of the recent literature. Journal of Accounting
and Economics,50, 296-343. DOI: 10.1016/j.jacceco.2010.10.003.
Chan, K., Chan, L. K. C., Jegadeesh, N., & Lakonishok, J. (2001). Earnings
quality and stock returns: The evidence from accruals. Social Science Research
Network.
Cheng, C. S. A., & Yang, S. S.M. The incremental information content of
earnings and cash flows operations affected by their extremity. (2003).
Jour-nal of Business Finance and Accounting. 30(1/2), 73-116. DOI:
10.1111/1468-5957.00484.
Clubb, C. Discussion of the incremental information content of earnings
and cash flows from operations affected by their extremity. (2003).
Jour-nal of Business Finance & Accounting, 30(1/2), 117-124. DOI:
10.1111/1468-5957.00001.
Coad, A., & Rao, R. (2008). Innovation and firm growth in high-tech
sec-tors: A quantile regression approach. Research policy, 37(4), 633-648. DOI:
10.1016/j.respol.2008.01.003.
Dechow, P. M. (1994). Accounting earnings and cash flows as measures of
firm performance: the role of accounting accruals. Journal of Accounting and
Economics. 18(1) & (2), 3-42. DOI: 10.1016/0165-4101(94)90016-7.
Dechow, P. M., & Dichev, I. D. (2002). The quality of accruals and earnings:
the role of accrual estimation errors. The Accounting Review. 77(4), 35-59.
Dechow, P. M., & Ge, W. (2005). The persistence of earnings and cash flows
and the role of special items: implications for the accrual anomaly. Review of
Accounting studies, 11, 253-296. DOI: 10.2308/accr.2002.77.s-1.35.
Dechow, P. M., Ge, W., & Schrand, C. (2010). Understanding earnings quality:
a review of the proxies, their determinants and their consequences. Journal of
Accounting and Economics,50, 344-401. DOI: 10.1016/j.jacceco.2010.09.001.
Dechow, P. M., Kothari, S. P., & Watts, R. L. (1998). The relation between
earnings and cash flows. Journal of Accounting and Economics, 25, 133-168.
DOI: 10.1016/S0165-4101(98)00020-2.
Dechow, P. M., Richardson, S. A., & Sloan, R. G. (2008). The persistence and
pricing of the cash component of earnings. Journal of Accounting Research, 46,
537-566. DOI: 10.1111/j.1475-679X.2008.00283.x.
Dechow, P. M., & Schrand, C. M. (2004). Earnings quality. Charlottesville
(Virginia): CFA Institute.
Dechow, P. M., & Sloan, R. G., Zha, J. (2014). Stock prices and Earnings: A
history of research. The annual review of financial economics, 6, 343- 363. DOI:
10.1146/annurev-financial-110613-034522.
Hirshleifer, D., Hou, K., & Teoh, S. H. (2009). Accruals, cash flows, and
aggregate stock returns. Journal of Financial Economics, 91, 389-406. DOI:
10.1016/j.jfineco.2007.11.009.
Ewert, R., & Wagenhofer, A. (2011). Earnings quality metrics and what they
measure. Social Science Research Network. DOI: 10.2139/ssrn.1697042.
Francis, J., Lafond, R., & Olsson, P. M., Schipper, K. (2004). Costs of
equi-ty and earnings attributes. The Accounting Review, 79(4), 967-1010. DOI:
10.2308/accr.2004.79.4.967.
Holthausen, R. W., & Watts, R. L. (2001). The relevance of the
value-rele-vance literature for financial accounting standard setting. Journal of Accounting
and Economics, 31, 3-75. DOI: 10.1016/S0165-4101(01)00029-5.
Houqe, M. N., Kerr, R., & Monem, R. (2015). Business strategy, economic
growth, and earnings quality. Social Science Research Network.
Koenker, R., & Bassett, G. (1978). Regression Quantiles. Econometrica, 46,
33-50. DOI: 10.2307/1913643.
Kormendi, R., & Lipe, R. (1987). Earnings innovations, earnings persistence,
and stock returns. Journal of Business, 60(3), 323-345.
Lambert, R. A. (2004). Discussion of analysts’ of non-recurring items in street earnings and loss function assumptions in rational expectations tests
on financial analysts’ earnings forecasts. Journal of Accounting and Economics,
231 Martinez, A. L. (2008). Detectando Earnings management no Brasil:
esti-mando os accruals discricionários. Revista de Contabilidade & Finanças, 19(46),
7-17.
Mostafa, W., & Dixon, R. (2013). The impact of earnings extremity on
infor-mation content of cash flow. Review of Accounting and Finance, 12(1), 81-104.
DOI: 10.1108/14757701311295845.
Nissim, D., & Penman, S. H.(2001). Ratio analysis and equity valuation:
from research to practice. Review of Accounting Studies, 6, 109-154. DOI:
10.1023/A:1011338221623.
Ohlson, J. A., & Kim, S. (2015). Linear valuation without OLS: the Theil-Sen
estimation approach. Review Accounting Studies, 20, 395-435. DOI: 10.1007/
s11142-014-9300-0.
Wu, Y., & Liu, Y. (2009). Variable selection in quantile regression. Statistica
Sinica, 19, 801-817.
Paulo, E. (2007). Manipulação das informações contábeis: uma análise teórica e
empírica sobre os modelos operacionais de detecção de gerenciamento de resultados.