BAR, Curitiba, v. 6, n. 3, art. 6, p. 263-279, July/Sept. 2009
The Stockouts Study: an Examination of the Extent and
the Causes in the São Paulo Supermarket Sector
Luis Henrique Rigato Vasconcellos *
E-mail address: [email protected] Escola Superior de Propaganda e Marketing São Paulo, SP, Brazil.
Mauro Sampaio
E-mail address: [email protected] Fundação Getulio Vargas
São Paulo, SP, Brazil.
A
BSTRACTStockouts remain a significant retail problem. Progress has been limited, as estimates of stockout rates in the past forty years have consistently averaged above 8 percent. The purpose of this study is to investigate the importance and extent of the stockout problem in the supermarket sector in the state of São Paulo, Brazil, from the perspective of the supermarket managers themselves. Results suggest that the level of stockouts is high. Generally, the suppliers are mentioned as being the ones mainly responsible for stockouts. These results suggest that managers have significant opportunities to reduce retail stockouts by taking preventative actions.
Key words: stockout; retail; logistics; supermarkets.
Received 19 October 2008; received in revised form 06 March 2009.
Copyright © 2009 Brazilian Administration Review. All rights reserved, including rights for
translation. Parts of this work may be quoted without prior knowledge on the condition that
the source is identified.
I
NTRODUCTIONThis study defines a stockout as a situation where an item that is regularly commercialized at a point of sale and occupies a specific place on the shelves is not available to the consumer in the store at the moment of purchase. A stockout is characterized by an inefficient process of refilling shelves. A stockout rate is precisely the percentage of all the items commercialized that should be for sale, but are not found on the shelves. A 10 % rate of stockout means, for example, that out of a total of 5,000 items catalogued and commercialized by a supermarket, 500 would not be available on the shelves for immediate purchase by the final consumer.
Stockouts are increasingly recognized as a retail problem by both researchers and practitioners. Estimates of stockout rates in retail stores have consistently averaged above 8 percent, the rates reported from Peckham (1963) to Gruen, Corsten and Bharadwaj (2002) are reasonably similar. Retail stockout problems have been studied from two major perspectives: measurement of stockout rates in stores and consumer response to stockouts (Roland Berger, 2003; Zinn & Liu, 2001). Regardless of the perspective guiding the research, most studies suggest that managers deal with stockouts by taking action to reduce the number of stockouts as much as possible (Corsten & Gruen, 2003; Roland Berger, 2003).
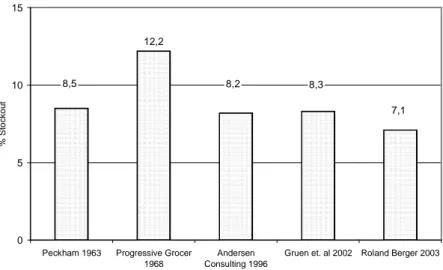
While taking action to reduce the number of stockouts is clearly an important component of stockout management, it is likely insufficient to solve the problem. There are two major reasons for this. First, despite all efforts so far, stockout rates have remained high over a prolonged period of time, as shown in Figure 1. The rates reported by Peckham (1963) match Roland Berger (2003), remaining around the level of 8.0 %, while other research published within this forty-year time span reported similar rates. Second, the stockout problem is becoming more difficult to manage due to the continued trends of product proliferation, scrambled merchandising and shorter product life cycles. It seems evident that stockout rates will never be zero.
Figure 1: Percent of Stockout Levels in Previous Studies
12,2
7,1 8,3
8,2 8,5
0 5 10 15
Peckham 1963 Progressive Grocer 1968
Andersen Consulting 1996
Gruen et. al 2002 Roland Berger 2003
%
S
to
c
k
o
u
t
the cases they change stores, and in 14 % of the cases they rarely return. Stockouts were, still are, and apparently will continue to be an important managerial problem.
The purpose of this research is to investigate the stockout rate in supermarket chains in the state of São Paulo, Brazil, the measurement methods used and the causes from the perspective of the supermarket managers themselves. Although some business studies about stockouts have been conducted (Arthur Charles Nielsen [ACNielsen], 2004), there is still a great deal of room for academic studies.
In short, the article will attempt to answer the following guiding questions: . How important are stockouts to supermarket managers?
. What method is used for measuring stockouts?
. What is the stockout rate in supermarkets in the state of São Paulo, Brazil?
. What are the main causes and who are the ones responsible for the stockout problems?
In order to make the investigative process about retail stockouts viable, we conducted a survey with the managers of supermarkets in the state of São Paulo which were affiliated to the Associação Paulista de Supermercados (Paulista Supermarket Association [APAS]). The results showed that the stockout rates are high. Supplier delivery delays are the most mentioned cause. This research suggests that there are opportunities for reduction of stockout rates through joint actions of industry and retail.
The remainder of this article is divided into four sections. The first is a literature review. This is followed by a description of the methodology used, including the preparation of the questionnaire and data collection and analysis. The third section contains the results. The conclusions, limitations and managerial implications are in the fourth and final section.
L
ITERATURER
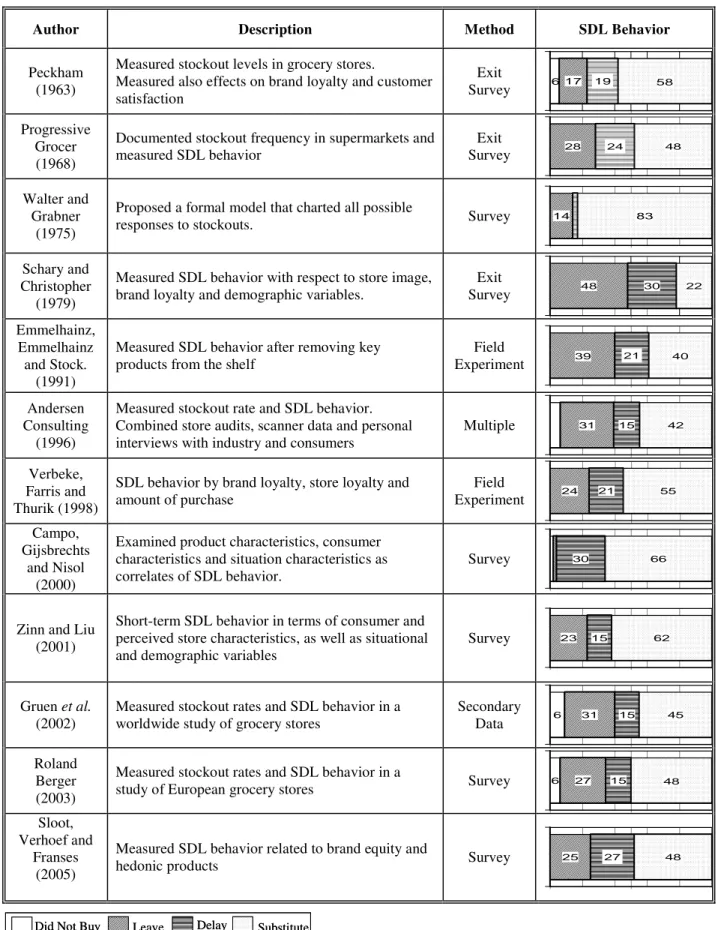
EVIEWThe retail stockouts literature began at least forty years ago (Peckham, 1963). During this time frame, most publications have focused on at least one of two broad issues. One is the measurement of stockout levels in retail stores and the other is the behavior of consumers in response to a stockout. Consumers may respond to the stockout by either substituting the item, delaying the purchase or leaving the store. This response set is known by the acronym SDL. The literature is summarized in Table 1, with special emphasis on SDL behavior because it is the basis for the framework we use to measure consumer behavior in this research. Much of this literature is also reviewed in Fitzsimons (2000) and Zinn and Liu (2001).
The first research to investigate stockouts was Peckham’s (1963), which alerted retailers and manufacturers to potential losses resulting from stockout. In 1968, Progressive Grocer conducted a survey about stockouts in hypermarkets. Its main contribution was to identify the different consumer response to stockouts. This set of attitudes is known as the SDL behavior (Substitute, Delay and Leave) of the consumer in response to stockouts.
Walter and Grabner’s study (1975) proposed a model that charts all possible consumer responses to stockouts. This model influenced most future studies on stockouts.
However, they returned to their favorite brands with the restoration of supplies. The weak point of the experiment was not to have offered to the consumer the possibility of changing suppliers.
Table 1: Retail Stockouts Literature Related to SDL Behavior
Author Description Method SDL Behavior
Peckham (1963)
Measured stockout levels in grocery stores.
Measured also effects on brand loyalty and customer satisfaction
Exit
Survey 6 17 19 58
Progressive Grocer (1968)
Documented stockout frequency in supermarkets and measured SDL behavior
Exit
Survey 28 24 48
Walter and Grabner
(1975)
Proposed a formal model that charted all possible
responses to stockouts. Survey 14 83
Schary and Christopher
(1979)
Measured SDL behavior with respect to store image, brand loyalty and demographic variables.
Exit
Survey 48 30 22
Emmelhainz, Emmelhainz and Stock.
(1991)
Measured SDL behavior after removing key products from the shelf
Field
Experiment 39 21 40
Andersen Consulting
(1996)
Measured stockout rate and SDL behavior. Combined store audits, scanner data and personal interviews with industry and consumers
Multiple 31 15 42
Verbeke, Farris and Thurik (1998)
SDL behavior by brand loyalty, store loyalty and amount of purchase
Field
Experiment 24 21 55
Campo, Gijsbrechts
and Nisol (2000)
Examined product characteristics, consumer characteristics and situation characteristics as correlates of SDL behavior.
Survey 30 66
Zinn and Liu (2001)
Short-term SDL behavior in terms of consumer and perceived store characteristics, as well as situational and demographic variables
Survey 23 15 62
Gruen et al.
(2002)
Measured stockout rates and SDL behavior in a worldwide study of grocery stores
Secondary
Data 6 31 15 45
Roland Berger (2003)
Measured stockout rates and SDL behavior in a
study of European grocery stores Survey 6 27 15 48
Sloot, Verhoef and
Franses (2005)
Measured SDL behavior related to brand equity and
hedonic products Survey 25 27 48
The Schary and Christopher study (1979) showed that the clients who left the store due to a stockout were less satisfied, had a worse impression of the store and were less likely to buy there again. The survey of Emmelhainz et al. (1991) also measured the consumer’s SDL behavior after removing key products from the shelves.
In an attempt to explain the consumer’s SDL behavior in response to a stockout, the research conducted by Zinn and Liu (2001) deeply investigated the influence of other variables, such as: urgency in purchase of item, promotion, brand loyalty, surprise with stockout, pre-visit agenda and whether or not the consumer is upset with stockout. Following the same line of reasoning, other authors (Campo et al., 2000; Fitzsimons, 2000; Sloot et al., 2005; Verbeke et al., 1998, among others) identified a group of new variables that influenced the consumer’s SDL behavior. According to Zinn and Liu (2001), situational variables such as urgency and level of planning (planned purchase or impulse purchase) greatly influence the consumer’s decision.
These findings took the theme of stockout to another level of analysis and generalization. The reasoning now is that it is necessary to understand the variables that influence consumer behavior in order to be able to help retail businesses discover new ways to minimize the number of consumers leaving the store and at least encourage the consumer to substitute the item or delay the purchase.
Schary and Becker’s study (1978) investigated the long-term effect of a stockout condition. The opportunity arose after a strike in an American national brewery that limited their supply of beer in the Western United States. Consumers switched brands and started to consume local brands. Thirty months after the end of the strike, the original market share of the national company had still not been recuperated. The authors concluded that a prolonged period stockout is likely to cause loss of market share. Straughn (1991) conducted a similar study in which she analyzed scanner data in a chain of supermarkets. The author studied the effect of stockouts on the market share of candy bars. The effect of short-term stockouts was considered negligible; however, the effect of a prolonged stockout condition for a product (more than five weeks) caused losses of 10 % in market share.
Recent studies indicate stockout rates of 8.3% in supply chains for non-perishable consumer goods. (Gruen et al., 2002; Gruen & Corsten, 2007; Roland Berger, 2003).
This literature review shows that the study of stockouts is a relevant subject, with the potential to provide sustainable competitive advantages for those organizations that reduce the incidence of stockouts and/or regain consumers in an effective way.
In Brazil, one of the few stockout studies was conducted by the Retail Services Division of ACNielsen Brazil in July 2004. The research analyzed the main causes as well as the attitudes of the consumers when they do not find the product on the shelf. They studied 528 SKUs (Stock Keeping Units) in 587 self-service stores with 5 or more checkouts; the result was an average stockout rate of 8.0 %. The study also concluded that the stockout causes are distributed all along the supply chain, but that the main opportunities for improvement were found between the Retail Distribution Center and the shelves. However, because the sample was restricted to stores in the capital cities of São Paulo and Rio de Janeiro, it was not possible to make statistical generalizations.
Despite the importance of the subject, academic research about stockouts in supermarkets of different formats has still not been conducted, and the causes of the stockouts have not been identified. This study seeks to fill this gap and explore these issues.
M
ETHODOLOGYalready previous knowledge about the issue of stockouts, although there are no convincing academic results in the Brazilian case, a survey seems to be recommendable, and its goal is to describe the relationship among relevant variables, such as the main causes of stockouts and the different kinds of supermarkets. Thus, we have used a single crossing schema, i.e., the information was obtained from a single sample (the managers of supermarkets affiliated to APAS). The objective of the study was not to detect changes, but to extract information about the current stockout stage of the target population.
Recall that the objective of this research is to investigate four fundamental issues: . How important are stockouts to supermarket managers?
. What method is used for measuring stockouts?
. What is the stockout rate in supermarkets in the state of São Paulo- Brazil?
. What are the main causes and who are the ones responsible for the stockout problems?
Variable Selection
The scales used to prepare the questionnaire were based on the previous literature. The list of probable stockout causes to be investigated was drawn from Gruen et al. (2002) and the methods for stockout measurement from Roland Berger (2003) and Andersen Consulting (1996). We also used the scale available in Gruen and Corsten (2007) to measure stockout frequency.
To measure the importance of stockout, we asked the respondents to prepare a rank of eight previously selected attributes that they felt were related to the final consumer’s satisfaction based on their experience and perception (Gruen et al., 2002): clerks are friendly, polite and courteous; low prices; promotions; variety of goods and service; low stockout levels; cleanliness and tidiness of the facilities; easy physical access and short lines. The purpose was to identify the importance that the managers themselves attributed to the stockout factor in relation to the other factors.
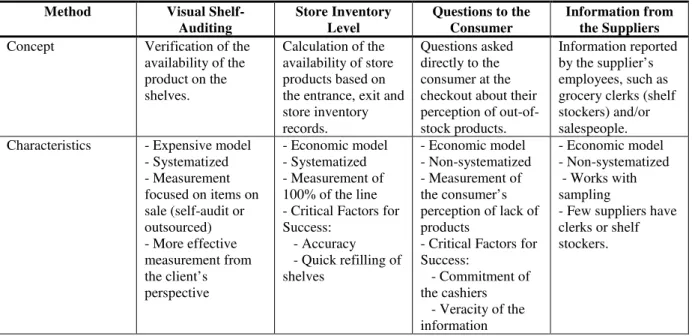
We also asked to the respondents to select which method for measuring stockouts was used. There is no consensus in the literature about even the very definition of stockout, for there are different ways of measuring it (Gruen et al., 2002). According to the committee of retail professionals, stockout can be monitored by using the following methods: (a) Visual shelf auditing (b) store inventory level (c) questions asked directly to the consumer and (d) information from the suppliers, as shown in Table 2.
Table 2: Monitoring of the Different Stockouts in the Chain
Method Visual Shelf-Auditing
Store Inventory Level
Questions to the Consumer
Information from the Suppliers
Concept Verification of the availability of the product on the shelves.
Calculation of the availability of store products based on the entrance, exit and store inventory records.
Questions asked directly to the consumer at the checkout about their perception of out-of-stock products.
Information reported by the supplier’s employees, such as grocery clerks (shelf stockers) and/or salespeople. Characteristics - Expensive model
- Systematized - Measurement focused on items on sale (self-audit or outsourced) - More effective measurement from the client’s perspective
- Economic model - Systematized - Measurement of 100% of the line - Critical Factors for Success:
- Accuracy - Quick refilling of shelves
- Economic model - Non-systematized - Measurement of the consumer’s perception of lack of products
- Critical Factors for Success:
- Commitment of the cashiers - Veracity of the information
- Economic model - Non-systematized - Works with sampling
Each of these ways of measurement has advantages and disadvantages: The audit is a reliable measurement method; however, it is expensive and uses up the scant resources of the organization. The measurement of the levels of stock kept in the stores is easily accessed through information systems. The problem is that the percentage of inconsistencies is high; there is a difference between the actual physical stock and the stock found in the system, not counting the fact that the products may be in the storeroom and not on the shelf. The information from the consumer is interesting, but is also not very reliable, because it depends on the commitment of the cashiers to systematically ask the consumer. Furthermore, there is the possibility that the consumer simply may not be able to find the product in the store and may declare it to be stockout. The information given by the suppliers is reliable, but only a small portion of the supermarket SKUs have shelf stockers paid by the manufacturers.
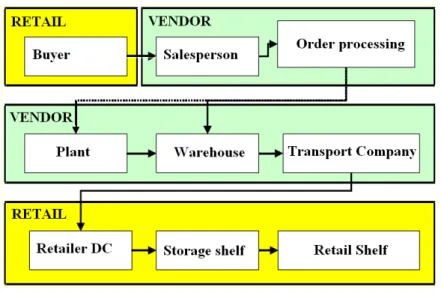
Retail problems can occur all along the retail supply chain, from the retail purchaser’s contact with the supplier’s salesperson to the placing of the product on the shelf, as can be seen in Figure 2.
Figure 2: Retail Supply Chain
The list of the stockout causes throughout this whole supply chain was based on literature, for example, Gruen et. al., 2002; Gruen and Corsten, 2007; Roland Berger, 2003, and was also discussed with the committee of retail professionals from the state of São Paulo.
Data Collection and Analysis
Six pre-tests of the questionnaire were conducted with a panel made up of 04 retail professionals and 02 academics. Small adjustments of the language and inclusion/exclusion of variables were made based on their comments.
The element of the population that has the information necessary for this study is the supermarket manager. According to the committee of retail professionals, this person is responsible for following the stockout indicators that occur in his/her establishment. Furthermore, the manager is the one who ends up suffering the direct consequences of stockouts, such as consumers’ complaints or penalizations for not having reached the sales goals because the product is not available to be sold.
consultants, professors, independent (not affiliated to a company) or retired. All the other 946 names of supermarket managers were selected to receive the questionnaire.
The questionnaire was applied in three waves of email, as shown in Table 2. The first wave consisted of an email in the name of APAS requesting participation in the survey and making the questionnaire available on an Excel file to be filled out by the respondent. In this email, we spoke about the relevance of the survey and made it clear that only the respondents would have access to the final report as a way of encouraging the managers to answer the questionnaire and send it back to us.
After the first posting, 42 email messages were returned along with a notification saying that they had not been received due to a change of email address. The respondents returned 33 filled-out questionnaires. Three weeks after the first posting, a second wave of email was sent to the non-respondents, resulting in 67 valid responses. However, in spite of the responses obtained, the proportion of hypermarket managers was still considered low in the sample when compared to the list of members of APAS, characterizing non-representativeness of this segment in the sample received. Three weeks later, a third wave of email was sent to the non-respondents of hypermarkets. There were 8 responses to this posting. In short, 108 questionnaires were considered valid, resulting in a response rate of 11.9 %, which was considered satisfactory, because it is in line with that used for other similar studies in the past (Gruen et al., 2002).
Table 3: Survey Sample
Types Number of check-outs
Members Of APAS
1st wave
2nd wave
3rd wave
Total Percentage
Compact Supermarket 1 to 4 805 10 11 0 21
Conventional Supermarket 5 to 19 94 18 47 0 65
Hypermarket 20 or more 47 5 9 8 22
Total 946 33 67 8 108 11.90%
Comparing the sample to the population, while the members of APAS have the profile of compact supermarkets (85%), conventional supermarkets (15%) and hypermarkets (5%), the sample obtained from the respondents was only 19% of compact supermarkets, 60% of conventional supermarkets and 21% of hypermarkets. As shown in Table 3, the group of respondents is more representative of conventional supermarkets and hypermarkets and less representative of compact supermarkets with respect to the total members of APAS. This fact may be explained by the strategic character of the survey and by the fact that the level of interest in obtaining the answers to the survey is predominantly larger in more structured organizations, such as the conventional supermarkets and hypermarkets.
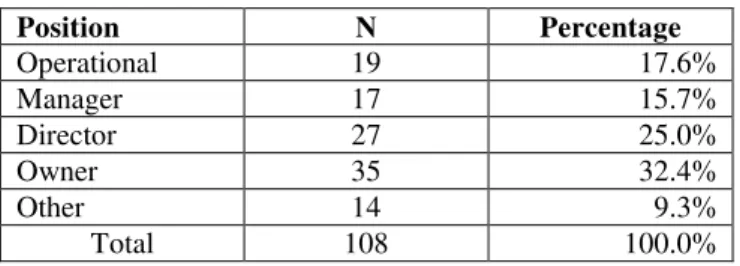
The sample was made up of an experienced group of retail managers, as shown in Table 4, of which 57.4% held the positions of directors and/or owners of supermarkets, 15.7% were store managers and 17.6% were professionals in more operational levels (example: purchases). The remaining 9.3% held positions in other categories.
Table 4: Profile of the Respondents
Position N Percentage
Operational 19 17.6%
Manager 17 15.7%
Director 27 25.0%
Owner 35 32.4%
Other 14 9.3%
Total 108 100.0%
extrapolation method or, in other words, comparing the answers to some key questions in the first, second and third wave of respondents. No significant differences were observed in the averages of the three groups.
R
ESULTSIn this section, we present the answers to each of the four research-guiding issues. How important are stockouts to supermarket managers? What method is used for measuring stockouts? What is the stockout rate in supermarkets in the state of São Paulo? What are the main causes and who are the ones responsible for the stockout problems? First, we analyzed the questions which were asked. Next, we evaluated the answers given by the supermarket managers. The managerial and academic implications of the results are debated in the last section of the article.
The Importance of Stockouts
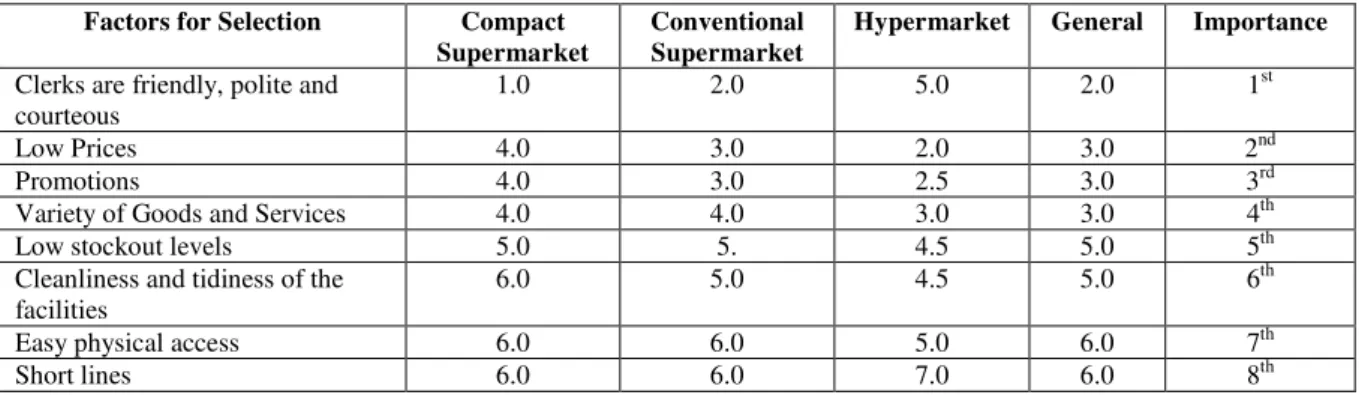
Ordinal values were assigned to the attributes so that it was not possible to compare them by calculating the average. Instead, the median was used to compare the ranks of the eight attributes for the selection of the supermarket. The results are given in Table 5. Each attribute was classified on a ordinal scale from 1 to 8, with 1 = most important attribute and 8 = least important attribute. Thus, the factor with the lower median is classified as the most important, and the factor with the higher median is the least important.
From the perspective of the supermarket executives, the factor – quality of customer service – was classified as the most important (median=2) and the factor – short lines – was the least important (median 6). When the various segments of supermarkets were analyzed, some differences were identified:
. Compact and conventional supermarkets put more emphasis on the customer service attribute. . Hypermarkets put more emphasis on the attributes of low prices and promotions.
Table 5: Order of Importance of the Attributes for the Selection of a Supermarket
Factors for Selection Compact Supermarket
Conventional Supermarket
Hypermarket General Importance
Clerks are friendly, polite and courteous
1.0 2.0 5.0 2.0 1st
Low Prices 4.0 3.0 2.0 3.0 2nd
Promotions 4.0 3.0 2.5 3.0 3rd
Variety of Goods and Services 4.0 4.0 3.0 3.0 4th
Low stockout levels 5.0 5. 4.5 5.0 5th
Cleanliness and tidiness of the facilities
6.0 5.0 4.5 5.0 6th
Easy physical access 6.0 6.0 5.0 6.0 7th
Short lines 6.0 6.0 7.0 6.0 8th
customer. This fact in itself may explain the high retail stockout rates, for any subject that is not prioritized by the manager will more than likely not be improved.
Methods for Measuring Stockout
Based on the data obtained in this research, it is possible to state that the method mostly used by the managers to measure stockouts is the visual shelf auditing method – in conventional supermarkets (62%), hypermarkets (82%) and even in compact supermarkets (38%), as shown in Table 6. However, we have found that more than one method may be used simultaneously.
Table 6: Methods for Measuring Stockouts
Type Visual Shelf Auditing
Level of Stock Questions to the consumer
at checkout
Information from Suppliers
Store doesn’t stockouts Compact
Supermarket
38% 24% 33% 5% 24%
Conventional Supermarket
62% 52% 58% 32% 5%
Hypermarket 82% 73% 64% 36% 0%
Total 61% 51% 55% 33% 3%
Stockout Rate
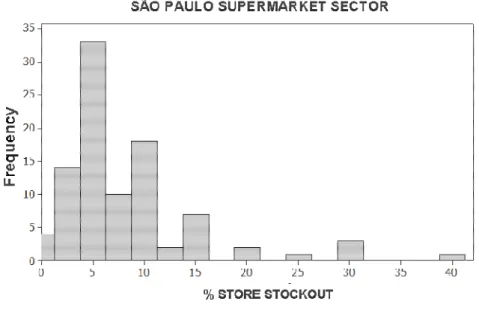
The supermarket managers reported that the average stockout rate of supermarkets in the state of São Paulo is 8.3, % with a standard deviation of 6.8, as demonstrated in Figure 2. This means that of every 100 items catalogued in the store, 8.3 are not on the shelves.
Figure 3: Stockout Rate of the Supermarkets of the State of São Paulo
Table 7: Stockout Rate
Type Responses Average Standard Deviation
Compact Supermarket 14 9.1 9.2
Conventional Supermarket 60 8.5 6.8
Hypermarket 21 7.1 5.2
Total 95 8.3 6.8
This result was not surprising. The stockout levels are high; nevertheless, the stockout rates are similar to those found in supermarkets in developed countries. These levels were made possible due to the privileged conditions of the logistics infra-structure of the state of São Paulo compared to other Brazilian states. The news is that these numbers are similar in supermarkets of different sizes. In order to evaluate whether there is a statistically significant difference of stockout averages from one size of store to another, we conducted the Analysis of Variance Test [ANOVA] of one factor. The result revealed that there is no significant difference (0.10) in the averages of the different groups. However, it is important to note that the number of items managed by the supermarkets is also smaller, making it easier to maintain the stockout rates at levels equivalent to those of the hypermarkets.
The result found is equivalent to the one published in the ACNielsen study (2004), the only research conducted in Brazil about stockout rates in supermarkets. It is also important to note that the problem is a chronic one. Managers tend to accept the problem as if 8.3 % were a normal level of occurrence.
Table 8 compares the values given by the managers (1: low; 7: high) to the stockout levels in different categories of products in the three formats of supermarkets using the method of Analysis of Variance [ANOVA]. The focus of the analysis was to identify the products that show significant differences in their averages. It was nothing new to observe that the stockout rate varies according to the stores and formats. We also noticed some other significant differences from one format to another. The smaller supermarkets have more problems with stockout in the categories of drinks and bazaar. However, based on this research, we are able to state that the category of items that mostly concerns the retail managers is the one that includes hygiene, health and beauty products, because every format of supermarket selected it as the most critical category.
Table 8: Averages of the Values Given by the Managers to the Stockout Rates in Different Categories of Products
Type Category1 Compact
Supermarket
Conventional Supermarket
Hypermarket Statistic F P value
Hygiene, health and beauty 3. 3.3 3.1 0.539 0.585
Bazaara 2.9 3.3 2.3 2.922 0.059
Cleaning Products 2.7 2.9 3.3 1.090 0.340
Grocery 2.7 3.0 2.9 0.398 0.672
Perishables 3.0 2.9 2.6 0.371 0.691
Alcoholic Beveragesb 2. 2.3 1.6 3.377 0.038
Non-alcoholic Beveragesc 2.6 2.0 1.7 3.379 0.038
1. Averages compared by the post hoc test using the method of “least significant difference” [LSD]. a) Compact Supermarket > Hypermarket
b) Conventional Supermarket > Hypermarket
c) Compact Supermarket > Conventional Supermarket / Hypermarket
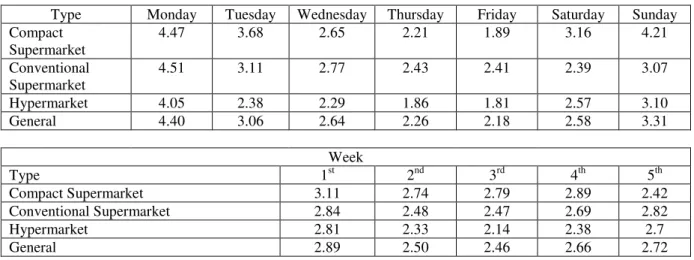
frequently at the beginning of the week (on Sundays, Mondays and Tuesdays). This probably occurs due to the growth in demand on these days, but also because of poor refilling of supermarket shelves with products from the suppliers to the retail distribution center and/or from the distribution center to the stores on Sundays. This information is important, for it could indicate a way to minimize retail stockouts. The daily and continuous work of refilling shelves may minimize the stockout rates found on the weekends.
Table 9: Stockout Frequency – Days of the Week and Weeks of the Month
Type Monday Tuesday Wednesday Thursday Friday Saturday Sunday
Compact Supermarket
4.47 3.68 2.65 2.21 1.89 3.16 4.21
Conventional Supermarket
4.51 3.11 2.77 2.43 2.41 2.39 3.07
Hypermarket 4.05 2.38 2.29 1.86 1.81 2.57 3.10
General 4.40 3.06 2.64 2.26 2.18 2.58 3.31
Week
Type 1st 2nd 3rd 4th 5th
Compact Supermarket 3.11 2.74 2.79 2.89 2.42
Conventional Supermarket 2.84 2.48 2.47 2.69 2.82
Hypermarket 2.81 2.33 2.14 2.38 2.7
General 2.89 2.50 2.46 2.66 2.72
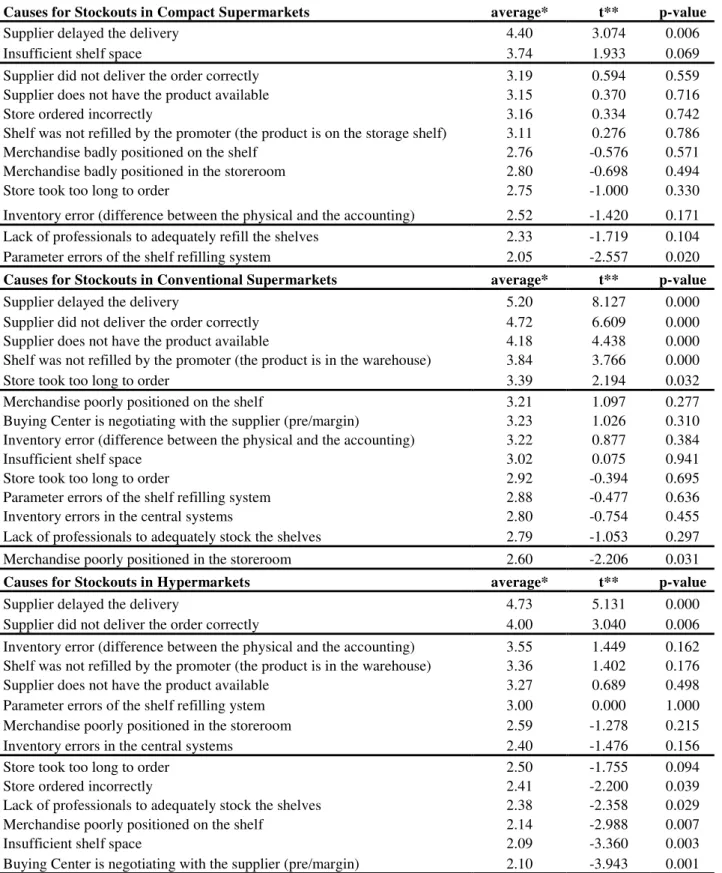
Main Causes of Stockouts and Those Responsible for Them
The managers’ perception of the stockout causes and those mostly responsible for them is shown in Table 10. The impact of each cause was evaluated by posing the following question to the retail manager: ‘In a typical month, stockout caused by factor is…’, and measured by using a seven point scale, where 1 meant ‘occasional’ and 7 meant ‘frequent’. In this case, we admit the null hypothesis that the average of the perception of the stockout cause isn’t different from 3 using the t sample test. The results of the test are shown in Table 10. The items greater than 3 and which are significant are shown on the upper part of the table, and the items of little importance and significance are shown on the lower part of the table.
Table 10: Causes and Those Responsible for the Stockout
Causes for Stockouts in Compact Supermarkets average* t** p-value
Supplier delayed the delivery 4.40 3.074 0.006
Insufficient shelf space 3.74 1.933 0.069
Supplier did not deliver the order correctly 3.19 0.594 0.559
Supplier does not have the product available 3.15 0.370 0.716
Store ordered incorrectly 3.16 0.334 0.742
Shelf was not refilled by the promoter (the product is on the storage shelf) 3.11 0.276 0.786
Merchandise badly positioned on the shelf 2.76 -0.576 0.571
Merchandise badly positioned in the storeroom 2.80 -0.698 0.494
Store took too long to order 2.75 -1.000 0.330
Inventory error (difference between the physical and the accounting) 2.52 -1.420 0.171
Lack of professionals to adequately refill the shelves 2.33 -1.719 0.104
Parameter errors of the shelf refilling system 2.05 -2.557 0.020
Causes for Stockouts in Conventional Supermarkets average* t** p-value
Supplier delayed the delivery 5.20 8.127 0.000
Supplier did not deliver the order correctly 4.72 6.609 0.000
Supplier does not have the product available 4.18 4.438 0.000
Shelf was not refilled by the promoter (the product is in the warehouse) 3.84 3.766 0.000
Store took too long to order 3.39 2.194 0.032
Merchandise poorly positioned on the shelf 3.21 1.097 0.277
Buying Center is negotiating with the supplier (pre/margin) 3.23 1.026 0.310 Inventory error (difference between the physical and the accounting) 3.22 0.877 0.384
Insufficient shelf space 3.02 0.075 0.941
Store took too long to order 2.92 -0.394 0.695
Parameter errors of the shelf refilling system 2.88 -0.477 0.636
Inventory errors in the central systems 2.80 -0.754 0.455
Lack of professionals to adequately stock the shelves 2.79 -1.053 0.297
Merchandise poorly positioned in the storeroom 2.60 -2.206 0.031
Causes for Stockouts in Hypermarkets average* t** p-value
Supplier delayed the delivery 4.73 5.131 0.000
Supplier did not deliver the order correctly 4.00 3.040 0.006
Inventory error (difference between the physical and the accounting) 3.55 1.449 0.162 Shelf was not refilled by the promoter (the product is in the warehouse) 3.36 1.402 0.176
Supplier does not have the product available 3.27 0.689 0.498
Parameter errors of the shelf refilling ystem 3.00 0.000 1.000
Merchandise poorly positioned in the storeroom 2.59 -1.278 0.215
Inventory errors in the central systems 2.40 -1.476 0.156
Store took too long to order 2.50 -1.755 0.094
Store ordered incorrectly 2.41 -2.200 0.039
Lack of professionals to adequately stock the shelves 2.38 -2.358 0.029
Merchandise poorly positioned on the shelf 2.14 -2.988 0.007
Insufficient shelf space 2.09 -3.360 0.003
Buying Center is negotiating with the supplier (pre/margin) 2.10 -3.943 0.001 *“In a typical month, stockout caused by factor is…” (1=occasional;
7=frequent)
**One Sample t- test (Ho : average =3)
C
ONCLUSIONS,
L
IMITATIONS ANDM
ANAGERIALI
MPLICATIONSBearing in mind that the objective of the survey was to investigate stockout rates in the supermarket chains in the state of São Paulo-Brazil, their causes and those responsible for them from the perspective of their own managers, the study evaluated different formats of supermarkets: compact, conventional and hypermarkets.
Conclusions
The stockout rates in the supermarkets of the state of São Paulo are very high, but compatible to the levels of supermarkets in more developed countries. The supermarket managers reported that the average stockout rate is 8.3%, and no significant differences in stockouts were found in the different supermarket formats. Shelf auditing is the measurement method that is used the most in retail. The results show that, in the opinion of the supermarket manager, the supplier is the one mostly responsible for stockouts. A summary of the result of the research is found in Table 11.
Table 11: Summary of the Conclusions
The stockout factor was considered the fifth most important factor by the managers in all kinds of supermarket formats. Compact and conventional supermarkets focus more on the factor of customer service. Hypermarkets focus more on the factors of low prices and promotions. This result is very different from the one found by Fisher et al. (2006), which identified stockouts as the most important factor in explaining customer satisfaction in an American retail chain. There is an incompatibility between the literature and the perception of the managers of Brazilian supermarkets. Fisher et al. (2006) state that managers should focus on improving two areas in order to attract their clients: stockout reduction and investment in the training of their employees. If Fisher et al.’s results (2006) are reproduced in the Brazilian culture, changes in focus will need to be made by Brazilian retail managers.
The category of items that mostly concerns the retail managers is hygiene, health and beauty, for all the formats of supermarkets selected this category as being the most critical. The manufacturers of these items should also be concerned, considering that a significant percentage of consumers tend to change brands when there is a stockout.
Format Measurement Main Causes
Compact Supermarket Visual Shelf
Auditing 9.1 %
Supplier delayed the delivery Insufficient shelf space
Conventional Supermarket 8.5 % Supplier delayed the delivery
Supplier did not deliver the order correctly Supplier does not have the product available Shelf was not replenished
Store took too long to order
Hypermarket Supplier delayed the delivery
Supplier did not deliver the order correctly 7.1 %
Visual Shelf Auditing
Stockouts happen most frequently on Sundays, Mondays and Tuesdays, probably because of the growth in demand and lack of shelf refilling on the weekends. This information is important, because it could indicate a way to minimize retail stockouts. The continuous daily work of refilling shelves could minimize stockout rates found on the weekends.
There are many causes of stockouts. The research shows that the supermarket managers consider the flaws in the supplier logistics process, such as the delay in delivery and/or incorrect delivery of the order, to be the main cause of stockouts. This result was unexpected, considering that previous studies pointed to the retailers themselves as being responsible for the stockout problems (ACNielsen, 2004; Corsten & Gruen, 2003). This shows that the results of international research may not correspond to the Brazilian reality. The committee of retail professionals has said that stockouts vary a great deal from one supplier to another and according to the region of Brazil, and that high levels of stock do not necessarily guarantee the availability of products. As a result, the retailers and the manufacturers should use caution in considering the results of the stockout research from other countries, and should invest in the knowledge of their own reality.
Limitations
There are limitations in this research as in any other. The first limitation is the size of the sample of 108 respondents compared to the supermarket population of the state of São Paulo. We have only 1,000 retail professionals affiliated to the APAS; however, the number of supermarkets of the state of São Paulo is 12,425 units (ACNielsen, 2007). Another limitation is the regional focus of the study – the state of São Paulo – which prevents discussion and the comparison of stockout rates with those of different states; results may be different in another region. The group of respondents is also more representative of conventional supermarkets and hypermarkets and less representative of compact supermarkets with respect to the total members of the APAS.
Finally, the research was done using a list of email addresses to facilitate the collection of data. The answer rate might be higher using traditional mail with adequate incentive systems. However, the financial resources made available to conduct this study were a determining factor in the selection of the electronic channel for the collection of data.
Managerial Implications
This study suggests that the stockout percentages are high, but can be reduced through joint actions of industry and retail in order to achieve more effective results.
The first step is consistent stockout measuring. An automatic system of stockout measurement needs to be created. Visual shelf auditing is the most adopted and recommended method. Despite the high cost it incurs for obtaining information, it is the most reliable method. It is important for the retailers to get all their own employees and the suppliers’ employees involved in this activity, in order to not only reduce the cost of data collection, but also to help with the solution of the problems identified.
It is essential to identify the causes to be able to generate corrective actions. One important recommendation is the application of the concepts of the Toyota Production System [TPS] to the retail processes for reduction of stockouts and waste, which involves managerial actions, such as: implementing the Just in Time [JIT] philosophy to reduce inventory, using techniques of Statistical Process Control to monitor the performance of the main items and to identify the problems, implementing the technique of Quality Control Circles [QCC] and Plan-Do-Check-Act [PDCA] to engage the people in the solution of the problem, exchanging information with the suppliers in order for them to help administrate the availability of products in the store and others.
Therefore, it is reasonable to accept that a certain stockout level will always exist, and that offering remedies to keep consumers from leaving the store is another efficient way to manage retail stockouts.
Opportunities for Future Studies
One of the aspects that mostly called the attention of the researchers was the low relative importance given to stockouts by the managers, being rated after items like customer service, low prices, promotions and variety of goods and services, respectively. The question that arises from this conclusion is: Would the issue of stockouts be given the same relative importance from the consumers’ point of view as it was given in this research from the managers’ point of view? Fisher et al. (2006) point to exactly the opposite. They cite the issue of stockouts as one of the most important factors that affect customer satisfaction with a retail chain. Therefore, a more detailed investigation of the theme in the Brazilian scenario would be appropriate.
Another theme that the researchers came into contact with during the study, and which they were particularly interested in, was that of the possible consumer reactions to a stockout. Although the possible consumer behaviors represented by the acronym SDL (substitute the item, delay the purchase or leave the store) have been explored by international literature (Gruen et al., 2002), and have also been considered in a case of specific/practical application by a study such as the one conducted by ACNielsen, there is no more detailed academic investigation of the matter. Questions remain, such as: What is the reaction of the Brazilian consumer to stockouts? Are there significant differences in reactions depending on the categories of products? Does the social position of the consumers have any influence on their reactions to stockouts? The unfolding of the stockout issue and its pointing to studies that involve the consumer seem to be fertile ground for future investigations, and indicate a possible path to be followed by researchers.
R
EFERENCESAndersen Consulting. (1996). Where to look for incremental sales: the retail problem of stockout merchandise. Atlanta, GA: Author.
Anderson, E. T., Fitzsimons, G. J., & Simester, D. (2006). Measuring and mitigating the costs of stockouts. Management Science, 52(11), 1751-1763.
Arthur Charles Nielsen. (2004). Ruptura: causas e impactos na cadeia de abastecimento e no
comportamento do consumidor. Retrieved October 19, 2008, from http://
www.amcham.com.br/download/informativo2004-10-20h_arquivo
Arthur Charles Nielsen. (2007). Estrutura do varejo e domicílios brasileiros. Retrieved May 26, 2009, from http://br.nielsen.com/pubs/rfid.shtml
Bhargava, H. K., Sun, D., & Xu, S. H. (2006). Stockout compensation: joint inventory and price optimization in electronic retailing. Journal on Computing, 18(2), 255-266.
Campo, K., Gijsbrechts, E., & Nisol, P. (2000). Towards understanding consumer response to stockouts. Journal of Retailing, 76(2), 219-242.
Charlton, P., & Ehrenberg, A. S. C. (1976). An experiment in brand choice. Journal of Marketing Research, 13, 152-160.
Emmelhainz, L. W., Emmelhainz, M. A., & Stock, J. R. (1991). Logistics implications of retail stockouts. Journal of Business Logistics, 12(2), 129-141.
Fisher, M. L., Krishnan, J., & Netessine, S. (2006). Retail store execution: an empirical study. University of Pennsylvania, the Wharton School and Research Center: Operations and Information Management Department. Retrieved December 1, 2006, from http://knowledge.wharton.upenn.edu/papers/1336.pdf
Fitzsimons, G. J. (2000). Consumer response to stockouts. Journal of Consumer Research, 27(2), 249-266.
Gruen, T., & Corsten, D. S. (2007). A comprehensive guide to retail out-of-stock reduction in the fast-moving consumer goods industry. The University of Colorado and the IE Business School
Madrid. Retrieved January 10, 2007, from
http://www.fmi.org/forms/uploadFiles/31E8E0000006D.toc.TOC_out_of_stock.pdf
Gruen, T. W., Corsten, D. S., & Bharadwaj, S. (2002). Retail stockouts: a worldwide examination of extent, causes and consumer responses. University of Colorado, The Food Marketing Institute and CIES – The Food Business Forum. Retrieved April 18, 2002, from http://knowledge.wharton.upenn.edu/papers/1336.pdf
Peckham, J. O. (1963). The consumer speaks. Journal of Marketing, 27(4), 21-26.
Progressive Grocer. (1968). The stockout study: a crusade against stockouts. The National Association of Food Chains and A. C. Nielsen (pp. S1-S31). Retrieved May 26, 2009, from https://www4.infotrieve.com/neworders/Order_Cart.asp
Roland Berger. (2003). Optimal shelf availability - Increasing shopper satisfaction at the moment of truth. Kontich. Belgium: ECR Europe and Roland Berger. Retrieved May 26, 2009, from https://www4.infotrieve.com/neworders/Order_Cart.asp
Schary, P. B., & Becker, B. W. (1978). The impact of stock-out on market share: temporal effects. Journal of Business Logistics, 1(1), 31-44.
Schary, P. B., & Christopher, M. (1979). The anatomy of a stock-out. Journal of Retailing, 55(2), 59-67.
Sloot, L. M., Verhoef, P. C., & Franses, P. H. (2005). The impact of brand equity and the hedonic level of products on consumer stock-out reactions. Journal of Retailing, 81(1), 15-34.
Straughn, K. (1991). The relationship between stock-outs and brand share. Unpublished doctoral dissertation, Florida State University.
Tallahassee, FL, USA.
Verbeke, W., Farris, P., & Thurik, R. (1998). Consumer response to the preferred brand stockout situation. European Journal of Marketing, 32(11), 1008-1028.
Walter, C. K., & Grabner, J. R. (1975). Stockout models: empirical tests in a retail situation. Journal of Marketing, 39(3), 56-68.
![Table 8 compares the values given by the managers (1: low; 7: high) to the stockout levels in different categories of products in the three formats of supermarkets using the method of Analysis of Variance [ANOVA]](https://thumb-eu.123doks.com/thumbv2/123dok_br/18922591.435774/11.892.117.818.856.1029/compares-managers-stockout-different-categories-supermarkets-analysis-variance.webp)