Article
Printed in Brazil - ©2017 Sociedade Brasileira de Química 0103 - 5053 $6.00+0.00
*e-mail: [email protected]
Determination of Rare Earth Elements in Some Flower Herb Teas and their Infusions
Zhanglin Ni,a Chuanyi Ren,a Junyong Chengb and Fubin Tang*,a
aResearch Institute of Subtropical Forestry, Chinese Academy of Forestry, No. 73 Daqiao Street,
311400 Fuyang, Zhejiang, P. R. China
bHubei Academy of Forestry, No.39 Fengling Road, Forest Avenue,
East Lake and New Technology Development District, 430075 Wuhan, Hubei, P. R. China
The aim of this study was to determine the sixteen rare earth elements (REEs) in twelve types of popular flower herb teas and their infusions consumed in China. Microwave-assisted acid digestion was used for all of the samples, and the contents of these elements were determined by inductively coupled plasma mass spectrometry (ICP-MS). The concentrations of REEs varied from 94.6 to 7492 µg kg-1 among these flower samples. Ce was the most abundant elements in all flower samples (27.3-3016 µg kg-1). The leached ratios of REEs for each type of tea ranged from 7.3% (globe amaranth) to 29.8% (carnation). The leach ratios of REEs in these flower herb teas were at different percentages depending on types of flowers. The daily intake of rare earth oxides from these flower herb tea infusions may not produce any health risks.
Keywords: rare earth elements, flower herb tea, infusion, health risk assessment
Introduction
The history of drinking herb tea can be traced back to as early as ancient Egypt, while nowadays herb tea is widely consumed all over the world due to their mild features, relatively low price and low side effects. China is one of the countries with high consumption of herb tea products. Among these products, flower herb tea is the most popular drinks consumed by Chinese in daily life. Their consumptions have been recognized to exhibit many health benefits. For example, roselle (Hibiscus sabdariffa L.)
can control or lower the blood pressure;1 honeysuckle
(Lonicera japonica Thunb) is extensively used for
releasing the fever, and some has natural antiphlogistic effect.2,3 Many flower herb teas can send out pleasing
fragrance after brewing, which make people relaxing. The commercialization of flower herb tea has increased by many folds in the past few years in China.
Generally, the chemical contaminants in herb tea were classified into toxic metals and non-metals, where the heavy metal is an issue of major concern. Due to the importance of heavy metal present in herbs, several studies have been carried out to determine their levels.4-7
By comparison with heavy metal, the levels of rare earth
elements (REEs) in herb tea receive little concern. Some evidences show that excessive exposure to rare earth oxides (REOs) is harmful to human health such as leukemia.8,9
Dietary intake is the main pathway of exposure to REOs by human who are not regularly exposed to REEs polluted environments. Of the available studies, rare earth elements have been used extensively to discriminate the geological origin of plants because the absorption of REEs of plants is associated with the REEs character of soil.10-13 REEs in
teas and their infusion have been raised concern regarding the high values observed.12-14 For example, Guo et al.12 has
studied the content of REEs in various types of Oolong tea, varying from 0.62 to 10.1 mg kg-1, with the leached rated
of 9.86-32.6%. The maximum limits of REEs for nuts established by Ministry of Health P.R. China is 2 mg kg-1
for tea and cereal products.15 In addition, the estimated daily
intake (EDI) of REEs has been proposed by some Chinese researches based on animal experiments.16,17
To the best of our knowledge, limited number of studies concerned on the concentration of REEs in flower herb tea and their infusion. To ensure that REE levels in flower herb teas are safe for consumers, the main objectives of this study were: (i) determine the contents of REEs levels in various
flower herb teas, (ii) study the leaching rate of REEs of various
varieties of flower herb teas, and (iii) estimate the health risks
Experimental
Reagents and standards
Nitric acid (trace metal grade, 69%, Fisher, Canada) and hydrogen peroxide (guaranteed reagent, 30%, Guanghua Sci-Tech, Tianjin, China) were used for the digestion of flower herb tea samples. REEs standard solution including La, Ce, Pr, Nd, Sm, Eu, Gd, Tb, Dy, Ho, Er, Tm, Yb, Lu, Sc, and Y was purchased from PerkinElmer (Shelton, CT, USA). The standard solution of the element Re used as an internal standard to calibrate the matrix interference was provided by the National Analysis Center of Iron and Steel (Beijing, China).
Apparatus
All solutions were prepared using deionized water purified by a Milli-Q system (Millipore, Bedford, MA, USA). A Mars 6 microwave oven (Cem, Matthews, NC, USA) was applied for decomposing the flower herb tea samples. A PerkinElmer ICP-MS (NexIon 300D, Shelton, CT, USA) instrument was used for the analysis of rare earth elements. Inductively coupled plasma mass spectrometry (ICP-MS) measurement conditions were optimized on daily basis.
Sample collection
A total of 54 dried flower herb teas were collected from farm product market and supermarket in Hangzhou, China and online store. Twelve varieties of flower herb tea with great consumption in China were selected. They included rose
(Rosa rugosa Thunb), roselle (Hibicus sabdariffa L.), carnation
(Dendranthema indicum), jasmine (Jasminum sambac (L.)
Ait), lily (Lilium brownii var. viridulum), Calendula officinalis
(Calendula officinalis L.), honeysuckle (Lonicera Japanica
Thunb), tribute chrysanthemum (Dendranthema morifolium),
Coreopsis tinctoria (Sanvitalia procumbens Lam.),
globe amaranth (Gomphrena globosa L.), chamomile
(Chrysanthemum lavandulifolium (Fisch.ex Trautv.)) and
peony (Paeonia suffruticosa Andr.). Flower herbs were finely
ground with a stainless steel blender, transferred into plastic bags prior to the total REEs analysis.
Sample preparation and digestion
Milled flower samples (ca. 0.25 g) were accurately weighed into a pre-cleaned Teflon tube, followed by the addition of 5.0 mL of concentrated HNO3 and 1.0 mL 30%
(m/m) H2O2. The Teflon tube was placed in the microwave
oven. The temperature was increased to 130 °C in 10 min,
and maintained for 10 min, and then further increased to 200 °C in 5 min and maintained for 30 min. After cooling,
the solution was transferred into a Teflon beaker, which was then heated nearly to dryness at 200 °C and diluted to
10 mL with deionized water. For sample preparation, one blank, one reference material (citrus leaf, GBW10020, Institute of Geophysical and Geochemical Exploration of China, Beijing, China), and three replicate for each sample were performed on each batch.
The infusions were prepared as Chinese consumption habit of flower herb tea. Dried flower (2 g, unground) was transferred into a glass beaker, followed by addition of 200 mL of boiling deionized water, and the infusion was left at room temperature for 20 min. The supernatant was filtered with an ashless filter paper. A 20.0 mL volume of this solution was transferred into the Teflon tube, and then evaporated nearly to dryness at 150 °C. After cooling,
1.0 mL of concentrated HNO3 and 1.0 mL 30% (m/m)
H2O2 were added. The solutions were digested by using
the microwave method as above described. Finally, the digested solutions were diluted to 10.0 mL with deionized water.
ICP-MS analysis
The details of the ICP-MS parameters information are given in Table 1. Some oxides can generate polyatomic interferences such as the oxides interference of 135Ba16O+
on 151Eu+ measurement, and some isotope mass of REEs
are very close. These interferences may cause substantial variations from the actual values, in particular, when the REEs are at trace and ultra trace levels. Therefore, a solution of 1 µg L−1 Li, Be, Mg, Fe, In, Ce, Pb, and U was
used to optimize the instrumental parameters, in particular, to minimize the oxide ratio, 156CeO+/140Ce+ < 1.5%, 151BaO+/135Ba+ < 0.2%. Additionally, some calibration
equations (Table 1) were applied to correct the isotope mass interferences. External calibration with REEs multi-element standard solutions (0, 0.01, 0.05, 0.2, 1, 2, 5 µg L−1)
was used for ICP-MS analysis. The pH of flower herb tea infusion was analyzed using Sartorius PB-10 (Sartorius Instruments, Beijing, China).
Quality control
20/10), which were adequate for the determination of REEs concentrations in flower herb tea samples and its tea infusion (Table 2). The precision of the method, expressed as the relative standard deviation (RSD, %) at 0.01 µg L–1
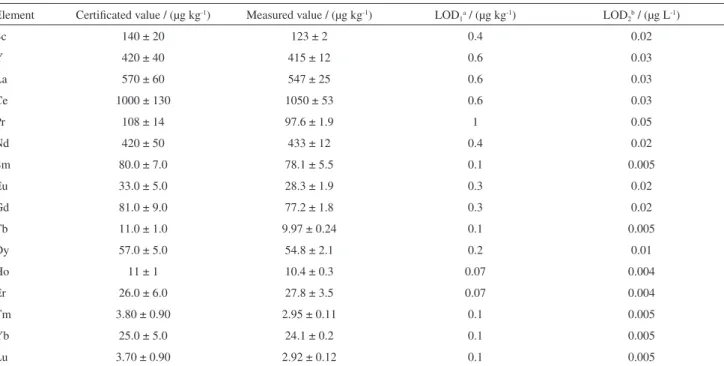
concentration level for the REEs were all < 3%. Accuracy validation of the ICP-MS procedure was made by analyzing a certified reference material (citrus leaf, GBW10020). The results are listed in Table 2 and mean values obtained from this experiment were in good agreement with the reference mean values, thus demonstrating the excellent accuracy of the selected method.
Results and Discussion
REEs contents of the flower herb tea
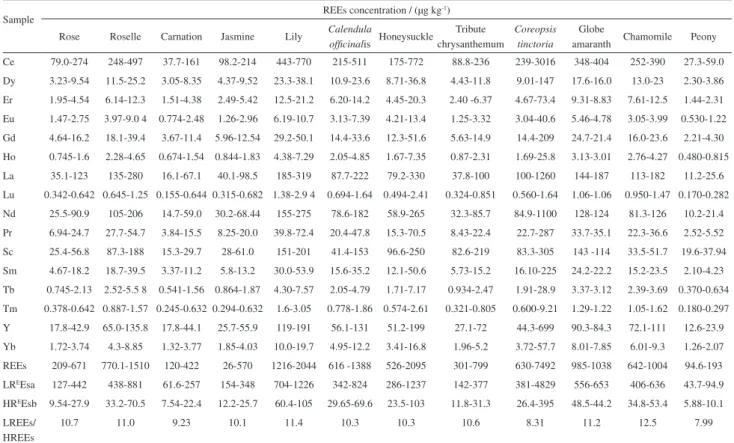
The REEs of the flower herb tea are listed in Table 3. The values of REEs in various types of flower herb tea varied from 94.6 to 7492 µg kg-1, the highest REEs content was
found in Coreopsis tinctoria, and the lowest in peony. The
REEs values of honeysuckle are in agreement with those reported by our previous report,18 and the REEs levels of the
rest of the flowers were not found in literature. The levels of REEs in most measured flower samples were similar to the values of green tea leaf (Camellia sinensisL.)12,19
from China and wild mushroom from Poland,20 and were
much higher than the values of rice and wheat21 that was
consider to be a main source of dietary REEs in China.
Table 1. Operation parameters of ICP-MS
Parameter Setting parameter
RF power / W 1500
Nebulizer (carrier gas) flow rate / (L min−1)
0.98
Coolant gas flow / (L min−1) 15
Analog stage voltage / V −1870
Pulse stage voltage / V 1250
Lens voltage / V 6.80
Sweeps 20
Reading 1
Number of replicates 3
Scanning mode peak hopping
Sampling cone orifice (Ni) / mm 1.2
Skimmer cone orifice (Ni) / mm 1.0
Isotope mass 139La, 140Ce, 142Nd, 144Pr, 152Sm, 151Eu, 158Gd, 159Tb, 164Dy, 165Ho, 166Er, 169Tm, 174Yb, 175Lu, 45Sc, and
89Y
Calibration equation Nd: −0.125653 × 140Ce,
Sm: −0.012780 × 157Gd,
Gd: −0.004016 × 163Dy,
Dy: −0.047902 × 166Er,
Yb: −0.005865 × 178Hf,
Eu: −0.000850 × 135Ba
Table 2. Limits of detection of rare earth elements and concentrations (mean ± standard deviation) in certificated value (GBW10020) and flower herb tea samples
Element Certificated value / (µg kg-1) Measured value / (µg kg-1) LOD
1a / (µg kg-1) LOD2b / (µg L-1)
Sc 140 ± 20 123 ± 2 0.4 0.02
Y 420 ± 40 415 ± 12 0.6 0.03
La 570 ± 60 547 ± 25 0.6 0.03
Ce 1000 ± 130 1050 ± 53 0.6 0.03
Pr 108 ± 14 97.6 ± 1.9 1 0.05
Nd 420 ± 50 433 ± 12 0.4 0.02
Sm 80.0 ± 7.0 78.1 ± 5.5 0.1 0.005
Eu 33.0 ± 5.0 28.3 ± 1.9 0.3 0.02
Gd 81.0 ± 9.0 77.2 ± 1.8 0.3 0.02
Tb 11.0 ± 1.0 9.97 ± 0.24 0.1 0.005
Dy 57.0 ± 5.0 54.8 ± 2.1 0.2 0.01
Ho 11 ± 1 10.4 ± 0.3 0.07 0.004
Er 26.0 ± 6.0 27.8 ± 3.5 0.07 0.004
Tm 3.80 ± 0.90 2.95 ± 0.11 0.1 0.005
Yb 25.0 ± 5.0 24.1 ± 0.2 0.1 0.005
Lu 3.70 ± 0.90 2.92 ± 0.12 0.1 0.005
aLOD
Despite the limited sampling numbers of each flower, the values of REEs in different flowers indicate that variety is an important factor for the accumulation of REEs.
Of the sixteen measured elements, the content of Ce (27.3-3016 µg kg-1) was the most abundant in
all flower herb tea sample, followed by the content of La (11.2-1260 µg kg-1), Nd (10.2-1100 µg kg-1),
Y (12.6-699 µg kg-1) and Sc (15.3-305 µg kg-1), which
was similar to the previously reported results in terrestrial plant such as tomato,22 tea leaf,19 and navel orange23 from
China. The contents of Ce, La, Sc, Y and Nd accounted for 84.5-89.7% of REEs in all of measured samples. The contents of Lu were the lowest among these REEs in all flower herb tea sample, followed by the content of Tm and Tb. The content values of light rare earth elements (LREEs) were much higher than the values of heavy rare earth elements (HREEs) in all measured flower samples. The ratios of LREEs to HREEs ranged from 7.99 to 12.5 which were similar to the values of tea leaf in China12,19 (Table 3).
REEs contents of the flower herb tea infusion
Actual amount of exposure to REEs by drinking these flower herb tea infusion was evaluated by determining
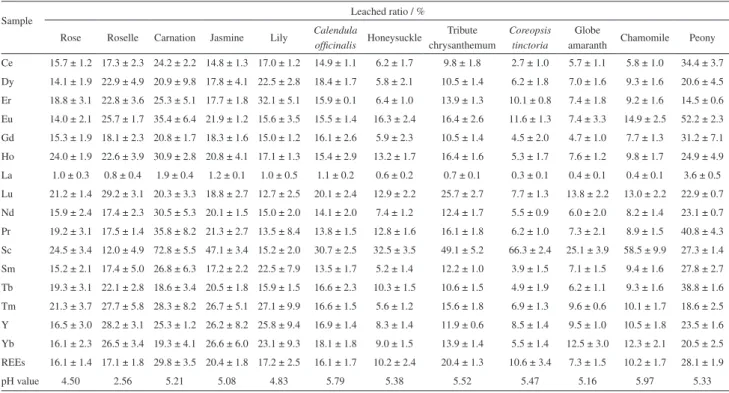
the concentrations of infusions in these flowers. The concentration ranges of sixteen REEs determined in 12 types of flower herb tea infusions were calculated on the basis of 2 g of herb tea in 200 mL. In this study, the leached ratio (LR) was calculated as follow:
(1)
Here, C1 is the REEs concentration in flower herb tea
infusion (µg L-1), C
2 is the REEs content in flower herb tea
(µg kg-1), V is the volume of leaching water (200 mL), and
m is the mass of flower herb tea for leaching (2 g). As shown in Table 4, the leached ratios of each type of tea ranged from 7.3% (gobe amaranth) to 29.8% (carnation). In this study, the REEs leached ratios of these flowers were lower than those in most types of tea leaves (Camellia sinensis L.)
(25.8-51.0%). The element of La was the most difficult to leach into the infusion in all flower samples. The mean leached ratios of each REE in each type of flower varied from 0.4 (La) to 72.8% (Sc). The leached ratios of most REEs significantly varied among the different types of flower. For example, the leached rates of Ce were 5.0% for globe amaranth, while it was 34.4% for peony.
Table 3. Rare earth elements (REEs) concentrations in flower herb tea samples
Sample REEs concentration / (µg kg
-1)
Rose Roselle Carnation Jasmine Lily Calendula
officinalis Honeysuckle
Tribute chrysanthemum
Coreopsis tinctoria
Globe
amaranth Chamomile Peony Ce 79.0-274 248-497 37.7-161 98.2-214 443-770 215-511 175-772 88.8-236 239-3016 348-404 252-390 27.3-59.0 Dy 3.23-9.54 11.5-25.2 3.05-8.35 4.37-9.52 23.3-38.1 10.9-23.6 8.71-36.8 4.43-11.8 9.01-147 17.6-16.0 13.0-23 2.30-3.86 Er 1.95-4.54 6.14-12.3 1.51-4.38 2.49-5.42 12.5-21.2 6.20-14.2 4.45-20.3 2.40 -6.37 4.67-73.4 9.31-8.83 7.61-12.5 1.44-2.31 Eu 1.47-2.75 3.97-9.0 4 0.774-2.48 1.26-2.96 6.19-10.7 3.13-7.39 4.21-13.4 1.25-3.32 3.04-40.6 5.46-4.78 3.05-3.99 0.530-1.22 Gd 4.64-16.2 18.1-39.4 3.67-11.4 5.96-12.54 29.2-50.1 14.4-33.6 12.3-51.6 5.63-14.9 14.4-209 24.7-21.4 16.0-23.6 2.21-4.30 Ho 0.745-1.6 2.28-4.65 0.674-1.54 0.844-1.83 4.38-7.29 2.05-4.85 1.67-7.35 0.87-2.31 1.69-25.8 3.13-3.01 2.76-4.27 0.480-0.815 La 35.1-123 135-280 16.1-67.1 40.1-98.5 185-319 87.7-222 79.2-330 37.8-100 100-1260 144-187 113-182 11.2-25.6 Lu 0.342-0.642 0.645-1.25 0.155-0.644 0.315-0.682 1.38-2.9 4 0.694-1.64 0.494-2.41 0.324-0.851 0.560-1.64 1.06-1.06 0.950-1.47 0.170-0.282 Nd 25.5-90.9 105-206 14.7-59.0 30.2-68.44 155-275 78.6-182 58.9-265 32.3-85.7 84.9-1100 128-124 81.3-126 10.2-21.4 Pr 6.94-24.7 27.7-54.7 3.84-15.5 8.25-20.0 39.8-72.4 20.4-47.8 15.3-70.5 8.43-22.4 22.7-287 33.7-35.1 22.3-36.6 2.52-5.52 Sc 25.4-56.8 87.3-188 15.3-29.7 28-61.0 151-201 41.4-153 96.6-250 82.6-219 83.3-305 143 -114 33.5-51.7 19.6-37.94 Sm 4.67-18.2 18.7-39.5 3.37-11.2 5.8-13.2 30.0-53.9 15.6-35.2 12.1-50.6 5.73-15.2 16.10-225 24.2-22.2 15.2-23.5 2.10-4.23 Tb 0.745-2.13 2.52-5.5 8 0.541-1.56 0.864-1.87 4.30-7.57 2.05-4.79 1.71-7.17 0.934-2.47 1.91-28.9 3.37-3.12 2.39-3.69 0.370-0.634 Tm 0.378-0.642 0.887-1.57 0.245-0.632 0.294-0.632 1.6-3.05 0.778-1.86 0.574-2.61 0.321-0.805 0.600-9.21 1.29-1.22 1.05-1.62 0.180-0.297 Y 17.8-42.9 65.0-135.8 17.8-44.1 25.7-55.9 119-191 56.1-131 51.2-199 27.1-72 44.3-699 90.3-84.3 72.1-111 12.6-23.9 Yb 1.72-3.74 4.3-8.85 1.32-3.77 1.85-4.03 10.0-19.7 4.95-12.2 3.41-16.8 1.96-5.2 3.72-57.7 8.01-7.85 6.01-9.3 1.26-2.07 REEs 209-671 770.1-1510 120-422 26-570 1216-2044 616 -1388 526-2095 301-799 630-7492 985-1038 642-1004 94.6-193 LREEsa 127-442 438-881 61.6-257 154-348 704-1226 342-824 286-1237 142-377 381-4829 556-653 406-636 43.7-94.9
HREEsb 9.54-27.9 33.2-70.5 7.54-22.4 12.2-25.7 60.4-105 29.65-69.6 23.5-103 11.8-31.3 26.4-395 48.5-44.2 34.8-53.4 5.88-10.1
LREEs/ HREEs
10.7 11.0 9.23 10.1 11.4 10.3 10.3 10.6 8.31 11.2 12.5 7.99
The pH value is considered to be an important factor to affect the solubility and complexation of REEs.24,25 In this
study, the pH value of each flower herb infusion varied in the range of 2.56-5.97 (Table 4). Due to high content of water-soluble organic acids, the pH value of roselle infusion (2.56) was significant lower than values in other flower infusions (4.55-5.97) measured in this study. However, in this study, no significant correlation was observed between the pH values and REEs concentration of the flower herb tea infusions. Only the concentration of Y and Yb in these infusions exhibited significant correlation with the pH values (p < 0.05).
Health risk assessment
Daily REEs intake depends on both element concentration in flower herb tea infusion and the daily drinking volume. Estimated daily intake (EDI) was calculated as:
EDI = CREOs × Mrdc × LR (2)
Here, EDI is the estimated daily intake of rare element oxides (REOs) (µg day–1 person–1); C
REOs is the REOs
concentration in flower herb tea infusion; and Mrdc is
the mass of flower herb tea consumed daily in China (according to Chinese consumption habit of flower herb tea, Mrdc = 5 g day–1 for adults); LR is the leached ratio of REOs
of infusion. The factors for converting REEs to REOs were 1.228 (Ce-Ce2O3), 1.148 (Dy-Dy2O3), 1.143 (Er-Er2O3),
1.158 (Eu-Eu2O3), 1.153 (Gd-Gd2O3), 1.146 (Ho-H2O3),
1.173 (La-La2O3), 1.137 (Lu-Lu2O3), 1.166 (Nd-Nd2O3),
1.208 (Pr-Pr2O3), 1.534 (Sc-Sc2O3), 1.160 (Sm-Sm2O3),
1.176 (Tb-Tb2O3), 1.142 (Tm-Tm2O3), 1.270 (Y-Y2O3) and
1.139 (Yb-Yb2O3). EDI was compared with the dietary
reference intake (DRI) for REOs (4200 µg day–1 person–1)
proposed by Zhu et al.,16 who carried out a comprehensive
investigation in a REE-rich area in China, and animal experiments. As shown in Table 5, the EDI of each type of flower herb tea infusions ranged from 0.31 (peony) to 2.07 (lily), and the maximum EDI (5.67) value was found in Coreopsis tinctoria. All these values account for
0.01 to 0.05% of DRI. According to the investigation by Zhou et al.,17 the average daily dietary intake of REOs was
250.9 µg day–1 for adults in China, and the main sources of
REOs were cereal and vegetable in most parts of China, which accounted for 28.6 and 24.7%, respectively. The above-calculated EDI of REOs through drinking flower herb tea is negligible. Thus, the ingestion of REOs by drinking flower herb tea is harmless to human health.
Conclusions
The content of REEs in flower herb tea ranged from 94.6 to 7492 µg kg-1. The most abundant REEs were Ce, La,
Sc, Y and Nd as the content of these elements accounting
Table 4. Leached ratios (%) of rare earth elements (REEs) concentrations of flower herb tea by three successive infusions
Sample Leached ratio / %
Rose Roselle Carnation Jasmine Lily Calendula
officinalis Honeysuckle
Tribute chrysanthemum
Coreopsis tinctoria
Globe
amaranth Chamomile Peony Ce 15.7 ± 1.2 17.3 ± 2.3 24.2 ± 2.2 14.8 ± 1.3 17.0 ± 1.2 14.9 ± 1.1 6.2 ± 1.7 9.8 ± 1.8 2.7 ± 1.0 5.7 ± 1.1 5.8 ± 1.0 34.4 ± 3.7 Dy 14.1 ± 1.9 22.9 ± 4.9 20.9 ± 9.8 17.8 ± 4.1 22.5 ± 2.8 18.4 ± 1.7 5.8 ± 2.1 10.5 ± 1.4 6.2 ± 1.8 7.0 ± 1.6 9.3 ± 1.6 20.6 ± 4.5 Er 18.8 ± 3.1 22.8 ± 3.6 25.3 ± 5.1 17.7 ± 1.8 32.1 ± 5.1 15.9 ± 0.1 6.4 ± 1.0 13.9 ± 1.3 10.1 ± 0.8 7.4 ± 1.8 9.2 ± 1.6 14.5 ± 0.6 Eu 14.0 ± 2.1 25.7 ± 1.7 35.4 ± 6.4 21.9 ± 1.2 15.6 ± 3.5 15.5 ± 1.4 16.3 ± 2.4 16.4 ± 2.6 11.6 ± 1.3 7.4 ± 3.3 14.9 ± 2.5 52.2 ± 2.3 Gd 15.3 ± 1.9 18.1 ± 2.3 20.8 ± 1.7 18.3 ± 1.6 15.0 ± 1.2 16.1 ± 2.6 5.9 ± 2.3 10.5 ± 1.4 4.5 ± 2.0 4.7 ± 1.0 7.7 ± 1.3 31.2 ± 7.1 Ho 24.0 ± 1.9 22.6 ± 3.9 30.9 ± 2.8 20.8 ± 4.1 17.1 ± 1.3 15.4 ± 2.9 13.2 ± 1.7 16.4 ± 1.6 5.3 ± 1.7 7.6 ± 1.2 9.8 ± 1.7 24.9 ± 4.9 La 1.0 ± 0.3 0.8 ± 0.4 1.9 ± 0.4 1.2 ± 0.1 1.0 ± 0.5 1.1 ± 0.2 0.6 ± 0.2 0.7 ± 0.1 0.3 ± 0.1 0.4 ± 0.1 0.4 ± 0.1 3.6 ± 0.5 Lu 21.2 ± 1.4 29.2 ± 3.1 20.3 ± 3.3 18.8 ± 2.7 12.7 ± 2.5 20.1 ± 2.4 12.9 ± 2.2 25.7 ± 2.7 7.7 ± 1.3 13.8 ± 2.2 13.0 ± 2.2 22.9 ± 0.7 Nd 15.9 ± 2.4 17.4 ± 2.3 30.5 ± 5.3 20.1 ± 1.5 15.0 ± 2.0 14.1 ± 2.0 7.4 ± 1.2 12.4 ± 1.7 5.5 ± 0.9 6.0 ± 2.0 8.2 ± 1.4 23.1 ± 0.7 Pr 19.2 ± 3.1 17.5 ± 1.4 35.8 ± 8.2 21.3 ± 2.7 13.5 ± 8.4 13.8 ± 1.5 12.8 ± 1.6 16.1 ± 1.8 6.2 ± 1.0 7.3 ± 2.1 8.9 ± 1.5 40.8 ± 4.3 Sc 24.5 ± 3.4 12.0 ± 4.9 72.8 ± 5.5 47.1 ± 3.4 15.2 ± 2.0 30.7 ± 2.5 32.5 ± 3.5 49.1 ± 5.2 66.3 ± 2.4 25.1 ± 3.9 58.5 ± 9.9 27.3 ± 1.4 Sm 15.2 ± 2.1 17.4 ± 5.0 26.8 ± 6.3 17.2 ± 2.2 22.5 ± 7.9 13.5 ± 1.7 5.2 ± 1.4 12.2 ± 1.0 3.9 ± 1.5 7.1 ± 1.5 9.4 ± 1.6 27.8 ± 2.7 Tb 19.3 ± 3.1 22.1 ± 2.8 18.6 ± 3.4 20.5 ± 1.8 15.9 ± 1.5 16.6 ± 2.3 10.3 ± 1.5 10.6 ± 1.5 4.9 ± 1.9 6.2 ± 1.1 9.3 ± 1.6 38.8 ± 1.6 Tm 21.3 ± 3.7 27.7 ± 5.8 28.3 ± 8.2 26.7 ± 5.1 27.1 ± 9.9 16.6 ± 1.5 5.6 ± 1.2 15.6 ± 1.8 6.9 ± 1.3 9.6 ± 0.6 10.1 ± 1.7 18.6 ± 2.5 Y 16.5 ± 3.0 28.2 ± 3.1 25.3 ± 1.2 26.2 ± 8.2 25.8 ± 9.4 16.9 ± 1.4 8.3 ± 1.4 11.9 ± 0.6 8.5 ± 1.4 9.5 ± 1.0 10.5 ± 1.8 23.5 ± 1.6 Yb 16.1 ± 2.3 26.5 ± 3.4 19.3 ± 4.1 26.6 ± 6.0 23.1 ± 9.3 18.1 ± 1.8 9.0 ± 1.5 13.9 ± 1.4 5.5 ± 1.4 12.5 ± 3.0 12.3 ± 2.1 20.5 ± 2.5 REEs 16.1 ± 1.4 17.1 ± 1.8 29.8 ± 3.5 20.4 ± 1.8 17.2 ± 2.5 16.1 ± 1.7 10.2 ± 2.4 20.4 ± 1.3 10.6 ± 3.4 7.3 ± 1.5 10.2 ± 1.7 28.1 ± 1.9
for 84.5-89.7% of REEs in measured flower herb teas. For their infusions, the leached ratio of each type of flower ranged from 7.3 (globe amaranth) to 29.8 (carnation). The total content of REEs exhibited no significant correlation with the pH values of the infusion while concentrations of Y and Yb exhibited significant correlation with the pH values (p < 0.05) of the infusion. After calculating the EDI,
it confirms that the risk to the human health of REOs by drinking flower herb teas is negligible.
Acknowledgments
This work was supported by the Zhejiang province and institute cooperative project (2014SY12).
References
1. Tsai, P. J.; Mcintosh, J.; Pearce, P.; Camden, B.; Jordan, B. R.;
Food Res. Int. 2002, 35, 351.
2. Chen, X. Y.; Wu, T. X.; Liu, G. J.; Wang, Q.; Zheng, J.; Wei, J.; Ni, J.; Zhou, L. K.; Duan, X.; Qiao, J. Q.; J. Altern. Complem. Med.2007, 12, 171.
3. Jin, X. H.; Ohgami, K.; Shiratori, K.; Suzuki, Y.; Koyama, Y.; Yoshida, K.; Ilieva, I.; Tanaka, T.; Onoe, K.; Ohno, S.; Exp. Eye Res. 2006, 82, 860.
4. Haban, M.; Habanova, M.; Otepka, P.; Lukac, N.; Massanyi, P.; J. Environ. Sci. Health, Part B2008, 43, 533.
5. Kara, D.; Food Chem. 2009, 114, 347.
6. Novotnik, B.; Zuliani, T.; Ščančar, J.; J. Trace Elem. Med. Biol. 2015, 31, 98.
7. Pytlakowska, K.; Kita, A.; Janoska, P.; Połowniak, M.; Kozik, V.; Food Chem. 2012, 135, 494.
8. Zhe, H.; Li, Y.; Li, H.; Wei, B.; Liao, X.; Tao, L.; Yu, J.;
Chemosphere 2015, 128, 161.
9. Li, X.; Chen, Z.; Chen, Z.; Zhang, Y.; J. Huanjing Sci. 2013, 93, 1240.
10. Drivelos, S. A.; Higgins, K.; Kalivas, J. H.; Food Chem. 2014, 165, 316.
11. Farmaki, E. G.; Thomaidis, N. S.; Minioti, K. S.; Anal. Lett. 2012, 45, 920.
12. Guo, Y.; Zhang, S.; Lai, L.; Wang, G.; J. Food Compos. Anal. 2015, 44, 122.
13. Li, L.; Environ. Chem. 2007, 26, 555.
14. Ma, G.; Zhang, Y.; Zhang, J.; Wang, G.; Chen, L.; Zhang, M.; Liu, T.; Liu, X.; Lu, C.; Food Control 2016, 59, 714.
15. GB 2762-2005; Maximum Limits for Pollutants in Food; Ministry of Health of the People’s Republic of China, 2005. 16. Zhu, H.; Wang, J.; Chen, R.; Med. Prot 2000, 5, 33.
17. Zhou, R.; Liu, L. P.; Yue, B.; Li, X. W.; Zhao, Y. F.; Wu, Y. N.;
Mod. Prev. Med. 2014, 41, 1975.
18. Ni, Z.; Yu, Q.; Liu, Y.; Tang, F.; Anal. Lett. 2016, 49, 2312.
19. Peng, C. Y.; Da, X. L.; J. Food Safety Qual. 2015, 23, 1199. 20. Mleczek, M.; Niedzielski, P.; Kalač, P.; Siwulski, M.; Rzymski,
P.; Gąsecka, M.; Food Addit. Contam., Part A 2016, 33, 86. 21. Jiang, D. G.; Yang, J.; Zhang, S.; Yang, D. J.; 2012, 25, 267.
22. Spalla, S.; Baffi, C.; Barbante, C.; Turretta, C.; Cozzi, G.; Beone, G. M.; Bettinelli, M.; Rapid Commun. Mass Spectrom. 2009, 23, 3285.
23. Hu, S.; Xue, J.; Lin, Y.; Yu, J.; Zhou, J.; Anal. Lett. 2014, 47,
1400.
24. Pourret, O.; Davranche, M.; Gruau, G.; Dia, A.; Chem. Geol. 2007, 243, 128.
25. Cao, X.; Ying, C.; Wang, X.; Deng, X.; Chemosphere 2001, 44,
655.
Submitted: December 15, 2016
Published online: February 23, 2017 Table 5. Estimated daily intake (EDI) of rare element oxides (REOs) and percentage of dietary reference intake (DRI)
Type of flower herb tea EDI / (µg day
–1 person–1) Percentage of DRI
Average Max Average Max
Rose 0.45 0.77 0.01 0.02
Roselle 1.3 1.84 0.03 0.04
Carnation 0.53 0.90 0.01 0.02
Jasmine 0.57 0.83 0.01 0.02
Lily 2.07 2.51 0.05 0.06
Calendula officinalis 1.11 1.60 0.03 0.04
Honeysuckle 0.78 1.48 0.02 0.04
Tribute chrysanthemum 1.45 1.16 0.03 0.03
Coreopsis tinctoria 2.03 5.67 0.05 0.14
Globe amaranth 0.55 0.44 0.01 0.01
Chamomile 0.62 0.73 0.01 0.02