Article
*e-mail: [email protected]
A Green Analytical Procedure for Determination of Copper and Iron in Plant
Materials after Cloud Point Extraction
Sidnei G. Silva, Pedro V. Oliveira and Fábio R. P. Rocha*
Instituto de Química, Universidade de São Paulo, Av. Prof. Lineu Prestes 748, 05513-970 São Paulo-SP, Brazil
Um procedimento analítico limpo baseado em extração em ponto nuvem é descrito para a determinação de cobre e ferro em materiais vegetais. Após a digestão da amostra em frascos fechados em forno de microondas, empregando mistura oxidante diluída (HNO3 + H2O2), os íons metálicos foram simultaneamente extraídos como complexos hidrofóbicos formados com 1,2-tiazolilazo-2-naftol (TAN) usando Triton X-114 como agente extrator. Íons cobre e ferro foram determinados por espectrometria de absorção atômica com chama (FAAS) e ferro também por espectrofotometria de absorção molecular UV-Vis. Nas medidas por FAAS, os limites de detecção (99,7% de coniança) foram estimados em 1 e 10 µg L-1 para cobre e ferro, respectivamente. Respostas lineares para ambos os analitos foram observadas no intervalo de 25-200 µg L-1. O fator de enriquecimento foi estimado em 30, com extração quantitativa dos complexos avaliada por medidas na solução sobrenadante remanescente após extração. Para a determinação de ferro por espectrofotometria UV-Vis, o limite de detecção (99,7% de coniança) foi estimado em 1 µg L-1, com resposta linear entre 6 e 60 µg L-1. A exatidão do procedimento foi avaliada pela determinação dos metais em materiais de referência certiicados e os resultados foram concordantes com os valores certiicados no nível de coniança de 95%. O consumo de reagentes foi de 1 mL HNO3, 1,1 mL H2O2, 50 mg Triton X-114 e 150 µg TAN por determinação.
A green analytical procedure exploiting cloud point extraction for determination of copper and iron in plant materials is presented. After sample digestion with a diluted oxidant mixture (HNO3 + H2O2) in a closed vessel microwave oven, metal ions were simultaneously extracted as hydrophobic complexes formed with 1,2-tiazolylazo-2-naphthol (TAN) using Triton X-114 as extracting agent. Copper and iron were determined by lame atomic absorption spectrometry (FAAS) and iron also by UV-Vis spectrophotometry. For FAAS, the detection limits (99.7% conidence level) were estimated as 1 and 10 µg L-1 for copper and iron, respectively. Linear responses for both analytes were observed in the 25-200 µg L-1 range. The enrichment factors were estimated as 30 for both analytes and the extraction was quantitative, as evaluated by measurements in the supernatant solution remaining after extraction. For iron determination by UV-Vis spectrophotometry, the detection limit was estimated as 1 µg L-1, with linear response within 6 and 60 µg L-1. The accuracy of the procedure was evaluated by determination of the metals in certiied reference materials and the results agreed with the certiied values at the 95% conidence level. In the whole procedure, the reagent consumption was 1 mL HNO3, 1.1 mL H2O2, 50 mg Triton X-114 and 150 µg TAN
per determination.
Keywords: green analytical chemistry, cloud point extraction, FAAS, spectrophotometry, plant materials, copper, iron
Introduction
Copper and iron are important for plant nutrition, being classified as essential micronutrients and usually found in very low concentrations (2-50 and
20-600 µg g-1, respectively). Iron and copper are essential for chlorophyll synthesis and copper is present in diverse enzymes, acting in the metabolism of carbohydrates. On the other hand, high concentrations of these species may be toxic to plants.1 In view of these aspects, a large
out from sample solutions obtained by time-consuming digestion procedures which consume large amounts of concentrated inorganic acids.2 Depending on the
analytical technique employed for analysis, extraction and preconcentration can be required in view of the low analyte concentrations and the need for elimination of matrix effects and interfering species. Several procedures have been reported with this aim, including precipitation, liquid-liquid and solid-liquid extraction,3 which often
generates large amounts of wastes. Alternative strategies, based on cloud point extraction, have been applied for separation and preconcentration of trace metals aiming determination in different sample matrices.4-6
The analytes are extracted into micelles after reaction with a hydrophobic complexing agent in the presence of a surfactant above the critical micelle concentration (CMC).7,8 In the process, aqueous solutions of non-ionic
surfactants become turbid upon appropriate alteration of the physical-chemical conditions, usually by heating or introduction of suitable additives. The process results in a two-phase system: a surfactant-rich phase, which contains most of the surfactant and the extracted hydrophobic species and a phase containing a small amount of the surfactant, close to the critical micelle concentration.9
This approach presents several advantages in relation to conventional liquid-liquid extraction with organic solvents. The procedures are simpler and inexpensive, yielding high enrichment factors in a single extraction, because complexation and micelle formation occur in a single phase. In addition, cloud point extraction shows environmentally friendly characteristics by the substitution of toxic solvents6,10 by reduced amounts of
low toxicity surfactants, in agreement with the green chemistry principles.11,12
Closed-vessel microwave-assisted acid digestion has been extensively used for sample preparation, including plant materials,13,14 replacing with advantages the acid
digestion based on convective heating. Nitric acid is frequently employed for digestion of organic samples due to its safe manipulation, facility of puriication and oxidative characteristics.15-17 Typically, 2-5 mL of nitric
acid is suficient for digestion of 200 mg of sample,18,19
and H2O2 is generally used as an auxiliary oxidant agent.20
Excellent results also have been obtained by using diluted acids,2,13,14 yielding greener procedures by drastic reduction
of the wastes for large scale analysis.
The aim of this work was the development of a green analytical procedure for determination of copper and iron in plant materials, exploiting microwave-assisted digestion with a diluted oxidant mixture and cloud point extraction with minimum reagent consumption.
Experimental
Apparatus
An AAS vario 6 atomic absorption spectrometer (Analytikjena, Jena, Germany) equipped with a deuterium lamp for background correction and hollow-cathode lamps as radiation sources was used for copper and iron absorbance measurements at 324.8 and 248.3 nm, respectively. The instrumental parameters were adjusted according to the manufacturer’s recommendations. An UV-Vis spectrophotometer (U-300, Hitachi, Tokyo, Japan) equipped with reduced volume plastic cells (10 mm optical path) was employed for spectrophotometric measurements. Acid decomposition was carried out in closed perluoroalcoxy (PFA) vessels by using a microwave oven (Multiwave 3000, Anton Paar, Graz, Austria). A centrifuge (Q222T, Quimis, São Paulo, Brazil) was used to accelerate the phase separation in the cloud point extraction procedure.
A sliding-bar injector-commutator designed for low injection analysis21 was employed to insert discrete volumes
of the extracts in the FAAS nebulizer. A micropipette tip was connected in the position of the sample loop aiming microsample volume introduction. When the injector was moved to the injection position, the sample was aspirated to the nebulization chamber, yielding a transient signal. Measurements were based on peak height and carried out in triplicate.
Reagents and solutions
All solutions were prepared with analytical grade chemicals and deionized water. A 2.0 x 10⁻³ mol L-1 TAN
stock solution was prepared by dissolving appropriate amounts of 1,2-tiazolylazo-2-naphthol (Across Organics, Pittsburgh, PA, USA) in ethanol. Solutions of the nonionic surfactant Triton X-114 (Sigma, St. Louis, MO, USA) were prepared at the 5% (m/v) concentration. Buffer solutions were prepared from acetic acid and sodium acetate or from hexamine and hydrochloric acid. Reference solutions were prepared by suitable dilutions of stocks 1000 mg L-1
solutions (Merck, Darmstadt, Germany).
Microwave-assisted acid digestion procedure
Crotalaria juncea, a plant often used as green manure,
(180 ºC/4 min)/hold (5 min); 3-ramp (220 ºC/4 min)/hold (10 min); 4-cooling to 25 ºC (20 min).
Cloud point extraction procedure
The procedure was carried out in four steps: (i) 450 µL
of 2.0 x 10⁻³ mol L-1 TAN, 1 mL of 5% (m/v) Triton X-114,
1 mL of acetate buffer 1 mol L-1 (pH 4.8) and 1 mL ascorbic
acid 1% (m/v) were transferred to 15 mL graduate tubes containing suitable amounts of the sample or the reference solution, making up the volume to the mark with water; (ii)
Phase separation was induced by heating the tubes in a water bath at 60 ºC for 15 min. The mixture was then centrifuged for 20 min at 3000 rpm (centrifugal force estimated as 700 x g) and the aqueous phase was removed with a Pasteur pipette; (iii) The surfactant-rich phase showed a volume of ca. 300 µL and was diluted with ethanol to 500 µL by using
the graduation in the lask, in order to decrease its viscosity, making feasible the transference to the measurement system; (iv) Measurements by UV-Vis spectrophotometry
or by lame atomic absorption spectrophotometry were carried out. Aiming the determination of both analytes by FAAS in a single extract, 150 µL of the extract were inserted in the FAAS nebulizer by the procedure previously described. The UV-Vis spectrophotometric measurement can be carried out with ca. 300 µL of the extract by using
the reduced volume cell.
For the analysis of plant materials, the acid digests were neutralized with 2.2 mL of NaOH (5 mol L-1) before
addition of the buffer solution.
Results and Discussion
General aspects
The chromogenic reagent 1,2-tiazolylazo-2-naphthol (TAN) has been mainly employed for liquid-liquid or solid-liquid extraction, yielding good selectivity and sensitivity in spectrometric determination of several metal ions. In view of its hydrophobic characteristics and reactivity with Cu(II) and Fe(II) ions, this reagent was selected for the cloud point extraction procedure.22-24
Triton X-114 (CMC = 3.5 x 10⁻⁴ mol L-1) was used as
extracting agent in view of the highly convenient cloud point formation, in the 23-25 ºC range.9 The absorption
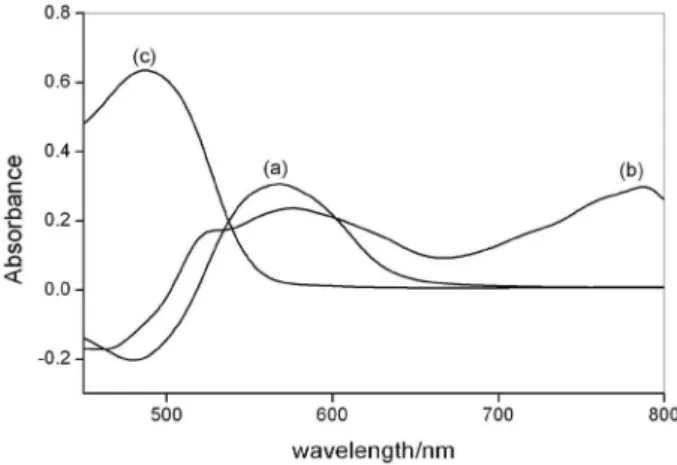
spectra of Cu(II) and Fe(II) complexes with TAN are shown in Figure 1. Both complexes have absorption maxima in the same spectral region, around 570 nm, but iron complex shows also an absorption maximum at 787 nm. In this wavelength, iron determination without spectral interference of other metal ions is possible.
The effect of sample volume was evaluated by inserting discrete volumes in the FAAS nebulizer and the results were compared with those obtained by direct sample aspiration. Transient signals were obtained for discrete volumes and the peak heights were proportional to the metal ion amount. For a 150 µL sample volume, the analytical signal achieved 82% of the steady state obtained by direct aspiration of the sample and the coeficient of variation was estimated as 1.2% (n = 10). This sample volume was then selected for further studies, which permits the determination of both analytes in the same extract.
Optimization of the extraction procedure
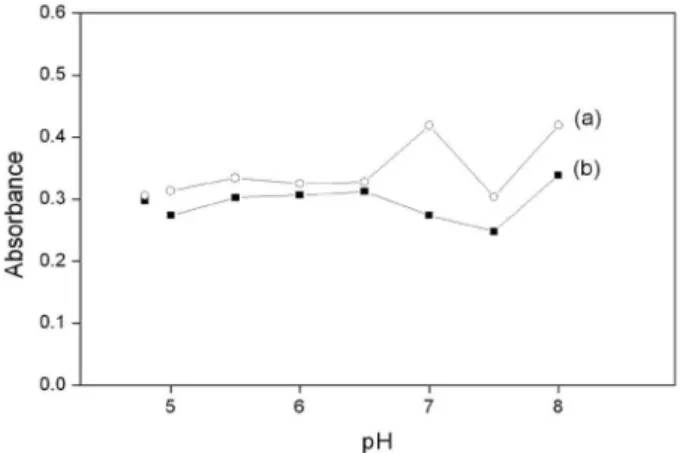
Optimization of the variables related to the extraction of the analytes was monitored by spectrophotometry, in order to maximize the extraction eficiency with minimum reagent consumption. The cloud point extraction of inorganic species is only slightly dependent of the pH, but this variable critically affects complexation with TAN and thus the formation of hydrophobic species. Figure 2 shows the pH effect evaluated with hexamine buffer solutions and, for comparison, results obtained with an acetate buffer solution at pH 4.8. The absorbance did not vary signiicantly up to pH 6.5 for both analytes, being close to those obtained in the acetate buffer medium. In this way, acetate buffer (pH = 4.8) was used in subsequent studies in order to minimize waste toxicity. The buffer concentration was maintained at minimum (0.07 mol L-1) in order to hinder
the formation of acetate complexes with Cu(II) and Fe(III) (Kf = 4 x 10² and 5 x 10⁹, respectively)25 and also to reduce
reagent consumption.
The effect of TAN concentration was evaluated for each analyte separately, aiming to establish the minimum reagent
Figure 1. Absorption spectra of TAN complexes with (a) Cu(II) and
concentration to yield maximum sensitivity. According to the results presented in Figure 3, 6.0 x 10⁻⁵ mol L-1 TAN
sufice to attain these goals. In these conditions, 150 µg of TAN were consumed per determination, yielding in
at least 16-fold molar excess in relation to the analytes. Measurements carried out by FAAS also indicated that concentrations higher than 6.0 x 10⁻⁵ mol L-1 did not affect
the analytical signal signiicantly.
In cloud point extraction procedures, the increase in surfactant concentration can decrease the analytical signal because of the increment in the surfactant-rich phase volume and the consequent dilution of the extract. However, this aspect was not relevant in the proposed procedure because the final volume was adjusted to 500 µL before measurements. On the other hand, low surfactant concentrations can affect the extraction eficiency and thus the sensitivity, precision and accuracy of the
procedure. Figure 4 shows the inluence of Triton X-114 concentration in the extraction eficiency, monitored by UV-Vis spectrophotometry. Quantitative extraction of both analytes was observed for concentrations higher than 6 × 10⁻³ mol L-1, which is at least 17-fold higher than the
CMC.10 Results agreed with those obtained by FAAS and
this concentration was ixed for further studies.
Microwave-assisted acid digestion
Procedures for digestion of plant materials usually consume relatively large amounts of inorganic acids and hydrogen peroxide, and sometimes sample mass higher than 200 mg, even when closed-vessel microwave-assisted digestion is employed.2 Aiming minimizing waste
generation also in the sample digestion, the concentrations of nitric acid and hydrogen peroxide in the microwave-assisted digestion procedure were optimized utilizing 250 mg of Crotalaria juncea, and maintaining the inal
volume of 6.0 mL adjusted with water. When the acid volume was lower than 400 µL, the Crotalaria extracts presented solid residues and yellow color, indicating incomplete sample decomposition. Solid residues were avoided by increasing the acid amount and clear solutions were obtained by addition of H2O2. For Crotalaria samples,
best results were obtained by using 500 µL of 14 mol L-1 HNO3 and 1.1 mL of 30% (m/m) H2O2 for a sample mass of 250 mg. For a similar sample, the procedure proposed by Wu et al.26 consumes 500 mg of sample, 5 mL of 14 mol L-1
HNO3 and 2 mL of H2O2 (30% m/m) per determination.
After sample digestion, the remaining excess of acid was neutralized with a NaOH solution and the pH was further adjusted with an acetate buffer solution (pH = 4.8) for cloud point extraction.
Figure 2. Effect of pH on the analytical signals, employing hexamine
buffers (0.05 mol L-1) in pH ranging from 5.0 to 8.0 and acetate buffer (0.05 mol L-1), pH = 4.8. TAN complexes formed with (a) Cu(II) and (b) Fe(II). Other experimental conditions as described in Figure 1.
Figure 3. Effect of TAN concentration on the analytical signal of (a)
Cu(II) and (b) Fe(II). Experimental conditions as described in Figure 1 with pH = 4.8 adjusted with acetate buffer.
Figure 4. Effect of Triton X-114 concentration on the analytical signal
Effect of concomitant species
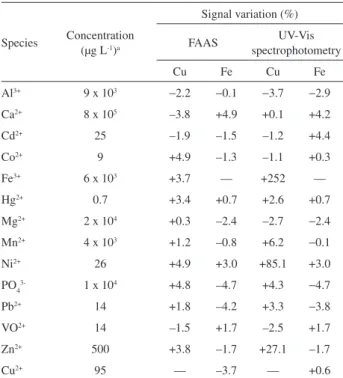
The effects of concomitant species on the determination of 25 µg L-1 Cu(II) or 100 µg L-1 Fe(III) were studied by
measurements using both UV-Vis spectrophotometry and FAAS. It was considered interference when species caused variations higher than ± 5% in the analytical signal. The evaluated concentrations of the concomitants were based on the maxima concentration in some certiied reference materials: Apple leaves SRM 1515, Peach leaves SRM 1547, Tomato leaves SRM 1573a (from NIST) and Citrus leaves 1572 (from NBS). The results of the interference studies are shown in Table 1.
TAN forms stable complexes with various metal ions and copper determination by UV-Vis spectrophotometry was not possible due to spectral interferences. Several TAN complexes formed with species present in digests of plant materials, such as Fe(II), Zn(II) and Mn(II), absorb in the same spectral region of the Cu(II) complexes.24
The main interference was observed in the presence of Fe(III), which caused a positive error of 252% on copper determination. The effect of several masking agents, such as EDTA, luorite and phosphate, was evaluated but it was not possible to eliminate the interferences due to the high formation constant of the corresponding TAN complexes.
The concomitant species did not present significant interferences on iron determination by spectrophotometric measurements at 787 nm. In view of the inherently high selectivity provided by FAAS, signiicant interferences may be attributed only to the preconcentration step, because cations that react with TAN may decrease the extraction eficiency of the analytes. However, for all the species evaluated the signal variation was lower than 5% (Table 1).
Analytical features and application
Calibration curves were obtained by preconcentration of 15 mL of reference solutions under the optimized conditions for cloud point extraction. The detection limits (99.7% conidence level) estimated by FAAS according to IUPAC recommendations27 were 1 µg L-1 copper and
10 µg L-1 iron, with linear responses in the 25-200 µg L-1
range. The calibration curves can be described by the equations: A = 0.0028C (µg L-1) + 0.0150 (r = 0.999) for copper and A = 0.0051C (µg L-1) + 0.0644 (r = 0.996) for iron. The enrichment factors were estimated as 30, in agreement with the theoretical value, indicating quantitative extraction. This was conirmed by measurements in the supernatant solution after extraction. For iron determination by UV-Vis spectrophotometry, the detection limit was estimated as 1 µg L-1 (99.7% confidence level), with linear response in the 6-60 µg L-1 range. The apparent molar absorptivity was estimated as 3.0 x 10⁵ L mol-1 cm-1
(at 787 nm), which is 17-fold higher than the achieved in the spectrophotometric procedure proposed by Ferreira and Nano.24 The reagent consumption was estimated as
50 mg Triton X-114 and 150 µg TAN per determination. For comparison, an analytical procedure involving solvent extraction consumed 10 mL of benzene per determination.28
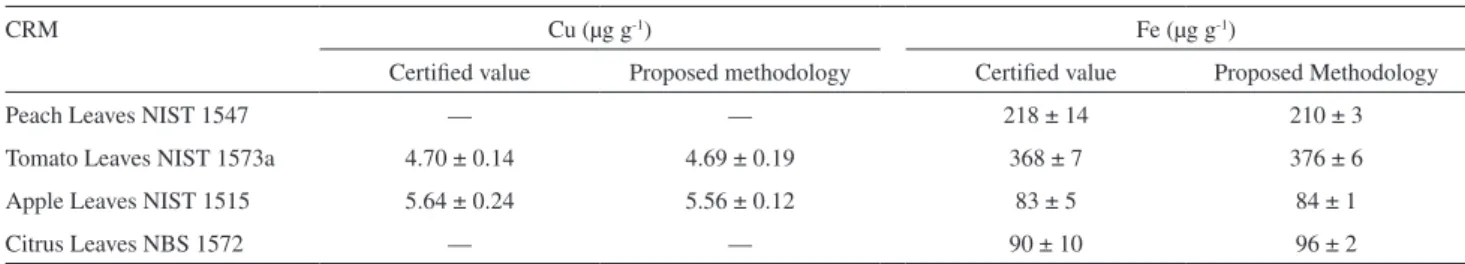
The reliability of the developed procedure was evaluated through the analysis of plant certiied reference materials. The results obtained by UV-Vis spectrophotometry and FAAS are depicted in Tables 2 and 3, respectively. All results were in agreement with certiied values at the 95% conidence level.
Table 1. Effect of concomitant species on the determination of 25 µg L-1
copper and 100 µg L-1 iron after cloud point extraction
Species Concentration (µg L-1)a
Signal variation (%)
FAAS spectrophotometryUV-Vis
Cu Fe Cu Fe
Al3+ 9 x 10³ −2.2 −0.1 −3.7 −2.9
Ca2+ 8 x 10⁵ –3.8 +4.9 +0.1 +4.2
Cd2+ 25 –1.9 –1.5 –1.2 +4.4
Co2+ 9 +4.9 –1.3 –1.1 +0.3
Fe3+ 6 x 10³ +3.7 — +252 —
Hg2+ 0.7 +3.4 +0.7 +2.6 +0.7
Mg2+ 2 x 10⁴ +0.3 –2.4 –2.7 −2.4
Mn2+ 4 x 10³ +1.2 –0.8 +6.2 −0.1
Ni2+ 26 +4.9 +3.0 +85.1 +3.0
PO43- 1 x 10⁴ +4.8 –4.7 +4.3 −4.7
Pb2+ 14 +1.8 –4.2 +3.3
−3.8
VO2+ 14 –1.5 +1.7 –2.5 +1.7
Zn2+ 500 +3.8 –1.7 +27.1 –1.7
Cu2+ 95 — –3.7 — +0.6
aestablished by the maximum concentration found in digests of plant certiied reference materials.
Table 2. Determination of Fe in certiied reference materials (CRM) by
UV-Vis spectrophotometry after cloud point extraction
CRM Fe (µg g-1)
Certiied value Proposed Method
Peach Leaves NIST 1547 218 ± 14 209 ± 21 Tomato Leaves NIST 1573a 368 ± 7 356 ± 6
Apple Leaves NIST 1515 83 ± 5 81 ± 1
Conclusions
An accurate and precise green analytical procedure was developed for copper and iron determination in plant materials, based on digestion with a diluted oxidant mixture and cloud point extraction. Minimization of reagent consumption for sample pretreatment and the extraction with surfactant reduced signiicantly the waste generation and toxicity. Copper determination by UV-Vis spectrophotometry was not feasible in view of spectral interferences caused by metal ions present in the sample matrix that form complexes with TAN, mainly Fe(III). However, spectrophotometric determination of iron can be carried out without interferences because the iron complex present an absorption maxima in a spectral region in which the others complexes did not absorb radiation. Copper and iron were properly determined by FAAS using small sample aliquots (150 µL) for nebulization, achieving 82% of the steady state signal.
Acknowledgements
The authors acknowledge the fellowships and inancial support from Conselho Nacional de Desenvolvimento Cientíico e Tecnológico (CNPq) and Fundação de Amparo à Pesquisa do Estado de São Paulo (FAPESP).
References
1. Epstein, E.; Bloom, A. J.; Mineral Nutrition of Plants: Principles and Perspectives; 2nd ed., Sinauer Associates: California, 2005. 2. Maruchi, A. K.; Rocha, F. R. P.; Microchem. J.2006,82, 207. 3. Rocha, F. R. P.; Teixeira, L. S. G.; Quim. Nova2004,27, 807. 4. Ghaedi, M.; Fathi, M.R.; Shokrollahi, A.; Gharaghani, S.;
Ahmadi, F.; Soylak, M.; Quim. Nova 2008, 31, 70. 5. Candir, S.; Narin, I.; Soylak, M.; Talanta 2008, 77, 289. 6. Bezerra, M. D.; Arruda, M. A. Z.; Ferreira, S. L. C.; J. Appl.
Spectrosc.2005, 40, 269.
7. Quina, F. H.; Hinze, W. L.; Ind. Eng. Chem. Res.1999,38, 4150.
8. Silva, M. F.; Cerutti, E. S.; Martinez, L. D.; Microchim. Acta
2006, 155, 349.
9. Paleologos, E. K.; Stalikas, C. D.; Tzouwara-Karayanni, S. M.; Karayannis, M. I.; Anal. Chim. Acta2001, 436, 49.
10. Hinze, W. L.; Pramauro, E.; Crit. Rev. Anal. Chem.1993, 24, 133. 11. Anastas, P. T.; Kirchhoff, M. M.; Acc. Chem. Res.2002, 35,
686.
12. Rocha, F. R. P.; Nóbrega J. A.; Fatibello-Filho, O.; Green Chem.
2001, 3, 216.
13. Esslemont, G.; Maher, W.; Ford, P; Krikowa, F.; At. Spectrosc.
2000, 21, 42.
14. Araújo, G. C. L.; Gonzalez, M. H.; Ferreira, A. G.; Nogueira, A. R. A.; Nóbrega, J.A; Spectrochim. Acta, Part B 2002, 57, 2121.
15. Würfels, M.; Jackwerth, E.; Fresenius J. Anal. Chem.1985,
322, 345.
16. Würfels, M.; Jackwerth, E.; Stoeppler, M.; Fresenius J. Anal. Chem.1987, 329, 459.
17. Kubrakova, I. V.; Formanovskii, A. A.; Kudinova, T. F.; Kuz’min, N. M.; J.Anal. Chem.1999, 54, 460.
18. Koltz, L.; Henze, G.; Kaiser, G.; Pahlke, S.; Veber, M.; Tölg, G.; Talanta1979, 26, 681.
19. Stoeppler, M.; Müller, K.P.; Backhaus, F.; J. Anal. Chem.1979,
276, 107.
20. Wu, S. L.; Feng, X. B.; Wittmeier, A.; J. Anal. At. Spectrom.
1997, 12, 797.
21. Bergamin-Filho, H.; Medeiros, J. X.; Reis, B. F.; Zagatto, E. A. G.; Anal. Chim. Acta1978, 101, 9.
22. Lemos, V. A.; Santos, E. S.; Santos, M. S.; Yamaki, R. T.; Microchim. Acta2007, 158, 189.
23. Anderson, R. G.; Nickless, G.; Analyst1967, 92, 1093. 24. Ferreira, S. L. C.; Nano, R. M. W.; Talanta1994, 41, 1937. 25. Harris, D. C.; Quantitative Chemical Analysis, 7th ed., W.H.
Freeman and Co: New York, 2007.
26. Wu, S.; Feng, X.; Wittmeier, A.; J. Anal. At. Spectrom.1997,
12, 797.
27. http://www.iupac.org/goldbook/L03540.pdf, accessed in December 2008.
28. Otomo, M.; Watanabe, T.; Moriya, M.; Anal. Sci.1986,2, 549.
Received: March 12, 2009
Web Release Date: November 12, 2009
FAPESP helped in meeting the publication costs of this article.
Table 3. Determination of Cu and Fe in certiied reference materials (CRM) by FAAS after cloud point extraction
CRM Cu (µg g-1) Fe (µg g-1)
Certiied value Proposed methodology Certiied value Proposed Methodology
Peach Leaves NIST 1547 — — 218 ± 14 210 ± 3
Tomato Leaves NIST 1573a 4.70 ± 0.14 4.69 ± 0.19 368 ± 7 376 ± 6
Apple Leaves NIST 1515 5.64 ± 0.24 5.56 ± 0.12 83 ± 5 84 ± 1