http://dx.doi.org/10.1590/bjpt-rbf.2014.0157
258 Braz J Phys Ther. 2016 May-June; 20(3):258-266
Spatiotemporal and variability gait data in
community‑dwelling elderly women from Brazil
Renata N. Kirkwood1, Henrique A. Gomes1, Rosana F. Sampaio1,
Sheyla R. C. Furtado1, Bruno S. Moreira1
ABSTRACT | Background: Gait is an extremely complex motor task; therefore, gait data should encompass as many gait parameters as possible. Objective: To provide reference values for gait measurements obtained from a Brazilian group of community-dwelling elderly females between the ages of 65 and 89 years and to apply the PCA-biplot to yield insight into different walking strategies that might occur during the aging process. Method: 305 elderly community-dwelling females living in Brazil were stratiied into four age groups: 65-69 years (N=103); 70-74 years (N=95); 75-79 years (N=77); and ≥80 years (N=30). Age, height, and BMI were assessed to describe the characteristics of the groups. Gait spatiotemporal and variability data were obtained using the GAITRite system. Principal component analysis, followed by MANOVA and the PCA-biplot approach were used to analyze the data. Results: 95% CI showed that only three components – rhythm,
variability, and support - together explained 74.2% of the total variance in gait that were different among the groups. The older groups (75-79 and ≥80 years) walked with lower than average velocity, cadence, and step length and were above average for the variables stance, step, swing, and double support time and the ≥80 year old group presented the highest gait variability compared to the other groups. Conclusion: Aging is associated with decreased gait velocity and cadence and increased stance, step time, and variability, but not associated with changes in base of support. In addition, the PCA-biplot indicates a decline towards decreased rhythm and increased variability with aging.
Keywords: gait; elderly; principal component analysis; biplot; variability; physical therapy.
BULLET POINTS
• This study provides extended gait parameters for Brazilian elderly women.
• The components (rhythm, variability, and support) were different among age groups. • Aging is associated with decreased gait rhythm and increased gait variability. • Aging is not related to changes in base of support.
HOW TO CITE THIS ARTICLE
Kirkwood RN, Gomes HA, Sampaio RF, Furtado SRC, Moreira BS. Spatiotemporal and variability gait data in community-dwelling elderly women from Brazil. Braz J Phys Ther. 2016 May-June; 20(3):258-266 . http://dx.doi.org/10.1590/bjpt-rbf.2014.0157
1Programa de Pós-graduação em Ciências da Reabilitação, Universidade Federal de Minas Gerais (UFMG), Belo Horizonte, MG, Brazil Received: June 17, 2015 Revised: Sept. 28, 2015 Accepted: Nov. 26, 2015
Introduction
The normal aging process is associated with changes to the nervous, muscular, and skeletal systems that affect the ability of a person to walk eficiently1.
These changes, speciically in the elderly population, have been associated with greater immobility, risk of falls, dementia, and mortality2-5. One approach to
understanding gait dysfunction is to assess and compare the results with reference values6-9. Traditionally,
gait velocity is the elected variable used to assess gait due to the link of lower gait velocity to adverse outcomes in the elderly10,11. However, gait is an extremely complex motor task that can be expressed from parameters other than velocity such as cadence,
base of support, step length, swing, stance, and double support times. In addition, gait variability, deined as a luctuation in gait parameters during a stride, is an important indicator of impaired mobility in the elderly12,13. Most studies focus on gait velocity, neglecting the other gait parameters14,15, however gait should also be recognized in other facets. To our knowledge, there is a lack of gait studies conducted in community-dwelling older adults living in Brazil.
orthogonality of data is critical. One approach that has been successfully used in a large and correlated number of variables is Principal Component Analysis (PCA)17,18. PCA addresses these questions by reducing
data dimensionality and maximally preserving data variance, in addition to generating a small set of orthogonal new variables16. This new set of variables or components represents a weighted linear combination of the original variables, which holds clinical features that can be interpreted and compared between groups. Moreover, the structure of the components can be interpreted using the PCA-biplot approach, which is a graphic display that gives insight into relationships, trends, and clusters between the variables and groups in the study17,18.
Therefore, the purpose of this article was twofold: 1) to provide extended values for gait measurements obtained from a Brazilian group of community-dwelling elderly females aged 65 to 89 and 2) to apply the PCA-biplot analysis to yield insight into different walking strategies that might occur during the aging process.
Method
Participants
A convenience sample of 305 elderly women was recruited from the community and from two primary care units in the city of Belo Horizonte, MG, Brazil. The inclusion criteria were: females; age ≥65 years; and ability to walk independently without assistive devices. The exclusion criteria were as follows: cognitive impairment detectable by the Mini-Mental State Examination (MMSE)19; visual impairments
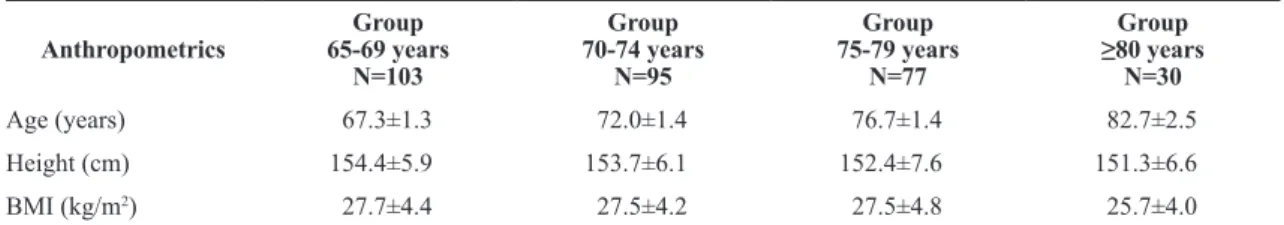
not corrected by lenses; musculoskeletal disorders (e.g. scoliosis); and motor sequel (e.g. stroke and Parkinson’s disease) that could affect gait. The sample was stratiied into four age groups: 65-69 years (N=103); 70-74 years (N=95); 75-79 years (N=77); and ≥80 years (N=30). Anthropometric data included height (cm), mass (kg), and body mass index (kg/m2).
All of the participants signed the informed consent form approved by the research ethics committee of the Municipal Health Department of Belo Horizonte, MG, Brazil (protocol number: 0081.1.410.000-09A).
Gait assessment
Spatiotemporal gait parameters and variability measures were collected at preferred walking speed using a 5.74 m computerized carpet (GAITRite,
CIR Systems Inc., Havertown, PA, USA) placed
on a well-illuminated hallway and free of noise and visual distractions. Participants wore their own closed, low-heel footwear and performed six walks (on average 4 to 5 steps long) beginning and stopping 2m before and after the carpet to allow for the acceleration and deceleration phases. Data was combined into a single test, sampled at 120 Hz, and processed using the system software including: velocity (cm/s), cadence (steps/min), step length (cm), base of support (cm), step time (s), swing time (s), stance time (s), and double support time (s) as deined by the GAITRite
manual. Coeficient of variation (CV = [standard deviation/mean] × 100) was used as a measure of gait variability for the following parameters: velocity (%CV), step length (%CV), base of support (%CV), step time (%CV), swing time (%CV), stance time (%CV), and double support time (%CV).
Data analysis
Anthropometric data were presented descriptively. PCA summarized the variation in a multi-correlated data (15 gait variables) to a set of uncorrelated components. The extracted uncorrelated principal components (PC) are equal to the number of variables and are estimated from eigenvectors of the covariance matrix of the original variables20. The PCs are the linear combination of the 15 standardized variables and are presented in decreased order of importance18,21. The lack of correlation between the PCs means that each PC measures a different feature of variance within the original data18. The relative weighting of the original variables in each component contributes to the clinical interpretation of each PC, and the sign indicates the nature of the correlation between the variable and the PC18,22,23. Variables with a contribution ≥0.30 were considered for the interpretation.
The analysis also gives a set of scores that represents the distance each individual is from the mean score of each component18,24,25. The resultant PC scores were standardized to z scores (mean of zero and standard deviation of 1) and 95% conidence intervals (CI) were generated to determine which PCs were different between the groups.
Next, MANOVA was conducted with the primary contributing variables (weight coeficient ≥0.30) of the signiicant components – indicated by the 95% CI – to determine which variables were different between the groups. A post hoc Bonferroni correction was conducted for multiple comparisons.
260 Braz J Phys Ther. 2016 May-June; 20(3):258-266
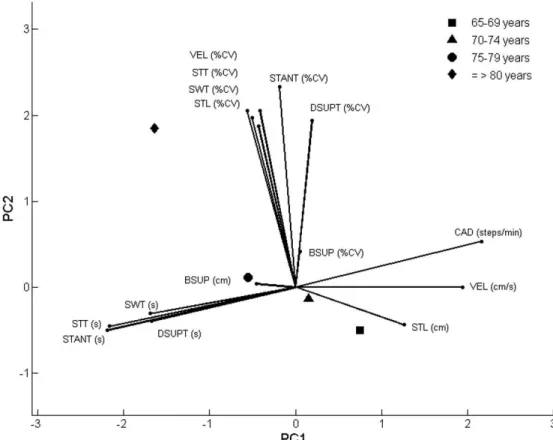
The PCA-biplot has its axes represented by the PC loadings, the average of the PC scores of each groups represented by symbols, and the variables represented by vectors scaled to have a unit length in the original dimensional space. Interpretation involves understanding how the groups are represented in this 2-PC model and what each PC means in terms of the original variables. The length of the variables’ vectors indicate its relative variance and the direction with respect to the axes indicates the PC to which each variable is most strongly related. When the projection of the observation (perpendicular line from the observation to the variable vector) falls in the direction of the variable, it means that the group has a higher than average value for that speciic variable; when it is in the opposite direction of the vector, the value is lower than average17. All tests were analysed using SPSS 22.0 (SPSS Inc., Chicago, IL, USA) and MatLab (R2011a) with a 0.05 signiicance level.
Results
The characteristics of the study groups are summarized in Table 1 and the reference values of the gait variables for the different age groups are shown in Table 2. PCA resulted in four components, with eigenvalues greater than 1, that explained 81.7% of the total variance (Table 3). PC1 explained 43.2% and was heavily loaded with the variables velocity and cadence going in a positive direction and stance and step time going in opposite directions. Therefore, this component was labelled ‘rhythm’ because changes in either pair of variables would affect the repeated pattern of the gait cycle. PC2 explained 19.1% and was loaded only with gait variability data, all going in the same positive direction (velocity, step time, stance time, and double support time); thus, the component was named ‘variability’. PC3, with 11.9% of variance explained, was labelled ‘support’ due to the weight contribution of the variables base of support and base of support variability going in opposite directions.
Therefore, an increase in base of support length decreases base of support variability, and the opposite is true. The last component PC4 explained 7.5% and was loaded with the variables double support time and variability and swing time; therefore this component was named phases. The 95% CI of the PCs showed that only three components – rhythm, variability, and support –were difference among the groups and together explained 74.2% of the total variance. Therefore, the remainder of the analysis was conducted only on the signiicant components.
Figure 1 shows the post hoc Bonferroni for multiple comparisons for the primary outcomes. There was a signiicant effect on groups for the primary outcomes of the components rhythm, variability, and support (F(10, 292) = 3.47, p<0.05). For the component rhythm (PC1), gait velocity was signiicantly greater in the 65-69 and 70-74 year old groups compared to the ≥80 year old group and in the 65-69 year old group compared to the 75-79 year old group. Cadence was signiicantly greater in the 65-69 year old group compared to the 75-79 and ≥80 year old groups. Stance time was signiicantly smaller in the 65-69 and 70-74 year old groups compared to the ≥80 year old group and in the 65-69 year old group compared to the 75-79 year old group. Similarly, step time was signiicantly smaller in the 65-69 and 70-74 year old groups compared to the ≥80 year old group and in the 65-69 year old group compared to the 75-79 year old group.
Post hoc comparisons for the component variability (PC2) showed that stance time, double support time, and step time variability were signiicantly smaller in the 65-69, 70-74, and 75-79 year old groups compared to the ≥80 year old group. The variability of gait velocity was signiicantly smaller in the 65-69, 70-74, and 75-79 year old groups compared to the ≥80 year old group and in the 65-69 year old group compared to the 75-79 year old group. The variables of the component support (PC3), i.e. base of support and base of support variability, showed no signiicant difference between groups.
Table 1. Anthropometric characteristics of the groups (N=305).
Anthropometrics
Group 65-69 years
N=103
Group 70-74 years
N=95
Group 75-79 years
N=77
Group
≥80 years
N=30
Figure 2 shows the PCA-biplot that displays PC1 on the x-axis and PC2 on the y-axis, with the average of the PC scores for each groups represented by symbols and the original variables shown by the vectors. The PCA-biplot clearly shows that gait spatiotemporal parameters were strongly related to PC1 and gait variability was strongly related to PC2. Base of support and base of support variability are poorly represented in PC1 and PC2, as expected. The proximity of the gait variables related to time showed a strong correlation among these variables as well as the proximity of the variability data. The longest variance is attributed to the variables cadence, step time, stance time, and stance time variability. The projection of the 65-69 year old group onto the variables shows that, on average, this group walked faster in relation to the other groups
with higher cadence, velocity, and step length and reduced stance, swing, step, and double support time. The 70-74 year old group walked faster than the two other older groups but slower than the 65-69 year old group. The projection of the 75-79 year old group onto the variables shows that this age group walked with lower-than-average velocity, cadence, and step length and above-average stance, step, swing, and double support times. The projection of the oldest group (≥80 years) onto the variables clearly shows that this group had the lowest gait velocity with the highest time spent in step, stance, swing and double support times.
In relation to the variability, it is also clear that the ≥80 year old group presented the highest gait variability compared to the other groups. The PCA-biplot also
Table 2. Reference values by group (Mean±SD and Range) of the gait parameters investigated in the study.
Gait Parameter
Group 65-69 years
N=103
Group 70-74 years
N=95
Group 75-79 years
N=77
Group
≥80 years
N=30
Velocity (cm/s)
Range 128.5±18.485.4-168.9 121.4±18.264.5-171.2 115.1±18.573.6-158.1 105.4±23.465.7-155.9 Cadence (steps/min)
Range 98.0-142.6119.6±9.1 118.4±10.092.1-148.0 115.5±10.094.0-137.9 113.0±11.887.6-134.2 Step Length (cm)
Range 48.5-77.763.1±6.2 42.0-72.261.4±6.3 0.44-73.259.6±6.7 39.0-71.955.5±7.8 Base of Support (cm)
Range 2.3-14.97.5±2.3 2.0-13.07.8±2.4 2.4-17.57.6±2.8 2.0-13.08.1±2.5 Step Time (s)
Range 0.50±0.040.42-0.61 0.51±0.040.41-0.65 0.52±0.050.44-0.64 0.54±0.060.45-0.69 Swing Time (s)
Range 0.42±0.040.35-0.51 0.41±0.030.52-0.52
0.40±0.05
0.34-0.51 0.42±0.040.36-0.58
Stance Time (s)
Range 0.60±0.050.48-0.74 0.61±0.060.49-0.85 0.63±0.060.53-0.81 0.65±0.080.52-0.80
Double of Support Time (s)
Range 0.20±0.040.07-0.31 0.21±0.040.14-0.40 0.22±0.050.16-0.38 0.22±0.050.12-0.35 Velocity (%CV)
Mean SD (cm/s) 3.9±1.34.9 4.4±1.85.3
4.7±1.8
5.3
6.0±3.7
6.0
Step Length (%CV)
Mean SD (cm) 3.1±1.42.0
3.3±1.2
2.0
4.0±1.7
2.3
4.6±2.2
2.5
Base of Support (%CV)
Mean SD (cm) 31.3±16.32.1 30.6±18.72.1 37.3±28.52.4 38.8±35.12.5
Step Time (%CV)
Mean SD (s) 2.9±0.90.01 3.2±1.10.02
3.2±1.1
0.02
4.5±2.4
0.02
Swing Time (%CV)
Mean SD (s) 3.4±1.10.01 3.7±1.30.02
3.8±1.1
0.02
5.0±2.0
0.02
Stance Time (%CV)
Mean SD (s) 3.1±1.50.02
3.3±1.3
0.02
3.5±1.6
0.02
4.6±2.4
0.03
Double Support Time (%CV)
Mean SD (s) 8.3±4.20.02
8.2±3.0
0.02
8.3±2.3
0.02
11.4±4.3
0.03
262 Braz J Phys Ther. 2016 May-June; 20(3):258-266
Table 3. Loading vectors showing the variables with highest contribution (≥0.30) to each principal component and the percentage of
total variation.
Variables with contribution ≥0.30 Loading Vectors
PC1* PC2* PC3* PC4
Rhythm
Velocity (cm/s) 0.33
Cadence (steps/min) 0.32
Stance Time (s) –0.33
Step Time (s) –0.33
Variability
Stance Time (%CV) 0.38
Double Support Time (%CV) 0.35
Velocity (%CV) 0.31
Step Time (%CV) 0.30
Support
Base of Support (%CV) 0.61
Base of Support (cm) –0.60
Phase
Double Support Time (%CV) 0.52
Swing Time (s) 0.42
Double Support Time (s) –0.51
Cumulative percentage of total variation (%) 43.2 62.3 74.2 81.7
*95% CI of the PC scores statistically signiicant between groups.
Figure 1. Comparison between groups (N=305) of the variables with greater contribution to the signiicant principal components.
shows that, with age, there is a tendency towards decreased gait velocity, increased time spent on stance and double support, and higher gait variability.
Discussion
This study conirms the deleterious effect of age on gait parameters in a group of community-dwelling elderly women living in Brazil. The PC analysis was able to identify three components – rhythm, variability, and support – that clearly show that, in these groups of elderly women, aging is associated with decreased gait velocity and cadence and increased stance, step time, and variability, but not associated with changes in base of support. In addition, the PCA-biplot indicates a decline towards decreased rhythm and increased variability with aging.
Of the 15 gait variables entered in the analysis, four variables – velocity, cadence, step time, and stance time – contributed heavily to PC1. This means that reduction was obtained and the component could be clinically interpreted. Aging was associated with decreased rhythm characterized by lower velocity
and cadence and increased step and stance time. The average velocity of the younger group (65-69) was 128.5 cm, which was 5.6% faster (difference of 7.1 cm/s) than the 70-74 year old group, 10.4% faster (difference of 13.4 cm/s) than the 75-79 year old group, and 18% faster (difference of 23.1 cm/s) than the eldest group (≥80 years). However, the differences between the 65-69 and the 70-74 year old groups (difference of 7.1 cm/s) and between the latter and the 75-79 year old group (difference of 6.3 cm/s) did not reach statistical signiicance. Signiicant changes for gait velocity reported by Brach et al.26, in a sample of community-dwelling older adults, were 4.15 cm/s for a small change and 10.38 cm/s for a substantial change. Therefore, the gait differences found in our study are substantial and deserve attention given that the adverse outcomes of decreased gait velocity with falls4,27 and fear of falling28 in the elderly10 have been well established. In addition, our data will help clinicians detect substantial gait velocity changes in older adults; thus, interventions aimed to improve gait velocity could be evaluated properly.
Figure 2. PCA-biplot and the average score of the groups (N=305). PC1=principal component 1; PC2=principal component 2; VEL=velocity;
264 Braz J Phys Ther. 2016 May-June; 20(3):258-266
The older age groups (75-79 and ≥80 years) decreased rhythm by increasing time spent in stance and in step that culminated in decreased cadence and velocity. The greatest difference was 8.3% (difference of 0.05 s) in stance time between the 65-69 and ≥80 year old groups, and the smallest, but also signiicant, was 4% (difference of 0.02 s) in step time between the 65-69 and the 75-79 year old groups. A greatest difference in cadence was 5.6% (difference of 6.6 steps/min), observed between the 65-64 and ≥80 year old groups. Interestingly, stance and step times and cadence were very similar between the groups 70-74 and 75-79 years, and the PCA-biplot also shows that these groups are closer to the average of the variables’ values – with further proximity of the 70-74 year old group – but on opposite sides of the biplot. We could speculate that, in the absence of any disease impairment, the greatest changes in gait are expected to occur between the ages of 70 and 74 or that would be the transitional age for gait abnormalities due to aging. By transitional, we speculate a decreased gait velocity and increased variability. Decreased gait rhythm has been associated with dementia and a decline in cognition in a cohort study conducted with individuals older than 70 years of age29. In our study, the MMSE was the only test used to screen the subjects for cognitive impairments and no criteria was used to detect signs of early dementia. Therefore, it is possible that our participants could have mild cognitive impairment. However, all of them were capable of understanding the instructions of the study. Nevertheless, a decrease in rhythm was observed with aging with signiicant differences between the groups, highlighting the importance of rhythm in the process of evaluating elderly individuals.
The average gait velocity observed in our study was higher than the studies that reported gait parameters in Brazilian community-dwelling elderly females. Ruggero et al.14 reported 111 cm/s (SD: 27 cm/s)
in a group of elderly women aged 65 to 92, and Novaes et al.15 reported 107 cm/s (SD: 17 cm/s) and
102 cm/s (SD: 10 cm/s) in a similar group between the ages of 60-69 and ≥70 years of age, respectively. The differences may be related to the measurement system used and the range of ages investigated. In our study, a computerized carpet with accepted validity30
and reliability31 was used to assess gait parameters, and in the previously mentioned studies, gait velocity was measured using a stopwatch, which could be a potential source of human error due to the uncertainty of determining the beginning and end of the cycle.
In addition, our groups were stratiied into 5-year ranges, with the exception of the ≥80 year old group. Therefore, our study provides extensive gait data over a wider range of ages – from 65 to 89 – and used a reliable measurement system.
Gait variability is considered a useful marker in predicting falls in elderly individuals4,13,32. The inding of a component loaded with gait variability parameters was expected and similar results have been described in the literature6,7,29. This means that after rhythm has been accounted for, the main source of variation in the data came from stance time, double support time, velocity, and step time variability, composing the component variability. The eldest group (≥80 years) presented the highest stance time, double support time, velocity, and step time variability compared to the other age groups. Callisaya et al.13 found a strong association between step time variability and older age in women (71.6±7.1 years), supporting our indings. The authors also pointed out that reduced gait velocity might be responsible for the increase in variability in gait parameters observed in elderly individuals13. This afirmation is also supported by our indings. The PCA-biplot clearly shows that the oldest groups (75-79 and ≥80 years) located on the extension of the velocity vector (negative side - lower-than-average velocity) are also the ones closer to and on the direction of the variability vectors (positive side - higher variability).
The component support was heavily loaded with the variables base of support and base of support variability, going in opposite directions. Thus, as base of support decreases, variability increases and the opposite is true. However, these variables failed to reach signiicance when compared between groups. The major difference in base of support was 8% (difference of 0.6 cm) found between the 65-69 and ≥80 year groups. In our experience, base of support is not a marker for differentiating older individuals17,28. Conversely, Brach et al.33 found that excessive step
width variability, either too much or too little, in a non-challenging situation and at near normal gait velocity could be an early indication of fall risk in highly mobile individuals. Therefore, further studies are necessary to explain the effect of aging on base of support and base of support variability.
In the present study, double support time, double support time variability, and swing time comprised the component ‘phases’, but showed no difference between groups. Most of the studies7,29 that identiied
analysis. One of the advantages of principal component analysis (PCA) over factor analysis is the amount of variance of the observed variables that is present in the components. While principal components explore a representation of the variance among the data, factor analysis seeks an eficient representation of the covariance among variables16. In factor analysis, the variance of a single variable is separated into common and error variances. The common variance is shared by other variables, but the error is unique to the particular variable. In PCA, the observed variables are summarized and the total variance makes no distinction between common and error variances34. Therefore, PCA accounts for the maximum variance present in the original variables with a minimum number of PCs. The principal components that account for large amounts of variance represent the majority of the variance of the data, and the principal components that account for a small amount of variance indicate random noise21. Since the experiments conducted were relatively error free, the error variance represents a small portion of the total variance; therefore, we believe that PCA is more appropriate for this type of study. Since most of the variance was accounted for and reduction was achieved within the irst three components (74.2%), the contribution of the fourth component (phases) was minimal and probably not relevant.
One of the limitations of the study was the inclusion of a greater age range of elderly individuals in the ≥80 year group, from 80 to 89 years of age. The decision was taken to avoid groups with a small sample size, but we understand that we missed the opportunity to understand even more the effects of aging on gait parameters. Another factor to be considered is that physical activity level was neglected in the present study. We also understand that, for a study on elderly women, the screening criteria should be expanded to avoid the effects of sensory, cognitive, and mental impairments on gait.
Conclusion
In conclusion, the present study provides extensive gait data on Brazilian community-dwelling elderly women between the ages of 65 and 89. Through a robust statistical analysis, the effects of aging on gait rhythm and variability were described, and the information will contribute to the assessment and treatment of elderly individuals.
References
1. McGibbon CA. Toward a better understanding of gait changes
with age and disablement: neuromuscular adaptation. Exerc Sport Sci Rev. 2003;31(2):102-8. http://dx.doi.
org/10.1097/00003677-200304000-00009. PMid:12715975. 2. MakiBE. Gait changes in older adults: predictors of falls
or indicators of fear? J Am Geriatr Soc. 1997;45(3):313 -20. http://dx.doi.org/10.1111/j.1532-5415.1997.tb00946.x.
PMid:9063277.
3. Verghese J, LeValley A, Hall CB, Katz MJ, Ambrose AF,
LiptonRB. Epidemiology of gait disorders in community-residing older adults. J Am Geriatr Soc. 2006;54(2):
255-61. http://dx.doi.org/10.1111/j.1532-5415.2005.00580.x.
PMid:16460376.
4. Verghese J, HoltzerR, LiptonRB, Wang C. Quantitative gait markers and incident fall risk in older adults. J Gerontol
A Biol Sci Med Sci. 2009;64(8):896-901. http://dx.doi.
org/10.1093/gerona/glp033. PMid:19349593.
5. StudenskiS, Perera S, Patel K, Rosano C, Faulkner K, Inzitari
M, et al. Gait speed and survival in older adults. JAMA.
2011;305(1):50-8. http://dx.doi.org/10.1001/jama.2010.1923.
PMid:21205966.
6. VerlindenVJ, van der Geest JN, Hoogendam YY, Hofman A, Breteler MM, IkramMA. Gait patterns in a community-dwelling population aged 50 years and older. Gait Posture.
2013;37(4):500-5. http://dx.doi.org/10.1016/j.gaitpost.2012.09.005.
PMid:23018028.
7. Hollman JH, McDade EM, Petersen RC. Normative spatiotemporal gait parameters in older adults. Gait Posture. 2011;34(1):111-8. http://dx.doi.org/10.1016/j.
gaitpost.2011.03.024. PMid:21531139.
8. Bohannon RW. Population reprsentaive gait speed and its determinants. J Geriatr Phys Ther. 2008;31(2):49-52.
http://dx.doi.org/10.1519/00139143-200831020-00002.
PMid:19856549.
9. Oh-ParkM, HoltzerR, Xue X, Verghese J. Conventional and robust quantitative gait norms in community-dwelling older adults. J Am Geriatr Soc. 2010;58(8):1512-8. http://dx.doi.
org/10.1111/j.1532-5415.2010.02962.x. PMid:20646103.
10. Abellan van Kan G, Rolland Y, Andrieu S, Bauer J, Beauchet
O, Bonnefoy M, et al. Gait speed at usual pace as a predictor of adverse outcomes in community-dwelling older people
an International Academy on Nutrition and Aging (IANA) Task Force.J Nutr Health Aging. 2009;13(10):881-9. http://
dx.doi.org/10.1007/s12603-009-0246-z. PMid:19924348.
11. Rosano C, StudenskiSA, Aizenstein HJ, Boudreau RM,
Longstreth WT Jr, Newman AB. Slower gait, slower information processing and smaller prefrontal area in older adults. Age Ageing. 2012;41(1):58-64. http://dx.doi.
org/10.1093/ageing/afr113. PMid:21965414.
12. Brach JS, Studenski S, Perera S, VanSwearingenJM,
Newman AB. Stance time and step width variability have unique contributing impairments in older persons. Gait Posture. 2008;27(3):431-9. http://dx.doi.org/10.1016/j.
gaitpost.2007.05.016. PMid:17632004.
13. Callisaya ML, Blizzard L, SchmidtMD, McGinleyJL, Srikanth
VK. Ageing and gait variability--a population-based study of older people. Age Ageing. 2010;39(2):191-7. http://dx.doi.
266 Braz J Phys Ther. 2016 May-June; 20(3):258-266
14. RuggeroCR, Bilton TL, Teixeira LF, RamosJL, Alouche
SR, DiasRC, et al. Gait speed correlates in a multiracial population of community-dwelling older adults living in
Brazil: a cross-sectional population-based study.BMC Public Health. 2013;13(1):182.
http://dx.doi.org/10.1186/1471-2458-13-182. PMid:23448191.
15. NovaesRD, MirandaAS, DouradoVZ. Usual gait speed
assessment in middle-aged and elderly Brazilian subjects. Rev Bras Fisioter.2011;15(2):117-22. http://dx.doi.org/10.1590/
S1413-35552011000200006. PMid:21789361.
16. Chau T. A review of analytical techniques for gait
data. Part 1: Fuzzy, statistical and fractal methods. Gait Posture. 2001;13(1):49-66.
http://dx.doi.org/10.1016/S0966-6362(00)00094-1. PMid:11166554.
17. MoreiraBS, SampaioRF, Kirkwood RN. Spatiotemporal gait parameters and recurrent falls in community-dwelling
elderly women: a prospective study. Braz J Phys Ther.
2015;19(1):61-9. http://dx.doi.org/10.1590/bjpt-rbf.2014.0067.
PMid:25714603.
18. Kirkwood RN, Brandon SC, MoreiraBS, Deluzio KJ. Searching
for stability as we age: the PCA-Biplot approach.Int J Stat Med Res. 2013;2(4):255-62.
19. Bertolucci PH, Brucki SM, Campacci SR, Juliano Y. The
Mini-Mental State Examination in a general population: impact
of educational status. Arq Neuropsiquiatr. 1994;52(1):1-7.
http://dx.doi.org/10.1590/S0004-282X1994000100001.
PMid:8002795.
20. Brandon SC, Deluzio KJ. Robust features of knee osteoarthritis
in joint moments are independent of reference frame
selection. Clin Biomech (Bristol, Avon). 2011;26(1):
65-70. http://dx.doi.org/10.1016/j.clinbiomech.2010.08.010.
PMid:20875695.
21. Deluzio KJ, Wyss UP, Zee B, Costigan PA, Serbie C. Principal
component models of knee kinematics and kinetics: normal
vs. pathological gait patterns. Hum Mov Sci. 1997;16( 2-3):201-17. http://dx.doi.org/10.1016/S0167-9457(96)00051-6. 22. Astephen JL, Deluzio KJ. Changes in frontal plane dynamics
and the loading response phase of the gait cycle are characteristic of severe knee osteoarthritis application of a multidimensional analysis technique. Clin Biomech
(Bristol, Avon). 2005;20(2):209-17. http://dx.doi.org/10.1016/j.
clinbiomech.2004.09.007. PMid:15621327.
23. Astephen JL, Deluzio KJ. Techniques in modern gait analysis and their application to the study of knee osteoarthritis. In:
Leondes CT, editor. Biomechanical systems technology: muscular skeletal systems. Los Angeles: World Scientific;
2010. p. 39-72.
24. Kirkwood RN, ResendeRA, MagalhãesCM, Gomes HA,
MingotiSA, SampaioRF. Application of principal component analysis on gait kinematics in elderly women with knee osteoarthritis. Rev Bras Fisioter.2011;15(1):52-8. http://dx.doi.
org/10.1590/S1413-35552011000100007. PMid:21519716.
25. Astephen JL, Deluzio KJ. A multivariate gait data
analysis technique: application to knee osteoarthritis. Proc Inst Mech Eng H. 2004;218(4):271-9. http://dx.doi.
org/10.1243/0954411041560983. PMid:15376729. 26. Brach JS, Perera S, StudenskiS, Katz M, Hall C, Verghese
J. Meaningful change in measures of gait variability in older adults. Gait Posture. 2010;31(2):175-9. http://dx.doi.
org/10.1016/j.gaitpost.2009.10.002. PMid:19889543.
27. EspyDD, Yang F, Bhatt T, Pai YC. Independent influence of gait speed and step length on stability and fall risk. Gait Posture. 2010;32(3):378-82. http://dx.doi.org/10.1016/j.
gaitpost.2010.06.013. PMid:20655750.
28. Kirkwood RN, MoreiraBS, ValloneML, MingotiSA,
DiasRC, SampaioRF. Step length appears to be a strong discriminant gait parameter for elderly females highly
concerned about falls: a cross-sectional observational
study. Physiotherapy. 2011;97(2):126-31. http://dx.doi.
org/10.1016/j.physio.2010.08.007. PMid:21497246. 29. Verghese J, Wang C, LiptonRB, HoltzerR, Xue X. Quantitative
gait dysfunction and risk of cognitive decline and dementia.
J Neurol Neurosurg Psychiatry. 2007;78(9):929-35. http://
dx.doi.org/10.1136/jnnp.2006.106914. PMid:17237140. 30. Webster KE, Wittwer JE, Feller JA. Validity of the
GAITRite walkway system for the measurement of
averaged and individual step parameters of gait. Gait Posture. 2005;22(4):317-21. http://dx.doi.org/10.1016/j.
gaitpost.2004.10.005. PMid:16274913.
31. MenzHB, LattMD, Tiedemann A, Mun San KwanM, Lord
SR. Reliability of the GAITRite walkway system for the quantification of temporo-spatial parameters of gait in young and older people. Gait Posture. 2004;20(1):20-5. http://dx.doi.
org/10.1016/S0966-6362(03)00068-7. PMid:15196515. 32. Beauchet O, Allali G, Annweiler C, Bridenbaugh S, Assal F,
Kressig RW, et al. Gait variability among healthy adults: low and high stride-to-stride variability are both a reflection of gait stability. Gerontology. 2009;55(6):702-6. http://dx.doi.
org/10.1159/000235905. PMid:19713694.
33. Brach JS, Berlin JE, VanSwearingenJM, Newman AB,
StudenskiSA. Too much or too little step width variability is associated with a fall history in older persons who walk at or near normal gait speed. J Neuroengineering Rehabil. 2005;2:21.
34. Jolliffe IT. Principal component analysis. 2nd ed. New York:
Springer; 2004.
Correspondence Renata Noce Kirkwood