264 Brazilian Journal of Physics, vol. 36, no. 2A, June, 2006
Dynamics of Defects and Surface Structure Formation in
Reticulated Vitreous Carbon
E. S. Gonc¸alves1,2, M. C. Rezende1, and N. G. Ferreira3 1Divis˜ao de Materiais, Instituto de Aeron´autica e Espac¸o,
2Instituto Tecnol´ogico da Aeron´autica Centro T´ecnico Aeroespacial, Prac¸a Marechal Eduardo Gomes,
50 – Vila das Ac´acias 12228-904, S˜ao Jos´e dos Campos-SP, Brazil and
3Laborat´orio Associado de Sensores e Materiais, Instituto Nacional de Pesquisas Espaciais,
Caixa Postal 515, 12245-970 S˜ao Jos´e dos Campos-SP, Brazil
Received on 1 April, 2005
Morphological and microstructure properties of reticulated vitreous carbon (RVC) were analyzed by scanning electron microscopy (SEM), micro-Raman spectroscopy and x-ray diffraction (XRD) techniques as a function of heat treatment temperature (HTT). Samples produced in the HTT range of 1000 to 2400 K have demonstrated a strong dependence of HTT in their structural order mainly attributed to the presence of hydrogen and oxygen (heteroatoms), originated from precursor. In this range, the material is changed from pyropolymer to carbon. The polyfurfuryl alcohol precursor has furanic groups and its cure originates methylenical bonds and sulphur atoms. At HTT higher than 1300 K, these atoms are gradually liberated from the material generating a discrete structure ordering.
Keywords: Defects; Surface Structure; Vitreous carbon
I. INTRODUCTION
Reticulated vitreous carbon (RVC) is an important material known by its high mechanical resistance, porosity, biocom-patibility and relatively high electric conductivity. The mor-phological and structural properties of such singular mater-ial have been extensively explored in the last decades, mainly due to their wide range of applications, for example, in ther-mal coating of airships [1,2], bony prostheses [3], heart valves [4-6], molecular sieves [7], hydrogenation catalyst supports [8], among others. Besides, RVC has a low density and high electrical conductivity [9] that is very attractive for elec-trochemical applications as three-dimensional electrode [10]. Electric conductivity variation is a determinant parameter for using RVC electrodes in many electrochemical applications. The proportional increase of conjugated carbon in the sp2 state during pyrolysis would change the material progressively from an insulator to a good conductor in the remarkable range of 19 orders of magnitude. The electrical properties will af-ford, therefore, a sensitive measure of various stages of py-rolysis and provide information on the structure of the final carbon [6].
RVC samples are usually produced from thermosetting resins used to impregnate polyurethane foams. The resin on the foam is hardened through curing reaction and can be car-bonized at different heat treatment temperature (HTT).
The goal of this work is to describe systematically mor-phological and structural properties of RVC three dimensional samples, produced from furfurylic resin at different HTT. The discussions will report the importance of thermal treatment related to its strong dependence for the microstructural prop-erties of this material, as pilling up width of layers (L002), in-terlayer distance (d002), from x-ray diffraction measurements (XRD) [11-13]. In addiction, the relative intensity of D and G bands associated with their ratio and FWHM analyses from Raman spectra have corroborated the XRD results.
II. EXPERIMENTAL
RVC was obtained from polyurethane (PU) foam based on polyether impregnated with furfuryl resin. The resin curing process needs to use p-toluenossulfonic acid as catalyst, at 3% w/w. The complete curing occurred after two hours at 360 and 400 K, assuring mechanical resistance to material. Each sample is submitted to a heat treatment process for ob-taining RVC. They are heated at 1 K.min−1, under inert
at-mosphere with nitrogen flow of 1 L.h−1, reaching the
maxi-mum temperature of 1000, 1300, 1600, 1800, 2100 and 2300 K, holding at this maximum temperature during 30 min and then cooling down to room temperature. The furfuryl resin used in this work is a national polymer and promotes denser final carbonized foam due to lower losses in volatiles cure and carbonization processes. This resin produces a material more electrically conductive and resistant to flexion than RVC ob-tained from phenolic resin [14].
A LEO 440 scanning electron microscope was used to observe RVC morphology and a Renishaw Microscope sys-tem 2000 in backscattering configuration at room sys-temperature employing 514.5 nm argon-ion laser to obtain micro-Raman spectra. This powerful and sensible technique permits an analysis of impurities and defects, especially the ones associ-ated to graphitic phases. XRD measurements were performed from a diffractometer Phillips, PW 1210/W/380/80.
III. RESULTS AND DISCUSSION
E. S. Gonc¸alves et al. 265
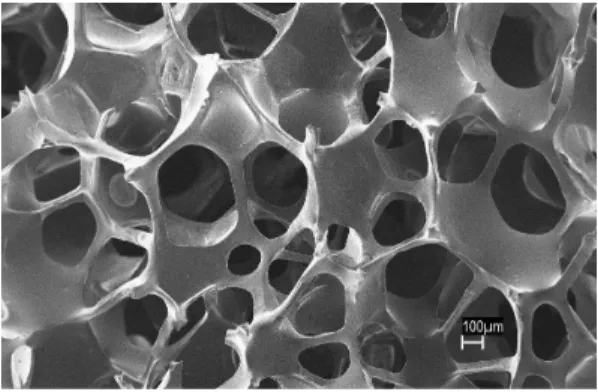
formed, corresponding to 70 ppi. This value is important to estimate the specific geometric surface area. Friedrichet al [9] have measured the strut areas of such pores by SEM and found a linear relation between the quantity of ppi and the specific surface area. By using this relation, it was evaluated for 70 ppi, a volumetric specific area of around 45 cm2cm−3.
FIG. 1: SEM image of RVC sample treated at 1300 K.
For discussing the microstructural properties of RVC sam-ples it is very important a systematic interpretation of XRD and Raman measurements in the whole range of studied tem-peratures. After carbonization process, RVC is a low vol-ume disordered glassy porous carbon with a continuous skele-tal structure, low resistance and some crysskele-tallographic order associated to its graphitization index [9]. RVC structures, also called turbostract carbon (TC), have their microstructure formed by disordered, no planar and confluent graphitic rib-bons. Figure 2 shows the pilling up width (L002)and inter-planar distance (d002) as a function of HTT for RVC sam-ples, as already studied by other authors [11,13,15]. Hydrogen and oxygen (heteroatoms) presence originated from precursor represents a contribution in surface interaction process [16], mainly for lower HTT [12]. This behavior justifies the intense decrease ofd002at range of 1000 - 1300 K, accomplished by increase ofL002due to the heteroatoms release.
In deed, this process concerns to the liberation of relatively large atoms as oxygen or nitrogen originated from precursor. This liberation occurs up to 1300 K where a significant de-crease of intralamellar distance appears. The more important contributions concerning to the TC organization was observed for HTT higher than 1500 K [17]. It is possible to observe this process in x-ray response at HTT higher than 1300 K, withL002increase and d002decrease. Additional contribution forL002increase is attributed to lamella estrangement.
Micro-Raman spectra for RVC substrate produced at 2300 K are shown in Fig. 3. RVC curve has a typical two bands spectrum of disordered polycrystalline and noncrys-talline graphitic carbons [18]. The first one, at approximately 1360 cm−1, exists only in defective carbons and is called
“D-band”, associated to disorder and edges of these crystals. The band at 1600 cm−1can always be presented in vitreous carbon
as a superposition of two components: G (1580 cm−1)and D’
FIG. 2: (a) Pilling up width (L002)and (b) interplanar distance
(d002)evaluated from XRD on RVC samples as a function of HTT.
800 1000 1200 1400 1600 1800
0 20 40 60 80 100
Inten
s
it
y (
a
.u
.)
Raman shift (cm-1 )
FIG. 3: Raman spectra of: (a) RVC sample treated at 1400 K.
(1620 cm−1)[13]. The G-band is called “graphitic” and
at-tributed to the graphite basal plane. On the other hand, the D’ band is attributed to second first order zone boundary phonon [18].
FIG. 4: (a) Relative intensity (ID/IG) and (b) relative FWHM
(ωD/ωG)between D and G bands observed in the RVC Raman
spec-tra as a function of HTT.
266 Brazilian Journal of Physics, vol. 36, no. 2A, June, 2006
spectra as a function of HTT, to observe carbon disorder de-gree [19,20]. It is important to note that these results were not related with carbon crystallinity, since results obtained by first order Raman spectroscopy have restrictions to evaluate the crystalline changes [21].
However, mainly G-band FWHM is a strong indicative of the better ordering of the graphite basal plane that forms TC structure. In the temperature range between 1000 and 1300 K, the ID/IG increase may be related to structural de-fects attributed to heteroatoms release process living imper-fect sites in their locations. Between 1300 and 1600 K, there are not heteroatoms, and theID/IGincrease is assimptotic, re-vealing an accommodation of lamellas in a structure with high graphitic character. Practically, this ratio does not vary un-til 1600 K. In this temperature, warrant itself that there are not heteroatoms in the carbonous structure. Relative inten-sity of D-band continues increasing for HTT higher than 1300 K, but between 1600 and 2100 K it is registered a significant increase. This contribution is mainly attributed to an addi-tional process on stacking and approaching of lamellar sur-faces, associated to TC confluence of such material. In addi-tion, theID/IGdecrease, observed above 2100 K, may be as-sociated to the initial stage of anisotropic structure formation process. TheωD/ωGvalues present D-band FWHM decrease, also indicating disorder degree increase with HTT increase up to 2100 K. These analyses agree with crystallinity results from XRD and indicate the contribution of heteroatoms until 1300 K and the predominance of TC formation above 1600 K. In spite of to be studied in the literature the ratioωD/ωGgo ob-serve the graphitization quality [18], for this work the intensi-ties evolution associated with D-band shift are more relevant.
This behavior is attributed to the formation of large reactivity sites [22].
It is important to highlight that XRD measurements are not necessarily related to Raman measurements. XRD offers data inherent to interlamellar structure, while Raman spec-troscopy results relate aspects of intralamellar structure, ob-serving phonon behavior. Thus, the narrowing of interlamellar distance, that indicates an ordering increase, is accomplished by defective sites appearance, as HTT increases. Thermod-inamically, this is expected, since all entropy decrease in a system is accomplished by neighborhood entropy increase. It is, therefore, notable that the entropy decrease, at interlamel-lar system and revealed by d002 behavior, compensated the entropy enhancement at intralamellar level, revealed byID/IG behavior.
IV. CONCLUSION
Structural properties of RVC as a function of HTT were studied by Raman and XRD analysis. In this range of car-bonization temperature (1000-2300 K) studied, different con-tributions are important to define L002 and d002 behaviors, which are in good correlation with D and G bands behaviors analyzed from Raman spectra. For HTT lower than 1500 K, heteroatoms presence represents a dominant contribution in surface interaction process while the more important contri-butions concerning to the TC organization was observed for HTT higher than 1500 K.
AcknowledgementThis work was supported by FAPESP and
CNPq.
[1] W. G. Bradshaw, P. C. Pinoli, and M. J. Mitchell, Recent Devel-opments in glassy carbon fabrication. Extended abstracts, 9th Biennial Conference on Carbon, Boston, MA. USA: American Carbon Society, 7, 1969.
[2] L.R. Bunnell, Proc. Vitreous carbon matrix carbon-carbon com-posite by copyrolysis.Extended abstracts, 12thBiennial Con-ference on Carbon. Pennsylvania, USA: American Carbon So-ciety, 333-334, 1975.
[3] R.B. Kaplan, Open cell tantalum structures for cancellous bone implants and cell and tissue receptors. US Patent 5282861, 1994.
[4] P. E. Ferrari, M. C. Rezende, R. C. Widner, R. A.di Iglia, M. F. B. Souza, and R. Bertazzoli, Utilizac¸˜ao do carbono v´ıtreo retic-ulado nacional para remoc¸˜ao de metais em descartes aquosos da ind´ustria metal/mecˆanica. 50o Congresso Anual da ABM, 1995..
[5] J. C. Bokros, Carbon,15, 353 (1977).
[6] G. M. Jenkins and C. J. Grigson, J. Biomed. Mater. Res.13, 371-394 (1979).
[7] J. L. Schmitt Jr. and P. L. Walker, Carbon,10, 87 (1972). [8] B. J. Cooper and D. L. Trimm In: Preprint 3rd Conference
on Industrial Carbon and Graphite, Soc. Chem. Ind., London, 1970.
[9] J. M. Friedrich, C. Ponce-de Le´on, G. W. Reade. and F. C. Walsh. Journal of Electroanalytical Chemistry,561, 203 (2004).
[10] X. Shui and D.D.L. Chung, Carbon34, 811 (1996).
[11] S. Otani and A. Oya. In: R. W. Cahn, P. Haasen and E. J. Kramer, editors.Materials Science and Technology- A compre-hensive treatment, vol 9, 1991.
[12] G. M. Jenkins and K. Kawamura.Polymeric Carbons–Carbon Fibre, Glass and Char. Cambridge University Press, Cam-bridge, 1976.
[13] L. A. Pesin, Journal of Materials Science37, 1 (2002). [14] M. C. Rezende, Produc¸˜ao de Carbono V´ıtreo em Escala de
Laborat´orio a partir de Resinas Furfur´ılica e Fen´olica.EPUSP, Universidade de S˜ao Paulo, Doctoral Thesis, 1991.
[15] F. Rousseaux and D. Tchoubar, Carbon15, 63 (1977). [16] F. Rousseaux and D.Tchoubar, Carbon15, 55 (1977).
[17] C. A. Leon y Leon and L.R. In: P. A. Thrower, editor.Chemistry and physics of carbon, vol 24, Dekker, New York, 1994. [18] D. S. Knight and W.B. White, Journal of Materials Research
4(2), 385 (1989).
[19] A. Cuesta, P. Dhamelincourt, J. Laureyns, A. Martinez-Alonso, and J.M.D., Journal of Materials Chemistry8(12), 2875 (1998). [20] A. C. Ferrari and J. Robertson, Physical Review B61, 14095
(2000).
[21] Y.J. Lee, Journal of Nuclear Materials325, 174 (2004). [22] R. Bowling, R. T. Packard and R. L. Mc Creery, Langmuir5,