Original Article
Artigo Original
Quantitative analysis of tongue movement
in 14 phonemes of Brazilian Portuguese
Análise ultrassonográfica quantitativa do
movimento da língua em 14 fonemas do
Português Brasileiro
Lídia Maurício da Silva1Aline Mara de Oliveira Vassoler1,2 Viviane Cristina de Castro Marino1 Larissa Cristina Berti1
Keywords
Measures of Speech Production Ultrasound Phonetics
Descritores
Medida da Produção de Fala
Ultrassonograia
Fonética
Correspondence address:
Lídia Maurício da Silva Universidade Estadual Paulista – UNESP
R. Oscar Muniz Sampaio, 48, Marília (SP), Brazil, CEP: 17525-070. E-mail: lidia.mauricio@hotmail.com
Received: December 24, 2016
Accepted: April 09, 2017
Study carried out at Departamento de Fonoaudiologia, Faculdade de Filosoia e Ciências, Universidade Estadual
Paulista Júlio de Mesquita Filho – UNESP - Marília (SP), Brazil.
1 Universidade Estadual Paulista – UNESP - Marília (SP), Brazil.
2 Fundação Educacional de Fernandópolis – FEF - Fernandópolis (SP), Brazil. Financial support: CAPES.
Conlict of interest: nothing to declare. ABSTRACT
Purpose: The aim of this study was to characterize the ultrasonographic pattern of tongue movement in 14 consonant phonemes of Brazilian Portuguese (BP), seeking to identify and describe ultrasonographic parameters that could grasp the difference of manner and place of articulation among these phonemes. Methods: We selected 20 individuals with typical speech production, aged between 20-30 years of both genders. The selected stimuli included the 14 lingual consonant BP phonemes in the intervocalic context of [a]. Data were collected and analyzed with the use of ultrasound, and the AAA (Articulate Assistant Advanced) and the Ultra-CATS (The Ultrasonographic Contour Analyzer for Tongue Surfaces) softwares. Three ultrasound parameters were used for data analysis: anteriority index (AI), global average of tongue height (GA) and relative anteriority index (RAI). Data were statistically analyzed. Results: ANOVA showed a signiicant effect on the parameters and the
RAI differentiated phonemes as the place (alveolar, pre-palatal, palatal and velar) and manner of articulation (fricative, nasal and occlusive); GA differentiate phonemes only as the place of articulation (alveolar, pre-palatal and velar). Conclusion: There was no single US parameter that could differentiate place and manner of articulation simultaneously. The clinical application for analysis of speech production disorders require the use of at least two ultrasound parameters: one to distinguish the place and another to distinguish the articulation manner.
RESUMO
Objetivo: O objetivo deste estudo foi caracterizar o padrão ultrassonográico do movimento de língua em
14 fonemas consonantais do Português Brasileiro (doravante PB), buscando identiicar e descrever que parâmetros ultrassonográicos poderiam apreender a diferença de modo e ponto de articulação entre esses
fonemas. Método: Foram selecionados 20 indivíduos com produção típica de fala, de 20 a 30 anos, de ambos
os gêneros. Os estímulos selecionados contemplaram os 14 fonemas consonantais linguais do PB no contexto
da vogal [a]. Os dados foram coletados e analisados com o uso do ultrassom e dos softwares AAA (Articulate Assistant Advanced) e Ultra-CATS (The Ultrasonographic Contour Analyzer for Tongue Surfaces). Três índices
ultrassonográicos (US) foram utilizados para análise de dados: índice de anterioridade (IA), média global (MG)
e índice de anterioridade relativa (IAR). Os dados foram submetidos à análise estatística. Resultados: A ANOVA
mostrou efeito signiicante para os índices IAR e MG, sendo que o IAR diferenciou os fonemas quanto ao ponto
(alveolar, pré-palatal, palatal e velar) e modo de articulação (fricativa, nasal e oclusiva) e o MG diferenciou os fonemas somente quanto ao ponto de articulação (alveolar, pré-palatal e velar). Conclusão: Não houve um único índice US que pudesse diferenciar todos os pontos e modos de articulação simultaneamente. A aplicação clínica
para análise das alterações da produção da fala requer o uso de pelo menos dois índices ultrassonográicos: um
INTRODUCTION
The production of speech sounds is a highly complex task that, to be aurally retrieved as typical, requires the interaction of different structures of the vocal tract in a coordinated, organized and planned way(1).
Although researchers, over the years, have already described in detail the process of production of speech sounds from the auditory analysis, technological advances have brought great beneits to these descriptions, as they not only enabled the incorporation of quantitative measures, but also enabled the description of phonic facts imperceptible to the human ear(2).
Among the technologies used nowadays, the acoustic analysis has occupied an important space in studies of speech production. There is a vast amount of studies using this tool to describe typical production in adults(3), typical production in children(4),
besides atypical production in different clinical groups(5).
Despite the great contribution of acoustic analysis to the description of speech sounds, articulatory studies are required, as the former just infers the articulatory movement that it generated.
The evaluation of articulatory movements involved in the production of speech sounds can be made by various instruments, such as: electropalatography, micro X-ray, ultrasound, articulography, among others. However, among the methodologies of analysis, the tongue ultrasonography stands out as an instrument of higher cost-beneit(6), considering equipment cost, portability, safety
and visualized structures.
Although many studies with the use of tongue ultrasound are found in the literature, the use of this instrument as a methodology for the analysis of the production of speech sounds is mostly performed internationally since the 1960s(7-9).
These studies contemplate both a qualitative and a quantitative description of patterns of speech production in adults(10,11), in
typical children(12,13), and in different clinical groups, such as:
hearing impaired individuals(14,15), children with apraxia of
speech(16,17), glossectomized individuals(18,19) and individuals
with tongue paresis(20).
Among the cited studies that aimed to analyze the typical production in adult and/or child speech(10-13), there is a limited
number of individuals (varying from 6 to 10) using both qualitative and quantitative parameters to describe the tongue movement held in the production of different speech sounds (/p/; /t/; /k/; /f/; /s/; /∫/; /l/ e /r/). On the other hand, the studies that aimed to analyze speech production in different clinical groups mostly used ultrasound for therapeutic purposes, as a feedback instrument.
In the international literature, some ultrasonographic indices are described to differentiate the production of lingual phonemes of English, such as: MCI (Modiied Curvature Index)(10), Concavity, Anteriority, Asymmetry(18), among
others(11,13,20,21). However, not all indices are sensitive to grasp
the difference in typical production, not being used, until now, for clinical application.
In contrast, the use of this methodology in Brazil is still very recent and, therefore, there are few studies about it(1,22,23).
The existing studies describe, from a qualitative analysis, the
movement patterns of the tongue in adult individuals (varying from 1 to 5) and in just a few phonemes, involving only the classes of liquids and fricatives.
It is possible, however, to assume from the literature consulted that because of analytical studies of the production of speech sounds with the use of ultrasound in Brazil still very recent, there is not yet a detailed description of a normative standard for the segments of the Brazilian Portuguese (BP). Among the existing studies, the method of analysis is essentially qualitative and the number of individuals examined is also restricted.
Because the tongue ultrasound (US) presents a great potential for clinical application, it emerges the need of a detailed quantitative description to understand what would be considered typical patterns, as well as the possible normal variations resulting, later, in the differentiation between varying and atypical patterns. Thus, a proposal of articulatory description of this nature is justiied insofar as: (1) it will provide quantitative articulation data for the production of 14 consonant phonemes of Brazilian Portuguese (BP); (2) it will provide parameters for comparative analysis with clinical groups; (3) it may provide explanations of phonological processes applied in BP.
Therefore, this study aims to characterize the tongue movement in 14 consonant phonemes of BP through quantitative ultrasonographic parameters, seeking to identify and to describe which of these parameters could apprehend the difference of manner and place of articulation between lingual phonemes in typical speech production. We will not seek the conirmation of any speciic hypothesis, given that this study will bring the irst insights regarding the quantiication of tongue movement during the production of 14 consonant phonemes of BP.
METHODS
This study was approved by the Research Ethics Committee (REC) of Faculdade de Filosoia e Ciências, Marília, Universidade Estadual Paulista “Júlio de Mesquita Filho” - UNESP, nº 1.268.673/2015. All individuals included in the research were aware of and signed an Informed Consent Form (ICF) presented to them.
Casuistry
This was a clinical, prospective and quantitative study. The sample used was deined by convenience.
Twenty native speakers of Brazilian Portugueseparticipated in this research. They were monolinguals, with typical speech production between the ages of 20 and 30 years, and of both genders (10 men and 10 women). The participants were recruited into a clinical school from the city of Marília. The choice of an adult population and of both genders for the study is due to the absence of studies that determine regulatory parameters to quantify the tongue movements for the consonants of BP; and secondarily to a concern in contemplating ultrasonographic values that would considerate the existing variability among individuals, speciically in regards to gender.
absence of hearing disorders; in addition to the absence of changes in the production of speech sounds. A Checklist was applied individually with each participant to track if they met the inclusion criteria proposed in the study.
Of 26 individuals recruited for data collection, one was dismissed for using braces and ive were excluded by the dificulty of seeing the surface of the tongue throughout its extension (from the tip to the dorsum), through US.
Experimental procedure
Equipment
Data collection was made by using a portable ultrasound, model DP 6600, containing a transducer attached to a computer, unidirectional microphone and head stabilizer. Data were captured and analyzed by software AAA(24) (Articulate Assistant
Advanced) and Ultra-CATS(25) (The Ultrasonographic Contour
Analyzer for Tongue Surfaces). The acoustic and image signals were recorded simultaneously with the use of AAA software combined with a synchronizer that allows synchronization between the images and the sound signal. The US images were acquired with a 6.5 MHz of image frequency, 120° of image ield and 29.97 Hz of sampling rate.
Stimuli
The occurrences of the 14 lingual consonantal phonemes of BP were privileged (/ӏ/, /ʎ/, /г/, /ʀ/, /n/, /ŋ/, /t/, /d/, /ĸ/, /ɡ/, /s/, /ʃ/, /ʒ/ e /ᴢ/) in context of the vowel /ɑ/.
Isolated stimuli were used in this research, insofar as they provide better synchronization between the image and the sound signal, thus ensuring a greater accuracy of data. The isolated production task allows us to study the target in detail, so the stimuli were 14 monosyllabic wug-words, which were constructed from the IPA (International Phonetic Alphabet) international phonetic model.
Therefore, the list of sounds of the inventory analyzed was: (/ɑ’ӏɑ /, /ɑ’ʎɑ/, /ɑ’гɑ/, /ɑ’ʀɑ/, /ɑ’nɑ/, /ɑ’ŋɑ/, /ɑ’tɑ/, /ɑ’dɑ/, /ɑ’ĸɑ/, /ɑ’ɡɑ/, /ɑ’sɑ/, /ɑ’ʃɑ/, /ɑ’ʒɑ/ e /ɑ’ᴢɑ/).
Recording procedure
The recordings were made separately with each participant in an acoustically treated room. The individual was positioned upright in a chair in front of a computer screen. A stabilizer(24)
was used to ix the ultrasound transducer to 90º in relation to the submandibular region of the participants and to prevent unwanted movements during the recording period. The transducer positioning at 90º allows the visualization of the tongue in sagittal plane.
With the use of AAA software, all stimuli of the experiment were displayed graphically on the computer screen in a randomized way. Before starting the evaluation itself, the judge held a training with the participants, to ensure the understanding of the task to be performed. Three repetitions of each stimulus were requested, computing a total of 840 iles (20 individuals × 3 repetitions × 14 consonantal segments × 1 vowel context = 840 iles).
Data treatment
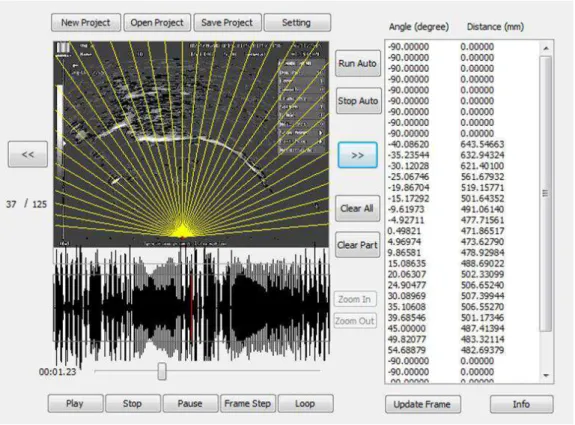
For each recording the framei corresponding to the maximum
amplitude of constriction of the tongue for the production of the phoneme was selected (Figure 1), in which the surface of the tongue can be seen throughout its extension, from its previous portion up to its posterior portion.
In each selected frame, an outline of the tongue shape was made using the software Ultra-CATS. The evaluator executed the outline using the drawing tool, cautiously, to obtain a irm stroke and to value the information contained in the image, taking care of the whole extension of the surface of the tongue, from its tip to the dorsum. The software used provides numerical information by measuring points on the tongue surface with a polar grid, which traces 35 lines arranged in a fan shape. The drawn lines (fans) correspond to angles from -85° to +85°, in the range of 5°, as shown in Figure 1. The program saves measurements in text ile format, allowing, later, the extraction and analysis of data. For analysis, data corresponding to the fans from -60° to + 60° were considered, since the most extreme angles did not contain information, that is, their values were null. Null values occur once the length of the tongue and the transducer positioning vary among individuals. Therefore, after obtaining the values, data were aligned from the 0º angle.
Ultrasound parameters
Based on a study(18), an ultrasonographic parameter designated
anteriority index (AI) was adopted and other two parameters were developed, namely: global average of tongue height (GA) and relative anteriority index (RAI).
The anteriority index corresponds to the multiplication of values extracted in millimeter (mm) for each point measured with a weighted correspondent number, as represented in Equation 1.
( ) ( )
( )
12xa 11xb 10xc ... 0 xm xn xo ... 12 xy 12xa 11xb 10xc ... 12xy
+ + + + + + +
+ +
(1)
Where the distance between xa and xy corresponds to the tongue height in different values provided by the fans.
Thus, with the values for the anterior portion of the tongue multiplied by one increment, higher IA values mean that the anterior portion of the tongue was in more movement when compared with the average and posterior portion, while lowest IA values suggest higher movement for the posterior portion of the tongue.
The global average of tongue height (GA) refers to the average of the values valid for fans between -60° and 60°. The range of angles stipulated for analysis is suficient to report global information about the tongue surface throughout its extension for the different individuals. Higher values of GAD mean that the middle and posterior portion of the tongue showed higher movements when compared with the anterior portion of the tongue.
The relative anteriority index (RAI) corresponds to the difference between the mean value of the global average of
i
tongue height and the average value of the height of the anterior portion of the tongue (corresponding to the average of the angles -60° to -15°). Higher RAI values mean that the anterior/middle portion of the tongue showed the highest movement compared with the posterior portion of the tongue, while lower RAI values suggest that there has been higher movement of the posterior portion of the tongue.
Statistical analysis
A descriptive statistical (average and standard deviation) and inferential treatment of data was conducted with the use of IBM SPSS Statistics software (version 2.2). For inferential analysis, the ANOVA One-Way test was adopted, considering as dependent variables the three US parameters and as independent variables the point with four levels (alveolar, pre-palatal, palatal, and velar) and the manner of articulation with ive consonant classes (occlusive, fricative, nasal, and lateral and non-lateral liquids). The Bonferroni test, with Post-Hoc analysis, was also conducted to verify which points and manners of articulation differed among themselves. A signiicance level of α≤0.05 and a conidence interval of 95% were established.
RESULTS
Tables 1 and 2 present the estimated values in millimeters (assuming a conidence interval of 95%) for the three parameters examined (index of anteriority, global average and relative anteriority index) depending on the extent and manner of articulation of the phonemes analyzed.
Anteriority index
As for the index of anteriority (IA), the ANOVA did not show any signiicant effect either to place of articulation (F(3.279)=0.22, p>0.88) or to manner of articulation (F(4.279)=0.54, p>0.70). This means that AI was not sensitive to differentiate any place and manner of articulation.
Global average of tongue height
Considering the US parameter on the global average of tongue height, ANOVA showed a signiicant effect to the place of articulation (F(3.279)=4.44, p>0.00), but not to the manner of articulation (F(4.279)=0.825, p=0.51). The Post Hoc test of pairwise comparison showed differences between the average global height of the alveolar and pre-palatals and the global average height of the velars, with values obtained in the following descending order: velar, palatal, alveolar and pre-palatal (as shown in Chart 1).
Relative anteriority index (RAI)
For RAI, which corresponds to the difference between the mean value of the global average of tongue height and the mean value of the height of the anterior portion of the tongue (corresponding to the average of the angles from -60° to -15°), there was a signiicant effect for both place (F(3.279)=44.84, p>0.00) and manner of articulation (F(4.279)=88.756, p>0.02).
among them, except in the comparison between pre-palatals and palatals. The trend observed for RAI values were higher for the palatal/pre-palatals, followed by alveolars and, inally, the velars (as shown in Chart 2).
As to the manner of articulation, the Post Hoc test on pairwise comparison showed that only the nasals presented higher values in relation to occlusives and fricatives (as shown in Chart 3).
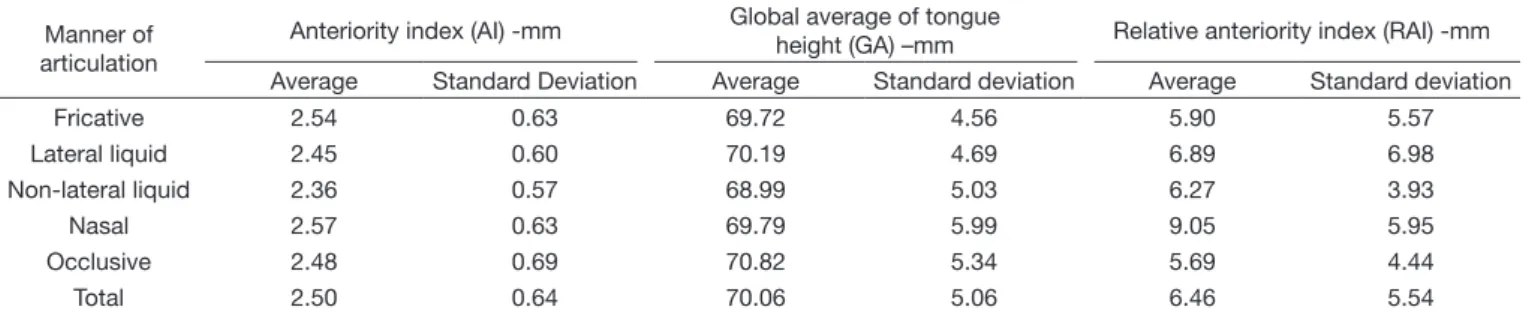
Table 2. Descriptive statistics (average (X) and standard deviation (±)) for the parameters: anteriority index, global average and relative anteriority index according to the place of articulation
Manner of articulation
Anteriority index (AI) -mm Global average of tongue
height (GA) –mm Relative anteriority index (RAI) -mm
Average Standard Deviation Average Standard deviation Average Standard deviation
Fricative 2.54 0.63 69.72 4.56 5.90 5.57
Lateral liquid 2.45 0.60 70.19 4.69 6.89 6.98
Non-lateral liquid 2.36 0.57 68.99 5.03 6.27 3.93
Nasal 2.57 0.63 69.79 5.99 9.05 5.95
Occlusive 2.48 0.69 70.82 5.34 5.69 4.44
Total 2.50 0.64 70.06 5.06 6.46 5.54
Source: Descriptive statistics; (mm) = millimeter
Chart 1. Post Hoc test of pairwise comparison for the parameter: global average of tongue shift according to the point
Comparison among places
of articulation Alveolar Pre-palatal Palatal Velar
Alveolar - 0.44 0.09 0.00*
Pre-palatal 0.44 - 0.45 0.04*
Palatal 0.09 0.45 - 0.23
Velar 0.00* 0.23 0.04*
-*(p>0.05). Post-Hoc test of pairwise comparison
Chart 2. Post Hoc test of pairwise comparison for the parameter: relative anteriority index according to the point Comparison among places
of articulation Alveolar Pre-palatal Palatal Velar
Alveolar - 0.00* 0.00* 0.00*
Pre-palatal 0.00* - 0.02* 0.00*
Palatal 0.00* 0.02* - 0.00*
Velar 0.00* 0.00* 0.00*
-*(p>0.05). Post-Hoc test of pairwise comparison
Chart 3. Post Hoc test of pairwise comparison for the parameter: relative anteriority index according to the point Comparison among
Manner of articulation Fricative Lateral liquid Non-lateral liquid Nasal Occlusive
Fricative - 0.33 0.78 0.00* 0.80
Lateral liquid 0.33 - 0.67 0.79 0.25
Non-lateral liquid 0.78 0.67 - 0.06 0.67
Nasal 0.00* 0.07 0.64 - 0.00*
Occlusive 0.80 0.25 0.67 0.00*
-*(p>0.05). Post-Hoc test of pairwise comparison
Table 1. Descriptive statistics (average (X) and standard deviation (±)) for the parameters: anteriority index, global average and relative anteriority index according to the place of articulation
Place of articulation
Anteriority index (AI) -mm Global average of tongue
height (GA) –mm Relative anteriority index (RAI) -mm
Average Standard Deviation Average Standard deviation Average Standard deviation
Alveolar 2.49 0.58 69.17 4.82 5.10 4.17
Pre-palatal 2.48 0.67 69.84 4.55 10.05 4.64
Palatal 2.58 0.70 70.67 5.62 12.42 5.20
Velar 2.49 0.72 71.89 5.11 3.26 4.94
Total 2.50 0.64 70.06 5.06 6.46 5.54
DISCUSSION
The ultrasonography of tongue movement allows the direct visualization of this structure in a natural and non-invasive way during speech(1). To use the tongue ultrasound as an auxiliary
resource in the analysis of speech production allows more reliable data to be collected and measured, enabling the apprehension of typical patterns, the possible variations of these patterns and also the patterns considered atypical(26).
This study aimed to characterize the tongue movement in 14 consonant phonemes of BP through quantitative ultrasonographic parameters, seeking to identify and describe which of these parameters could apprehend the difference of manner and place of articulation between lingual phonemes in typical speech production.
The ultrasonographic images of tongue movement were generated in two dimensions of the sagittal plane, allowing the visualization of all its extension, from the anterior portion up to the posterior portion(26). This means that ultrasonographic
measures of tongue correspond to the values of both the x axis (angles adopted in the US image), and the y axis (height in mm of the tongue’s position). Thus, for the distinction between the articulation points of phonemes, the indices should differentiate the numerical values related to the position of the tongue in the ultrasonographic image, considering primarily the values of its height in relation to the adopted angles (from -60° to +60°). To distinguish the manner of articulation of phonemes, the indices should differentiate primarily the numerical values related to the tongue height in the ultrasonographic image (vertical axis). The analysis was based on a US parameter already used in the literature, the anteriority index(18), and other two indices were
developed: the global average of tongue height and relative anteriority index.
The anteriority index, as proposed in a previous study, corresponds to a weighted average of tongue height in the sagittal plane in which the values related to the anterior portion of the tongue are multiplied by an increase in the weighted average calculation (as already described in the methodology). It was expected that this index could differentiate fundamentally the phonemes produced by the anterior portion of the tongue (such as the alveolar and pre-palatals) of the phonemes produced by the middle and posterior portion of the tongue (as in the case of palatals and velars). However, the anteriority index did not show any signiicant effect to either the point or the manner of articulation.
Two reasons may be at the basis of the explanation for the non-differentiation of the place and the manner of articulation. The irst is due to the positioning of the tongue inside the vocal tract. If we consider the space of vertical displacement of the different parts of the tongue in the vocal tract, the anterior portion will always present smaller displacement compared with the middle/posterior portion, by its own anatomical coniguration. In other words, due to the smaller space between the tip of the tongue and the alveoli relatively to the space between the middle portion of the tongue and the hard palate, the height values reached by the anterior part of the tongue when producing the alveolars will always be smaller than the height values reached by the
middle and posterior part of the tongue when producing palatals and velars. The same reasoning can be applied in relation to the manner of articulation. That is, a total or partial obstruction on palatal or velar region will always have height values higher than a total occlusion in the alveolar region.
Thus, in obtaining the anteriority index, even though the values corresponding to the anterior part of the tongue have been multiplied by an increase in the weighted average calculation, the adjustment made may still have been insuficient to compensate for the difference in height values depending on the positioning of the tongue in the vocal tract.
The second explanatory hypothesis is that this index is not a relative measure. This means that factors such as the positioning of the transducer probe at the moment of data collection, the size of the oral cavity of the participants, as well as possible head movements may have interfered in obtaining the pertinent values to this parameter(27).
The second index used in the analysis was the global average of tongue height (GA). This index corresponds to a global measure of tongue movement, resulting from the average of height values of the entire extension of the tongue. Higher GA values should be found for phonemes produced with the middle and posterior portions of the tongue, since these portions are already positioned higher in the interior of the tract relatively to the anterior portion of the tongue. Similarly, higher values of GA should be observed in phonemes produced with a total obstruction compared with phonemes produced with a partial obstruction, since the tongue should occupy a higher position in the interior of the tract to hold the complete blockage.
It was observed that this index was sensitive to distinguish the phonemes produced with the most extreme parts of the tongue (alveolar and pre-palatals vs velars), considering the anteroposterior axis, but it not distinguished the remaining places of articulation and no manner of articulation. The velar phonemes presented higher values of the global average of tongue height than the alveolars and pre-palatals, as expected.
Some authors(28,29) have reported that ultrasonographic
quantitative measures are more effective to show differences in global production than differences from subtle productions. In a recent study(21), for example, the authors conirmed the
relevance of using only a quantitative ultrasonographic index that depicts the differences in the production of some English consonantal phonemes (namely: /г/, /ӏ/, /w/, /ɡ/, /nɡ/, /n/, /у/, /t/, /ʃ/, /tɑ/, /s/, /d/ e /ᴢ/) in the context of 7 different vowels in typical speech production of 10 adults. For that, the authors developed an index that could quantify the different degrees of curvature of the entire length of the tongue in sagittal plane, called constriction index (CI). For analysis, the sounds were grouped into six manners of articulation (liquid, semivowels, nasals, occlusives, vowels and fricatives). The results showed a signiicant difference of the liquid sounds to the other groups. Therefore, it was concluded that the CI was not able to distinguish all the phonemes of the inventory analyzed.
(corresponding to the average of the angles from -60° to -15°). Higher values of RAI mean that the anterior/middle portion of the tongue presented higher movement compared with the posterior portion of the tongue, while lower RAI suggest that there was higher movement of the posterior portion of the tongue.
It was observed that RAI differentiated the phonemes regarding the four points of articulation analyzed, as well as the nasal class from the occlusive and fricative classes.
Because this index is a relative measure, since it considers the difference between values and not the absolute value itself, it minimizes the inluence of differences in size of tracts, transducer positioning etc. Therefore, this parameter was the most solid to distinguish the place of articulation of the phonemes analyzed.
Previous studies(11,27,30) have also pointed to the advantages
of using ultrasonographic measures relatively to the absolute measures, precisely because the effects of inter-speaker variability are minimized. In a speciic study(27), the authors analyzed the
productions of /p/, /t/, /s/ e /ʃ/ followed by vowels /a/ and /i/ in the speech of 10 teenagers using relative ultrasonographic measures, comparing two data collection conditions: with and without the use of head-stabilizer. Among the measures tested, only one was completely unaffected by the condition of head stabilization. The authors concluded that the proposed ultrasonographic measures could provide more consistent results in the analysis of speech production. Thus, as reported by the authors, the results of this study also suggest that relative measures are the most sensitive and suitable for ultrasonographic analysis of speech production.
Our indings show that a single measure was not suficient to differentiate the phonemes regarding the four places and ive manners of articulation, which implies that quantitative analyses of tongue movements during speech should be performed with the combination of two or more measurements. This inding corroborates with the international literature as in a speciic study(10) that veriied the success and appropriateness of the use of
three types of analysis to quantify the form and the complexities of the tongue. The authors analyzed 15 phonemes of the English language produced by six typical adults through three indices based on Procrustes analysisii, curvature inlections and Fourier
coeficients. The results showed that one of the indices was the best option to classify the complexity of the tongue, however, the combination of methods were more accurate to characterize the movements of the tongue.
CONCLUSION
Among the ultrasonographic measures used, namely: anteriority index, global average of tongue height and relative anteriority index, none were sensitive to simultaneously differentiate all the places and manner of articulation of the 14 BP phonemes.
The most solid ultrasonographic measure was the relative anteriority index, which differentiated the four places of articulation: alveolars vs pre-palatals vs palatals vs velars.
Both the global average of tongue height and the relative anteriority index privileged the differences among phonemes
ii
Procustes analysis refers to a kind of statistical analysis used to analyze a distribution of a set of shapes(10).
in the horizontal plane. Ultrasonoraphic measures that may provide a more accurate analysis in the vertical plane must be developed in future studies.
Likewise, the use of the measures proposed in the analysis of changes in speech production, to their clinical applicability, must be carried out in later studies, mainly to ascertain the potential of these indices in the description of speech disorders that involve the place of articulation.
ACKNOWLEDGEMENTS
To the National Council for Scientiic and Technological Development (CNPq) for the funding granted to carry out the research whose results were reported in this article.
REFERENCES
1. Barbarena LS, Keske-Soares M, Berti LC. Descrição dos gestos articulatórios envolvidos na produção dos sons /r/ e /l/. Revista Audiology Communication Research. 2014;19(4):338-44. http://dx.doi.org/10.1590/ S2317-6431201400040000135.
2. Silva AHP. O estatuto da análise acústica nos estudos fônicos. Cadernos
de Letras da UFF. 2010;41:213-29. [Dossiê letras e cognição]
3. Jesus LMT, Shadle CH. A parametric study of the spectral characteristics of European Portuguese fricative. J Phonetics. 2002;30(3):437-64. http:// dx.doi.org/10.1006/jpho.2002.0169.
4. Cristofolini C, Seara IC. Características acústicas de consoantes plosivas e fricativas produzidas por crianças de 6 a 12 anos: período de refinamento articulatório? Revista Verba Volant. 2012;3(1):55-71.
5. Pagan-Neves LO, Wertzner HF. Parâmetros acústicos das líquidas do
português brasileiro no transtorno fonológico. Pro Fono. 2010;22(4):491-6.
PMid:21271105. http://dx.doi.org/10.1590/S0104-56872010000400022. 6. Milke J, Baker A, Archangeli D, Racy S. Palatron: a technique for aligning ultrasound images of the tongue and palate. Coyote Papers. 2005;14:96-107.
7. Kelsey CA, Woodhouse RJ, Minifie FD. Ultrasonic observations of coarticulation in the pharynx. J Acoust Soc Am. 1969;46(4):1016-8. PMid:5824022. http://dx.doi.org/10.1121/1.1911793.
8. Skolnick ML, Zagzebski JA, Watkin KL. Two dimensional ultrasonic demonstration of lateral pharyngeal wall movement in real time - a preliminary report. Cleft Palate J. 1975;12:299-303. PMid:1057457. 9. Zharkova N, Hewlett N, Hardcastle WJ. An ultrasound study of lingual
coarticulation in /sV/ syllables produced by adults and typically developing children. J Int Phon Assoc. 2012;42(02):193-208. http://dx.doi.org/10.1017/ S0025100312000060.
10. Dawson KM, Tiede MK, Whalen DH. Methods for quantifying tongue shape and complexity using ultrasound imaging. Clin Linguist Phon. 2016;30(3-5):328-44. PMid:26587871. http://dx.doi.org/10.3109/02699 206.2015.1099164.
11. Ménard L, Aubin J, Thibeault M, Richard G. Measuring tongue shapes and positions with ultrasound imaging: a validation experiment using an articulatory model. Folia Phoniatr Logop. 2012;64(2):64-72. PMid:22212175. http://dx.doi.org/10.1159/000331997.
12. Zharkova N, Hewlett N, Hardcastle WJ. An ultrasound study of lingual coarticulation in /sV/ syllables produced by adults and typically developing children. J Int Phon Assoc. 2012;42(2):193-208. http://dx.doi.org/10.1017/ S0025100312000060.
13. Zharkova N, Hewlett N, Hardcastle WJ. Coarticulation as an indicator of speech motor control development in children: an ultrasound study. Motor Control. 2011;15(1):118-40. PMid:21339517. http://dx.doi.org/10.1123/ mcj.15.1.118.
evaluated by trained listeners. Clin Linguist Phon. 2003;17(3):199-216. PMid:12858839. http://dx.doi.org/10.1080/0269920031000071451. 15. Bacsfalvi P, Bernhardt BM, Gick B. Electropalatography and ultrasound in
vowel remediation for adolescentes with hearing impairment. Adv Speech Lang Pathol. 2007;9(1):36-45. http://dx.doi.org/10.1080/14417040601101037. 16. Preston JL, Brick N, Landi N. Ultrasound biofeedback treatment for persisting childhood apraxia of speech. Am J Speech Lang Pathol. 2013;22(4):627-43. PMid:23813207. http://dx.doi.org/10.1044/1058-0360(2013/12-0139). 17. Preston JL, Leaman M. Ultrasound visual feedback for acquired apraxia
of speech: a case report. Aphasiology. 2014;28(3):278-95. http://dx.doi. org/10.1080/02687038.2013.852901.
18. Bressmann T, Thind P, Uy C, Bollig C, Gilbert RW, Irish JC. Quantitative three-dimensional ultrasound analysis of tongue protrusion, grooving and symmetry: data from 12 normal speakers and a partial glossectomee. Clin Linguist Phon. 2005;19(6-7):573-88. PMid:16206485. http://dx.doi. org/10.1080/02699200500113947.
19. Acher A, Perrier P, Savariaux C, Fougeron C. Speech production after glossectomy: methodological aspects. Clin Linguist Phon. 2014;28(4):241-56. PMid:23837408. http://dx.doi.org/10.3109/02699206.2013.802015. 20. Bressmann T, Koch S, Ratner A, Seigel J, Binkofski F. An ultrasound
investigation of tongue shape in stroke patients with lingual hemiparalysis. J Stroke Cerebrovasc Dis. 2015;24(4):834-9. PMid:25724246. http://dx.doi. org/10.1016/j.jstrokecerebrovasdis.2014.11.027.
21. Stolar S, Gick B. An index for quantifying tongue curvature. Canadian Acoustics. 2013;41(1):11-5.
22. Berti LC. Investigação ultrassonográfica dos erros de fala infantil à luz da Fonologia Gestual. In: Gonçalves GF, Paula MRB, editores. Dinâmica dos movimentos articulatórios: sons, gestos, imagens. 1. ed. Pelotas: Editora UFPel; 2013. p. 127-143.
23. Wertzner HF, Francisco DT, Neves LOP. Contorno de língua dos sons /s/ e
/ʃ/ em crianças com transtorno fonológico. Revista Codas.
2014;26(3):248-51. http://dx.doi.org/10.1590/2317-1782/201420130022.
24. Articulate Instruments LTD. Articulate assistant user guide: version 2.11. Edinburgh: Articulate Instruments; 2010.
25. Bressmann T, Heng C, Irish JC. Applications of 2D and 3D ultrasound imaging in speech-language pathology. J Speech Lang Pathol Audiol. 2005;29(4):158-68.
26. Gonçalves GF, Paula MRB. Dinâmica dos movimentos articulatórios: sons, gestos, imagens. 1. ed. Pelotas: Editora UFPel; 2013.
27. Zharkova N, Gibbon FE, Hardcastle WJ. Quantifying lingual coarticulation using ultrasound imaging data collected with and without head stabilisation. Clin Linguist Phon. 2015;29(4):249-65. PMid:25651199. http://dx.doi.or g/10.3109/02699206.2015.1007528.
28. Davidson L. Comparing tongue shapes from ultrasound imaging using smoothing spline analysis of variance. J Acoust Soc Am. 2006;120(1):407-15. PMid:16875236. http://dx.doi.org/10.1121/1.2205133.
29. Harshman R, Ladefoged P, Goldstein L. Factor analysis of tongue shapes. J Acoust Soc Am. 1977;62(3):693-713. PMid:903511. http://dx.doi. org/10.1121/1.381581.
30. Berti L, Boer GD, Bressmann T. Tongue displacement and durational characteristics of normal and disordered Brazilian Portuguese liquids. Clin Linguist Phon. 2016;30(2):131-49. PMid:26853548. http://dx.doi.org/10 .3109/02699206.2015.1116607.
Author contributions
LMS main researcher, elaboration of the research, elaboration of the schedule, literature review, collection and analysis of the data, article writing, submission and procedures of the article; AMOV researcher, literature survey, data collection and analysis, article writing; VCCM researcher, collaborator, data analysis and