Original Article
Artigo Original
Cortical maturation of long latency auditory
evoked potentials in hearing children: the
complex P1-N1-P2-N2
Maturação dos potenciais evocados auditivos
de longa latência em crianças ouvintes:
análise do complexo P1-N1-P2-N2
Liliane Aparecida Fagundes Silva1Fernanda Cristina Leite Magliaro1 Ana Claudia Martinho de Carvalho1 Carla Gentile Matas1
Keywords
Evoked Potentials Auditory Audiology Central Nervous System Neuronal Plasticity Child
Descritores
Potenciais Evocados Auditivos Audiologia Sistema Nervoso Central Plasticidade Neuronal Criança
Correspondence address:
Liliane Aparecida Fagundes Silva Departamento de Fisioterapia, Fonoaudiologia e Terapia Ocupacional, Faculdade de Medicina – FMUSP, Universidade de São Paulo – USP R. Cipotânea, 51, Cidade
Universitária, São Paulo (SP), Brazil, CEP: 05360-160.
E-mail: [email protected]
Received: November 08, 2016
Accepted: April 11, 2017
Study carried out at the Departamento de Fisioterapia, Fonoaudiologia e Terapia Ocupacional, Faculdade de Medicina – FMUSP, Universidade de Sao Paulo – USP - São Paulo (SP), Brazil.
1 Departamento de Fisioterapia, Fonoaudiologia e Terapia Ocupacional, Faculdade de Medicina – FMUSP,
Universidade de São Paulo – USP - São Paulo (SP), Brazil.
Financial support: nothing to declare.
Conlict of interests: nothing to declare.
ABSTRACT
Purpose: The purpose of this study was to monitor the emergence and changes to the components of the Long Latency Auditory Evoked Potentials (LLAEP) in normal hearing children. Methods: This longitudinal study included children of both genders: seven aged between 10 and 35 months, and eight children between 37 and 63 months. The electrophysiological hearing evaluation consisted of analysis of LLAEP obtained in a sound ield generated with loudspeakers positioned at an azimuth of 90°, through which the syllable /ba/ was played at an intensity of 70 dB HL. Each child underwent an initial evaluation followed by two re-evaluations three and nine months later. Results: The emergence of LLAEP components across the nine-month follow-up period was observed. P1 and N2 were the most common components in children of this age range. There was no statistically signiicant difference regarding the occurrence of P1, N1, P2, and N2 components amongst younger and older children. Regarding latency values, the greatest changes overtime were observed in the P1 component for younger children and in the N2 component for older children. Only the P1 component signiicantly differed between the groups, with the highest latency values observed in younger children. Conclusion: LLAEP maturation occurs gradually and the emergence of complex components appears to be related more to the maturation of the central auditory nervous system than to chronological age.
RESUMO
INTRODUCTION
Hearing is a sense existent in the human being from the ifth month of intrauterine life. From that time on, the experiences lived by the individual allow the Central Auditory Nervous System (CANS) to go through neurophysiological changes, through neuronal plasticity, allowing auditory learning. This phenomenon of auditory maturation allows the development of auditory abilities, in other words, allows the individual not only to be capable of hearing, but also for sound stimuli heard to be detected, discriminated, recognized and understood(1,2).
In recent decades, Long Latency Auditory Evoked Potentials (LLAEP), traces generated by bioelectric activities from central auditory pathways after acoustic stimulation, have shown themselves to be a resource capable of measuring the
neurophysiological modiications resultant from the maturation
process(3,4). For its being an exogenous potential, in other words,
not dependent on the behavioral response of the individual, they can be a useful tool to evaluate, amongst other things, small children who have still not developed auditory and/or cognitive abilities to respond to other evaluations(5,6).
For this reason, studies have utilized this procedure to monitor, objectively, cortical maturation after speech-therapy interventions in children with language alterations(7), after
training of central auditory processing(8), as well as measuring
the beneits provided by the use of electronic devices, such as Personal Sound Ampliiers and Cochlear Implants(9).
It is known that the maturational development of the CANS is highly complex. Given this, it is also understood that there are many individual variables that can favor or hamper this process
and, consequently, directly inluence the results of the LLAEP.
Studies report that around only 41% of variability in latency values can be explained by maturation through the passage of chronological age. The other values correspond to other variables such as gender and individual cognitive abilities(10).
Considering the dificulty of realizing this procedure on small
children, there is still little that can be concluded in terms of the maturation of these potentials in hearing children younger
than six years of age, observing a divergence in the indings
in the literature.
Generally, it is reported in the literature that LLAEP traces in small children can be characterized by a large positive peak (P1), which emerges between 100 – 150 ms, followed by a negative peak (N2), which can be visualized at around 200 – 250 ms. With maturation of the CANS, it is expected that the components N1 and P2 emerge gradually, coming from the bifurcation in the component P1(11-16).
Despite these indings, other studies only infrequently
observe the components P1 and N1 in infants and children, with the component P2 being the most encountered(17). On the other
hand, in another study, it was observed that only the P1 peak was clearly present in children of 3 to 7 months of age(18) and
that, additionally, the components N1 and P2 are observed with greater frequency from 12 years of age(12).
Given the divergence between these results, the need for further research that would evaluate LLAEP in small children becomes evident. We hypothesize that a longitudinal analysis could permit a better understanding in terms of the emergence of components P1, N1, P2 and N2 of LLAEP in the same way
that modiications to the latency values in amplitude in small
children occur.
Therefore, the objective of the present study was to monitor
the emergence and modiications of LLAEP components in
hearing children younger than six years of age.
METHODS
A clinical study of the longitudinal type made up of 15 children with normal hearing, divided into two groups: Group 1 (G1) was
made up of seven children (ive girls and two boys) who had an age between 10 and 35 months in the irst evaluation, with
the average age being 24 months; group 2 (G2) was made up of eight children (four girls and four boys), with an age between
37 and 63 months during the irst evaluation, with the average
age being 47 months.
The study was approved by the Ethics Commission under review number 0319/11 and the procedures were carried out after signing the Free and Informed Consent by the parents or the respective guardians responsible for the patient.
The children underwent a hearing evaluation prior to the electrophysiological evaluation to rule out possible hearing loss. The evaluation was made up of Acoustic immittance measures
(tympanometry and study of acoustic relexes), and a set of
subjective tests (conventional or conditioned tonal audiometry, at the least at frequencies of 500, 1,000, 2,000 and 4,000 Hz, and the recognition limit for speech with simple commands or words), with these being selected according to the age and degree of understanding of the test by the child. In two cases, it was necessary to carry out the Brainstem Auditory Evoked Response (studying the electrophysiological limit) to complete the behavioral evaluation results.
The following were used as exclusion criteria: type A
tympanometric curve with acoustic relexes present, tonal
auditory limits below 20 dB HL for all the frequencies tested and a recognition limit for speech equal or up to 10 dB HL above the average of the limits obtained at frequencies of 500, 1,000 and 2,000 Hz. For the Auditory Evoked Brain Stem Potential, the inclusion criteria consisted of the presence of waves I, III and V at 80 dB HL for clicks with absolute and interpeak latencies within the limits for normality for the age range (according to the Intelligent Hearing Systems Manual) and the electrophysiological limit for cliques at 20 dB HL bilaterally.
Additionally, based on the data obtained in the anamnesis, children without linguistic, cognitive or neural behavior complaints, including those who had not received speech-therapy previously, were considered.
All the children in both groups went through the same
procedures at three different times (irst evaluation, and reevaluation three and nine months after the irst evaluation),
with the aim of investigating the maturation of the CANS across the nine months of monitoring.
The LLAEP records were obtained in an acoustically prepared room with the child in an alert state seated comfortably in a reclinable chair.
The children were instructed and/or stimulated to watch a
ilm without sound during the procedure. Due to the inherent dificulties of working with such young children, the evaluation
The equipment utilized was the Smart EP USB Jr from the Intelligent Hearing Systems (HIS 5020, Miami, Florida), which possesses two stimulation channels. Channel A was used to capture the responses from the right side of the channel and channel B for the left side. The position of the electrodes followed the norms of the International Electrode System-IES 10-20. The reference electrode was positioned on the mastoid of the ear tested and connected to the negative entry of the
pre-ampliier, while the active electrode was placed on Cz and
connected to the positive entry. The earth electrode was placed
on Fpz and connected to the ground entry of the pre-ampliier.
After cleaning the skin of the individual with abrasive paste, the electrodes were positioned with conductive paste for the electroencephalogram with microporous tape. The level of impedance of the electrodes was maintained below three kOhms.
The acoustic stimulus was presented using a sound ield system with the speakers positioned at a 90° azimuth at a distance
of 40 cm from the ear being tested. The stimulus used was the synthesized syllable /ba/ with a total duration of 114.88 ms (75 ms of the duration of a vowel and 18 ms of the duration of the consonant) made up of the following formats: F1=818Hz; F2=1,378Hz; F3=2,024Hz; F4=2,800Hz; F5=4,436Hz(19,20).
512 stimulations of alternating polarity were presented with an interstimulus interval of 416 ms, rate of presentation of 1.9 stimuli per second at an intensity of 70 dB HL. The high
pass and low pass ilters were from 1 and 30 Hz, respectively,
with an analysis window maintained between 0 ms pre-stimulus and 500 ms post-stimulus.
Two samples for each individual were collected with the
aim of conirming the presence of an electrophysiological
response. The components P1, N1, P2 and N2 of the LLAEP were analyzed in terms of their presence or absence in each
evaluation. These components were identiied considering the
latency values, the wave amplitude and the reproducibility of the trace. The amplitude measures consisted of the distance (height) between the positive peak and the following negative peak (P1-N1 and P2-N2).
To increase the accuracy of the analysis of the results, the electrophysiological traces were analyzed by three professionals
(blind for the study) qualiied for LLAEP analysis.
The results were statistically analyzed and the Chi square and Mid-P Exact tests were utilized to compare the proportion of responses present or absent for the components P1, N1, P2 and N2 between the three evaluations and between both the groups.
A p-value less than 0.05 was considered statistically signiicant.
Children who had an absence of all LLAEP components were excluded from the statistical calculations.
RESULTS
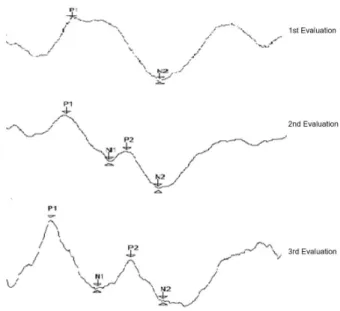
Across the nine months of monitoring, the presence of the components P1 and N2 were observed in 100% of individuals
from both groups from the irst evaluation. The components N1
and P2 were emerging over time during monitoring (Figure 1).
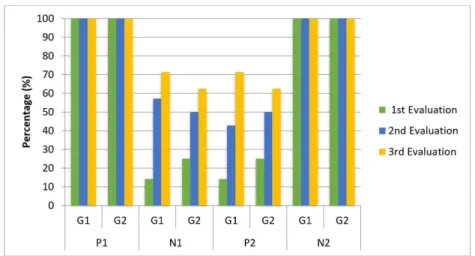
The components N1 and P2 were identiied in 14.2% of children from G1 in the irst evaluation and became more
frequent over time during monitoring, reaching an index of 71.4% in the third evaluation. For the children from G2, the
components N1 and P2 were identiied in 25% of the children
in the irst evaluation, reaching 62.5% after nine months of
monitoring (Figure 2).
A tendency toward statistical signiicance in terms of the
proportion of responses present over the nine months of monitoring was observed only in G1 for the components N1 and P2 between
the irst and third evaluations (p-value close to 0.05) (Table 1). A descriptive analysis of the data and the average values and of the standard deviations referent to the values for latency and amplitude of components P1, N1, P2 and N2 was realized, measurements in each evaluation in both groups are presented in Tables 2 and 3 respectively.
Due to a small number of children who showed presence of
components N1 and P2, especially in the irst two evaluations, it was
not possible to compare the latency values for these components using the statistical tests, or the values for amplitude of P1-N1 and P2-N2 over the nine months of monitoring. Therefore, the statistical analysis was only made up of the analysis of latency values of the components P1 and N2.
A statistical difference was observed in the latency values
of component N2 for the G1 between the irst and second
evaluations. On the other hand, for the component P1, a statistical difference in the latency values between the 1st and 3rd, 2nd and 3rd
was observed as well as between the three evaluations. For G2, statistical differences were only observed for the component N2 between the 1st and 3rd evaluations and between the three
(Table 4).
When comparing the latency values for components P1 and N2 between both groups in the three evaluations, statistical difference was only observed in the latency of component P1 in the 1st and 2nd evaluations, with the latency values of the children
from G1 being greater than those for G2 (Table 5).
Table 1. P-value of the difference of occurrence of the components P1, N1, P2 and N2 between the evaluations for both groups
Comparison between the evaluations G1 G2
P1 N1 P2 N2 P1 N1 P2 N2
First × Second 1.000 0.143 0.315 1.000 1.000 0.365 0.365 1.000
First × Third 1.000 0.054 0.054 1.000 1.000 0.178 0.178 1.000
Second × Third 1.000 0.633 0.347 1.000 1.000 0.657 0.657 1.000
First × Second × Third 1.000 0.083 0.097 1.000 1.000 0.309 0.309 1.000
Legend: G1-Group 1; G2- Group 2
Table 2. Average of latency values and amplitude of the components P1, N1, P2 and N2 in the three evaluations of G1
Evaluation Latency (ms) Amplitude (µV)
P1 N1 P2 N2 P1-N1 P2-N2
1st N 7 1 1 7 1 1
Average (DP) 129.71 (11.88) 234.00 (---) 261.00 (---) 261.29 (35.36) 4.74 (---) 0.62 (---)
2nd N 7 4 3 7 4 3
Average (DP) 127.86 (11.13) 174.50 (36.19) 213.00 (35.79) 253.57 (31.28) 3.41 (3.41) 2.67 (1.43)
3rd N 7 5 5 7 5 5
Average (DP) 121.00 (7.83) 173.80 (23,21) 206.60 (36.18) 251.71 (40.04) 3.36 (1.36) 3.35 (1.24)
Legend: N- Sample number; DP- Standard deviation; ms- milliseconds; µV- microvolts
Table 3. Average of latency values and amplitude of the components P1, N1, P2 and N2 in the three evaluations of the G2
Evaluation Latency (ms) Amplitude (µV)
P1 N1 P2 N2 P1-N1 P2-N2
1st N 8 2 2 8 2 2
Average (DP) 119.25 (4.40) 202.50 (14.85) 251.00 (41.01) 273.13 (21.09) 5.91 (0.77) 2.23 (2.25)
2nd N 8 4 4 8 4 4
Average (DP) 118.25 (5.34) 198.00 (11.52) 238.75 (18.50) 269.00 (19.84) 6.63 (1.02) 2.98 (2.10)
3rd N 8 5 5 8 5 5
Average (DP) 117.63 (5.10) 185.40 (11.84) 209.60 (16.23) 259.38 (21.81) 5.63 (1.31) 3.49 (1.92)
Legend: N- Sample number; DP- Standard deviation; ms- milliseconds; µV- microvolts
Table 4. P-value of the differences of the latency values of the components P1 and N2 between the three evaluations for both groups
Comparison between the evaluations G1 G2
P1 N2 P1 N2
First × Second 0.168 0.047* 0.519 0.036*
First × Third 0.007* 0.298 0.317 0.017*
Second × Third 0.012* 0.868 0.653 0.076
First × Second × Third 0.001* 0.472 0.537 0.008*
Legend: G1-Group 1; G2- Group 2; *p < 0.05
Legend: G1-Group 1; G2- Group 2
DISCUSSION
In the literature, there are gaps in terms of the development of LLAEP components in small children, both in terms of their
emergence as well as in terms of the modiications of the latency
values and amplitude. Therefore, the objective of the present
study was to monitor the emergence and the modiications of
LLAEP components in hearing children younger than six years of age, over a nine-month monitoring period.
In the data obtained, it was possible to observe in all the traces, the P1 component as a positive wave with a large amplitude, which appears at around 120 ms, followed by a negative wave (N2) which can be visualized at around 250 ms.
Such results agree with indings in the literature that afirm that
the components P1 and N2 have the greatest frequency in small children(11,13,14,21).
On the other hand a study, which evaluated LLAEP evoked by noise stimuli observed in children with ages between one month
and ive years, found mainly the component P2 in all individuals.
The latency of this component was of approximately 174 ms in children with an age range between seven and 18 months and of approximately 134 ms in children with an age between 24 and 66 months(17). Such values, are similar to latency values
for the component P1 observed both in the present study, as well as reported by other authors who evaluated children in a similar age range(10,18,22,23). It is important to highlight that such
indings can be derived by the different collection procedures
utilized to record LLAEP values, considering that the components P1, N1, P2 and N2 are exogenous potentials and therefore,
can suffer modiications according to the characteristics of the
stimulus.
In terms of components N1 and P2, neither was identiied
in all of the moments of the evaluation, with an increase being observed in the percentage of presence of these components,
going from 14.2% in the irst evaluation to 71.4% in the last
evaluation in the G1, and from 25% to 62.5% in the G2 during the same time interval. These results agreed with those observed in the literature, which reported observing mainly the presence of the components P1 and N2 in small children and that, with the advance of age, the other components emerged in a gradual manner(15,16,24).
In cases in which the emergence of these components (N1 and P2) were observed over the nine months, it was possible to see that they originated from an emergent bifurcation in the
component P1, and that they subsequently became more deined
(Figure 1). This data corroborates indings in the literature that also described the same phenomenon(15,16,25).
When comparing the occurrence of P1, N1, P2 and N2 over the nine months of monitoring, it was found that the results were similar in both the groups: in G1 only one extra child presented the components N1 and P2 in comparison with G2.
Considering these similarities, these indings could indicate
that the emergence of LLAEP components was more related to the degree of maturation of the CANS than to chronological age. Unfortunately, the small sample size, made additional
conclusions dificult. Studies with a larger sample size would
be necessary to strengthen these results.
It is known that maturation of the CANS is dependent on intrinsic and extrinsic factors. Intrinsic factors are related amongst other things to the susceptibility of the individual and to abilities for learning, such as cognitive functions for attention and memory. On the other hand, extrinsic factors are related to the exposure of the individual to the environment(1,26).
Such variables are capable of providing different development rhythms, and therefore, of leading to differences in the time of emergence for each component of the complex P1-N1-P2-N2.
With the stimulations of hearing, morphological and functional
modiications occur in the CANS: a greater number of neurons
begin to respond to the sound stimuli, there is an increase in
dendritic ramiication, an increase in neuronal myelination, and
the improvement of synaptic synchronizations and connections. This neuroplasticity allows the gradual emergence of the components P1, N1, P2 and N2 present in the LLAEP that, in
their turn, become more deined in morphology, with greater
amplitude and lower latency values as maturation occurs(15,27).
In terms of the latency values, the presence of component P1 at around 120 ms, followed by a negative peak at around 250 ms were observed. These values, are very close to those predicted in studies that carry out LLAEP with speech stimuli in small children(16,24).
Prior studies, which evaluated the latency values of LLAEP
components identiied the component P1 in children of three
years of age at approximately 130 ms, followed by a negative peak observed at around 250 to 450 ms (14). Other authors
evaluated children with ages between three and four years of age and observed latency values of the component P1 at approximately 107 ms(25).
Some authors evaluated LLAEP with speech stimuli in individuals with an age range less that that evaluated in the present study (babies of three to eight months) observing latency values for P1 and N2 greater than those of the present study (P1 between 150 and 200 ms and N2 with latency between 250 and 300 ms)(24). Other authors observed in children of two
to three years (age range similar to that of the present study) latency values for P1 of 133 to 156 ms and N2 of 242 to 255 ms, and in children of 4 to 8 years (age range greater than that of the present study), found latency values for P1 of 126 to 149 ms and N2 of 239 to 251 ms(16).
After nine months of stimulation, a reduction of latency values of component P1 in younger children (G1) was observed, as well as for component N2 in older children (G2). It is known that
myelination as well as maturation of the auditory nervous ibers,
mainly occurs in peripheral regions and gradually extends to the more central regions of the auditory system(26). This process
Table 5. P-value of the differences of the latency values of the components P1 and N2 in the three evaluations between the groups G1 and G2
Comparison between the evaluations
Latency
P1 N2
1st evaluation 0.037* 0.438
2nd evaluation 0.048* 0.268
3rd evaluation 0.333 0.647
is possibly responsible for the reduction in latency values for LLAEP components(15,27). In the present study, a reduction of
the latency for P1 in younger children relects the increase in
myelination in the primary auditory cortex. In older children (G2), there was a greater reduction in the latency values for N2, showing greater maturation in the central auditory pathways, as well as the supratemporal cortex.
It is observed that, generally, the latency values are lower in older children. When comparing the two groups, the component
P1 showed statistical difference in the latency values in the irst
and second evaluations. In the group of younger children (G1), the latency values for P1 were greater than those found in the older group of children. The data from this study suggests that this component seems to be the biomarker for the development of the auditory system in normally hearing children.
In a study with children between four and 12 years of age, it was observed that the main effect resultant from maturation was a reduction in latency of the component P1 with the increase of age, independently of the placement of the electrode and of the type of acoustic stimulus(28). For some authors, the response
of the LLAEP depended on the placement of the electrode for recording, accepting that the only peak can originate by different generators and that these areas have different maturation rates(29). However, the authors of this study(29), observed that
there is little variation in latency for P1 and N1B according to the different position of the electrode on the scalp. Up until ten years of age, the component P2 is much more evident when recorded with an electrode in a more posterior position (Pz) than in a position further back (Cz and Fz). The latency of component N2 increased according to age, with electrodes in a central position (Cz, C3 and C4), but the electrodes were not altered on the frontal area (Fz). Unfortunately, the LLAEP in the study were measured on only one recording channel, in which the electrode was not placed in the Cz position. Therefore, the analysis of various places for positioning of electrodes was limited and should be considered for future studies.
We should highlight that a dificulty in comparing the studies
that evaluated the LLAEP is the variety of procedures used for data collection. Considering that this is an exogenous potential,
that is to say, inluenced by the characteristics of the stimulus,
these methodological variations can explain the great diversity
of indings existent in the literature.
This variability observed in LLAEP studies, both in terms of latency values and amplitude, and of the occurrence of components of the P1-N1-P2-N2 complex, together with the
dificulty of realizing the procedure on such small children leads to a scientiic dificulty to standardize the values for normality.
Therefore, in cases evaluated individually, the LLAEP allow us to estimate if the functioning of the CANS is close to that expected for chronological age, however it does not allow us to determine with precision if the result is normal or altered. Such a procedure seems to be very effective to evaluate the degree of maturation and neuroplasticity of the CANS, and therefore, is useful for longitudinal monitoring.
It is worth noting that further studies, testing diverse types of procedures and with a larger sample are necessary to better
understand how the maturation process of the LLAEP takes place in children of this age range.
CONCLUSION
The LLAEP showed itself to be an effective clinical
resource to monitor the cortical modiications resultant from
the maturation process.
In the present study, the gradual emergence of LLAEP
components was observed, as well as a signiicant reduction in
the latency of the component P1 in younger children and of the
component N2 in older children. These indings suggest that the modiications of the LLAEP seem to be more related to the
maturation of the CANS than to chronological age.
REFERENCES
1. Boéchat EM. Plasticidade e amplificação. In: Fernandes FDM, Mendes BCA, Navas ALPGP, organizadores. Tratado de fonoaudilogia. 2. ed. São Paulo: Roca; 2010. p. 160-8.
2. Moore DR, Ferguson MA, Halliday LF, Riley A. Frequency discrimination in children: perception, learning and attention. Hear Res. 2008;238(1-2):147-54. PMid:18222053. http://dx.doi.org/10.1016/j.heares.2007.11.013. 3. Maurer J, Collet L, Pelster H, Truy E, Gallégo S. Auditory late cortical
response and speech recognition in digisonic cochlear implant users. Laryngoscope. 2002;112(12):2220-4. PMid:12461344. http://dx.doi. org/10.1097/00005537-200212000-00017.
4. Fallon JB, Irvine DRF, Shepherd RK. Cochlear implants and brain plasticity. Hear Res. 2008;238(1-2):110-7. PMid:17910997. http://dx.doi.org/10.1016/j. heares.2007.08.004.
5. Kraus N, McGee T. Potenciais auditivos evocados de longa latência. In: Katz J. Tratado de audiologia clínica. 4. ed. São Paulo: Manole; 2002. p. 403-20.
6. Hall JW. New handbook of auditory evoked responses. Boston: Allyn & Bacon; 2006.
7. Datta H, Shafer VL, Morr ML, Kurtzberg D, Schwartz RG. Electrophysiological indices of discrimination of long-duration, phonetically similar vowels in children with typical and atypical language development. J Speech Lang Hear Res. 2010;53(3):757-77. PMid:20530387. http://dx.doi.org/10.1044/1092-4388(2009/08-0123).
8. Tremblay K, Kraus N, McGee T, Ponton C, Brian O. Central auditory plasticity: changes in the N1-P2 complex after speech-sound training. Ear Hear. 2001;22(2):79-90. PMid:11324846. http://dx.doi.org/10.1097/00003446-200104000-00001.
9. Sharma A, Nash AA, Dorman MF. Cortical development, plasticity and re-organization in children with cochlear implants. J Commun Disord. 2009;42(4):272-9. PMid:19380150. http://dx.doi.org/10.1016/j. jcomdis.2009.03.003.
10. Kabel AH, Mesallam T, Ghandour HH. Follow up of P1 peak amplitude and peak latency in a group of specific language-impaired children. Int J Pediatr Otorhinolaryngol. 2009;73(11):1525-31. PMid:19709759. http:// dx.doi.org/10.1016/j.ijporl.2009.07.008.
11. Wunderlich JL, Cone-Wesson BK. Maturation of CAEP in infants and children: a review. Hear Res. 2006;212(1-2):212-23. PMid:16480841. http://dx.doi.org/10.1016/j.heares.2005.11.008.
12. Albrecht R, Suchodoletz W, Uwer R. The development of auditory evoked dipole source activity from childhood to adulthood. Clin Neurophysiol. 2000;111(12):2268-76. PMid:11090781. http://dx.doi.org/10.1016/S1388-2457(00)00464-8.
14. Ceponiene R, Lepisto T, Alku P, Aro H, Naatanen R. Event related potential indices of auditory vowel processing in 3-year-old children. Clin Neurophysiol. 2003;114(4):652-61. PMid:12686274. http://dx.doi. org/10.1016/S1388-2457(02)00436-4.
15. Sussman E, Steinschneider M, Gumenyuk V, Grushko J, Lawsond K. The maturation of human evoked brain potentials to sounds presented at different stimulus rates. Hear Res. 2008;236(1-2):61-79. PMid:18207681. http://dx.doi.org/10.1016/j.heares.2007.12.001.
16. King KA, Campbell J, Sharma A, Martin K, Dorman M, Langran J. The representation of voice onset time in the cortical auditory evoked potentials of young children. Clin Neurophysiol. 2008;119(12):2855-61. PMid:18980862. http://dx.doi.org/10.1016/j.clinph.2008.09.015. 17. Lippé S, Martinez-Montes E, Arcand C, Lassonde M. Electrophysiological
study of auditory development. Neuroscience. 2009;164(3):1108-18. PMid:19665050. http://dx.doi.org/10.1016/j.neuroscience.2009.07.066. 18. Shafer VL, Yu YH, Wagner M. Maturation of cortical auditory evoked
potentials (CAEPs) to speech recorded from frontocentral and temporal sites: three months to eight years of age. Int J Psychophysiol. 2015;95(2):77-93. PMid:25219893. http://dx.doi.org/10.1016/j.ijpsycho.2014.08.1390. 19. Silva LAF. Maturação cortical em crianças usuárias de implante coclear:
análise das medidas eletrofisiológicas e comportamentais [dissertação]. São Paulo: Faculdade de Medicina, Universidade de São Paulo; 2015. 98 p.
20. Silva LAF, Couto MIV, Magliaro FCL, Tsuji RK, Bento RF, Carvalho ACM, et al. Cortical maturation in children with cochlear implants: correlation between electrophysiological and behavioral measurement. PLoS One. 2017; 12(6): e0178341. https://doi.org/10.1371/journal.pone.0178341. 21. Bisiacchi PS, Mento G, Suppiej A. Cortical auditory processing in preterm
newborns: an ERP study. Biol Psychol. 2009;82(2):176-85. PMid:19631252. 22. Choudhury N, Benasich AA. Maturation of auditory evoked potentials
from 6 to 48 months: prediction to 3 and 4 year language and cognitive abilities. Clin Neurophysiol. 2011;122(2):320-38. PMid:20685161. http:// dx.doi.org/10.1016/j.clinph.2010.05.035.
23. Benasich AA, Choudhury N, Friedman JT, Realpe-Bonilla T, Chojnowska C, Gou Z. The infant as a prelinguistic model for language learning impairments: Predicting from event-related potentials to behavior.
Neuropsychologia. 2006;44(3):396-411. PMid:16054661. http://dx.doi. org/10.1016/j.neuropsychologia.2005.06.004.
24. Purdy SC, Sharma M, Munro KJ, Morgan CL. Stimulus level effects on speech-evoked obligatory cortical auditory evoked potentials in infants with normal hearing. Clin Neurophysiol. 2013;124(3):474-80. PMid:23117114. http://dx.doi.org/10.1016/j.clinph.2012.09.011.
25. Gilley PM, Sharma A, Dorman MF, Martin K. Developmental changes in refractoriness of the cortical auditory evoked potential. Clin Neurophysiol. 2005;116(3):648-57. PMid:15721079. http://dx.doi.org/10.1016/j. clinph.2004.09.009.
26. Sharma A, Campbell J, Cardon G. Developmental and cross-modal plasticity in deafness: evidence from the P1 and N1 event related potentials in cochlear implanted children. Int J Psychophysiol. 2015;95(2):135-44. PMid:24780192. http://dx.doi.org/10.1016/j.ijpsycho.2014.04.007. 27. Eggermont JJ, Ponton CW. Auditory-evoked potential studies of cortical
maturation in normal hearing and implanted children: correlations with changes in structure and speech perception. Acta Otolaryngol. 2003;123(2):249-52. PMid:12701751. http://dx.doi.org/10.1080/0036554021000028098. 28. Kihara M, Hogan AM, Newton CR, Garrashi HH, Neville BR, Haan M.
Auditory and visual novelty processing in normally-developing Kenyan children. Clin Neurophysiol. 2010;121(4):564-76. PMid:20080442. http:// dx.doi.org/10.1016/j.clinph.2009.11.086.
29. Ponton CW, Eggermont JJ, Kwong B, Don M. Maturation of human central auditory system activity: evidence from multi-channel evoked potentials. Clin Neurophysiol. 2000;111(2):220-36. PMid:10680557. http://dx.doi. org/10.1016/S1388-2457(99)00236-9.
Author contributions