CLINICAL SCIENCE
Pharmacokinetics of cyclosporin - a microemulsion in
children with idiopathic nephrotic syndrome
Luciana dos Santos Henriques, Fabı´ola de Marcos Matos, Maria Helena Vaisbich
Faculdade de Medicina da Universidade de Sa˜o Paulo, Instituto da Crianc¸a, Sa˜o Paulo/SP, Brazil.
OBJECTIVE: We present a prospective study of a microemulsion of cyclosporin to treat idiopathic nephrotic syndrome in ten children with normal renal function who presented cyclosporin trough levels between 50 and 150 ng/ml and achieved complete remission with cyclosporin. To compare the pharmacokinetic parameters of cyclosporin in idiopathic nephrotic syndrome during remission and relapse of the nephrotic state.
METHOD: The pharmacokinetic profile of cyclosporin was evaluated with the 12-hour area under the time-concentration curve (auc0-12) using seven time-point samples. This procedure was performed on each patient during remission and relapse with the same cyclosporin dose in mg/kg/day. The 12-hour area under the time-concentration curve was calculated using the trapezoidal rule. All of the pharmacokinetic parameters and the resumed 4-hour area under the concentration curve were correlated with the 12-hour area under the time-concentration curve. ClinicalTrials.gov: NCT01616446.
RESULTS: There were no significant differences in any parameters of the pharmacokinetic of cyclosporin during remission and relapse, even when the data were normalized by dose. The best correlation with the 12-hour area under the time-concentration curve was the 4-hour area under the time-concentration curve on remission and relapse of the disease, followed by the 2-hour level after cyclosporin (c2) dosing in both disease states.
CONCLUSIONS: These data indicate that the same parameters used for cyclosporin therapeutic monitoring estimated during the nephrotic state can also be used during remission. Larger controlled studies are needed to confirm these findings.
KEYWORDS: Cyclosporin-A; Nephrotic Syndrome; Children; Pharmacokinetics; Area Under Curve.
Henriques LS, Matos FM, Vaisbich MH. Pharmacokinetics of cyclosporin - a microemulsion in children with idiopathic nephrotic syndrome. Clinics. 2012;67(10):1197-1202.
Received for publication onMarch 19, 2012;First review completed onMay 7, 2012;Accepted for publication onJune 20, 2012 E-mail: [email protected]
Tel.: 55 11 2661-8500
INTRODUCTION
Idiopathic nephrotic syndrome (INS) is characterized by heavy proteinuria (urinary protein above 50 mg/kg/day), hypoalbuminemia (serum albumin below 2.5 g/dl), edema, and hyperlipidemia; the syndrome occurs mainly in children. It is generally classified as steroid-sensitive nephrotic syndrome (SSNS) and steroid-resistant nephrotic syndrome (SRNS), according to the patient’s response to therapy. Most patients respond to steroid therapy and show a favorable outcome. However, 10–20% of patients fail to respond and may progress to end-stage renal failure (1). Children who fail to respond to steroids or become steroid-dependent (SDNS) may be treated with immunosuppres-sive agents. This group of patients continues to pose a therapeutic challenge. There is considerable diversity in the
use of immunosuppressive drugs, with differences in com-binations, administration modes, and regimens. However, in children, there is a lack of evidence regarding the best schedule that should be adopted (2,3). The optimal strategies with the least toxicity remain to be determined (4). Cyclosporin A (CSA), a calcineurin inhibitor immunosup-pressive agent, has been widely used to treat with SRNS and SDNS patients. Studies have shown that CSA is effective in inducing remission in patients with SRNS and SDNS with toxicity steroid signs (2,5-7). However, CSA is associated with a high rate of relapse after its withdrawal, nephrotoxicity, and CSA dependence (8).
CSA can reduce proteinuria by immunological and non-immunological mechanisms. The best-understood mechanism involved in CSA-mediated immunosuppression consists of inhibiting cytokine synthesis, particularly interleukin-2 (IL-2) and its IL-2R receptor (9). CSA and the cyclophilin complex bind to and inhibit calcineurin activity toward phosphorylated proteins. Consequently, the cytosolic nuclear factors of activated T-lymphocyte (NFATs) cannot be dephosphorylated to enter the cell nucleus, where they bind to both the Fos and Jun family proteins and the distal IL-2 promoter NFAT site to facilitate gene transcription (10). The non-immunological CSA Copyrightß2012CLINICS– This is an Open Access article distributed under
the terms of the Creative Commons Attribution Non-Commercial License (http:// creativecommons.org/licenses/by-nc/3.0/) which permits unrestricted non-commercial use, distribution, and reproduction in any medium, provided the original work is properly cited.
mechanisms that are involved in reducing proteinuria are the reduction in the glomerular filtration rate, which leads to a decreased filtered load of protein, and the reduction of the permeability of the glomerular capillary wall for albumin (11). In addition, CSA has been shown to directly decrease the synaptopodin degradation rate and to stabilize the podocyte (12).
It is well known that the CSA has a narrow therapeutic window (13,14). In clinical practice, the pharmacokinetic (PK) profile can provide an indicator of the appropriate CSA dose to obtain an efficient effect and to try to avoid adverse events (15).
Therefore, it is recommended that therapeutic drug monitoring (TDM) be used to determine adequate dosing (8). Nevertheless, most studies have been performed on adults and organ transplant recipients. General guidelines for dosage administration and therapeutic monitoring in nephrotic syndrome [NS] are still needed, particularly for children (14).
Many factors can influence the cyclosporin PK profile (CSA-PK), and there is almost no information regarding whether there are changes in CSA-PK during the remission and relapse periods of the NS. Edema, metabolic changes in the gastrointestinal tract, and changes in hepatic metabolism and drug volume distribution could contribute to a different PK profile during these two diverse states of the NS. If this is so, then different TDM might be necessary during each of these periods. Furthermore, it is important to find a drug that is effective and safe (13,16).
This study aimed to verify the possible differences in the CSA-PK parameters in nephrotic children during both the remission and relapse periods of the NS and to try to find the best point in the area under the time-concentration curve (AUC) that correlates with the 12-hour area under the time-concentration curve (AUC0-12) in both states.
MATERIALS AND METHODS
This was a prospective study of children with INS who were followed in the Pediatric Nephrology Unit of the Instituto da Crianc¸a -HCFMUSP. The study included children who were diagnosed with SRNS and SDNS, who were prescribed CSA to treat INS, and who once achieved complete remission with CSA according to the guidelines of the International Society of Kidney Diseases in Children (ISKDC); the inclusion criteria included normal renal function as evaluated by creatinine clearance estimated by stature (17) $90 ml/min/1.73 m2, with CSA trough levels (C0) between 50 and 150 ng/ml (1). We decided to adopt this value range for C0 because in most reports of CSA treatment in children with INS, the CSA trough levels are maintained between 50 and 120 ng/mL (2,7). All of the patients were subjected to renal biopsies before the CSA introduction. The exclusion criteria were renal and hepatic function abnormalities, the presence of infectious disease, clinical or histological signs of CSA nephrotoxicity, and suspicions of non-compliance.
In this study, the definitions and criteria of ISKDC were adopted in relation to NS, remission and relapse (1).
The patients were evaluated weekly in the first month and monthly thereafter. The following exams were performed: urinalysis, 24-hour proteinuria, hematological counts, serum creatinine, cholesterol and triglycerides, serum protein and albumin levels, and liver enzymes. The patients received
along with prednisone to induce remission, according to the ISKDC guidelines (1).
The study was approved by the Local Ethics Committee, and the parents signed informed consent documents before the children were enrolled in the study.
Pharmacokinetics
We performed CSA-PK evaluations in patients who fulfilled the inclusion criteria. The procedure was evaluated through the 12-hour area under the time-concentration curve (AUC0–12). The patients were required to take their
evening CSA dose at 7 pm on the previous day and to fast after an early dinner. They were kept in observation on the following day. The CSA trough level was collected at 7 am immediately before the patients received their morning doses of CSA, and the time-concentration curve collection began. The PK studies consisted of collecting whole blood samples through peripheral venous access before (trough level or C0) and 1, 2, 4, 6, 8, and 12 hours after the drug administration (C1, C2, C4, C6, C8, and C12, respectively). On the same day, the hematological count and the serum creatinine, cholesterol, albumin, and 24-hour proteinuria and creatinine clearance levels were collected.
The same procedure was performed for each patient during the remission and relapse periods with the same dose of CSA (mg/kg/day). The PK studies were performed at least 72 hours after the introduction the drug or after the dose modification if the C0 reached 50-150 ng/ml.
Relapse was defined as the presence of proteinuria .50 mg/kg/day. Remission was defined as proteinuria ,5 mg/kg/day and serum albumin.2.5 g/dl (1). The PK study was performed at least four days after the character-ization of the remission or relapse periods.
The blood CSA concentration was measured with a monoclonal antibody fluorescence polarization immunoas-say using the Abbott TDxFLx cyclosporine monoclonal whole blood assay (18).
The AUCs were calculated using the trapezoidal rule. The C0 through C12 variables were used to calculate the AUC0-12,
and the C0, C1, C2, and C4 variables were used in the construction of the 4-hour area under the time-concentration curve (AUC0-4). Cmax was defined as the highest
concentra-tion and Tmax as the time to achieve Cmax.
The absolute PK parameters and the dose-normalized parameters were compared. In addition, the following variables were also analyzed upon remission and relapse: cholesterol, albumin, creatinine and hematocrit, creatinine clearance and 24-hour proteinuria. Finally, all points of the time-concentration curve were correlated with the AUC0-4and the AUC0-12, either
in absolute values or normalized by dose (mg/kg/day).
Statistical analysis
The data were expressed as means¡SD or as medians and ranges, when applicable. Parametric tests were employed because the data had normal distributions (according to the skewness and kurtosis coefficients). The different CSA-PK parameters (AUC0-12 and AUC0-4 between remission and relapse) were determined with a paired t-test (significance level p,0.05). The correlations between AUC0–12 and other points of the curve and the
resumed AUC0–4were determined by Pearson’s correlation
were performed for the cholesterol and serum albumin levels.
RESULTS
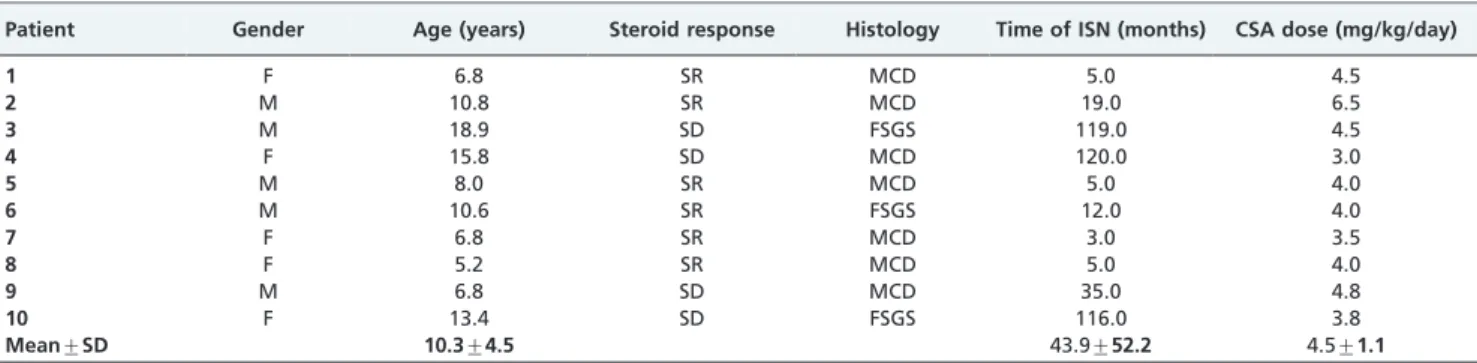
Ten children (mean age at presentation 3.0¡1.6 years) were enrolled in the study; none had a history of familial nephrotic syndrome. Table 1 outlines the characteristics of the group. In patients with SRNS, CSA was introduced 8.2¡5.6 months after presentation. In SDNS patients, the introduction occurred after 8.1¡3.4 years. This difference was because intravenous cyclophosphamide is the first option used in the clinic to treat children with SDNS. During remission, the patients were placed on prednisone, and five patients received the calcium-channel blocker amlodipine; four children received an H2 blocker. During relapse, eight patients were receiving prednisone; six patients were on amlodipine and four on H2 blocker.
Table 2 outlines all of the blood tests performed (serum albumin, hematocrit, cholesterol and creatinine) and the 24-hour proteinuria of the patients during remission and relapse. The NS is well demonstrated in these two distinct phases. Proteinuria, serum albumin and serum cholesterol are significantly different between these two periods (as required by the protocol). There was no significant dif-ference between the creatinine clearances estimated by stature during remission (191.4¡52.1 ml/min/1.73 m2 BS) and relapse (256.9¡163.9 ml/min/1.73 m2BS) (p= 0.24).
During remission and relapse, we could not observe a significant correlation either between cholesterol and AUC0-12
(r -0.26 and r -0.28, respectively), C2 (r 0.03 and r -0.13, respectively) or between albumin and 24-hour proteinuria. In this study, we did not observe any differences between CSA-AUC0-12 during remission (3324¡1094 ng.h/ml) and
relapse (3340¡880 ng.h/ml) (p = 0.96). There was also no significant difference between the resumed 4-hour area under the time-concentration curve (AUC0-4) (p = 0.98) during
remission (1985¡623 ng.h/ml) and relapse (1982¡631 ng.h/ ml). The same result applied when the data were normalized by dose. We did not observe any differences between the CSA-AUC0-12 (p= 0.84) and the CSA-AUC0-4 (p= 0.88) during
remission (1538¡517 ng.h/ml and 925¡304 ng.h/ml, respec-tively) and relapse (1574¡602 ng.h/ml and 925¡458 ng.h/ ml, respectively). Figure 1 illustrates the PK curve during remission and relapse. Note that the mean concentration is similar for all time points, causing the two curves cover each other.
Table 3 shows the only patient who exhibited Cmax in the 4th hour (patient 8, during remission). The other patients
presented Cmax in either the 1st or 2nd hour. Tmax was 1.8¡0.9 h (median = 2) during remission and 1.5¡0.5 h (median = 1.5) during relapse.
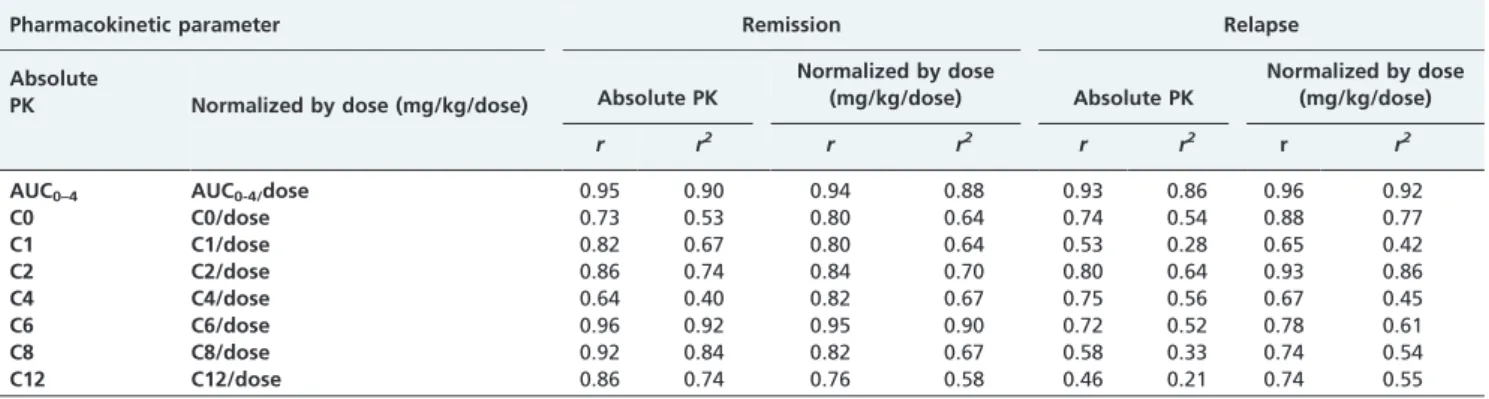
When the correlations were analyzed between all of the CSA-PK parameters and AUC0–12, both in absolute number
and normalized by dose, only the C2 and AUC0–4 had
reasonable correlation indices (r/r2) either for the absolute CSA-PK parameters or for the CSA-PK parameters normal-ized by dose. Specifically, the correlations identified were as follows: 0.86/0.74 and 0.95/0.90 for the absolute CSA-PK parameters on remission, 0.80/0.64 and 0.93/0.86 on relapse for C2 and AUC0–4, respectively, 0.84/0.70 and 0.94/0.88 on
remission for the CSA-PK parameters normalized by dose, and 0.93/0.86 and 0.96/0.92 on relapse for C2 and AUC0–4,
respectively (Table 4).
DISCUSSION
It is likely that the inter- and intraindividual variabilities in CSA-PK and the dose requirements are even larger in children than in adults because of the variation in biological maturation (14,19). To achieve comparable exposures, children require higher relative CSA doses compared to adults. Such differences are mainly caused by shorter intestinal surface absorption and a higher metabolic rate for CSA in children (14,16,19-22). Therefore, adult studies cannot be applied to children.
Table 1 -Characteristics of the 10 INS patients.
Patient Gender Age (years) Steroid response Histology Time of ISN (months) CSA dose (mg/kg/day)
1 F 6.8 SR MCD 5.0 4.5
2 M 10.8 SR MCD 19.0 6.5
3 M 18.9 SD FSGS 119.0 4.5
4 F 15.8 SD MCD 120.0 3.0
5 M 8.0 SR MCD 5.0 4.0
6 M 10.6 SR FSGS 12.0 4.0
7 F 6.8 SR MCD 3.0 3.5
8 F 5.2 SR MCD 5.0 4.0
9 M 6.8 SD MCD 35.0 4.8
10 F 13.4 SD FSGS 116.0 3.8
Mean¡SD 10.3¡4.5 43.9¡52.2 4.5¡1.1
F: female; M: male; SR: steroid-resistant; SD: steroid-dependent; MCD: minimal change disease; FSGS: focal and segmental glomerulosclerosis; NS: nephrotic syndrome; CSA: cyclosporine.
Table 2 -Nephrotic Syndrome parameters evaluated during remission and relapse.
Variable
Relapse X¡DP Median (range)
Remission X¡DP
Median (range) p-value
Proteinuria (mg/kg/day)
126.1¡58.4* 54.4-220.0
1.8¡2.0* 0.0-6.0
0.0001
Serum Albumin (g/dl)
2.1¡0.9* 0.8-3.5
3.9¡0.5* 3.2-4.8
0.0001
Cholesterol (mg/dl)
344.2¡107.7* 151.0-493.0
209.7¡64.3* 136.0-355.0
0.001
SCr (mg/dl)
0.36¡0.18NS 0.10-0.61
0.39¡0.15NS 0.23-0.64
0.36
CrCl
(ml/min/1,73m2)
256.9¡163.9NS 134-632
191.4¡52.1NS 115-243
0.24
Hematocrit 38.7¡3.8NS 32.9-44.3
38.6¡5.1NS 30.6-48.9
0.96
*
In addition, it is unclear whether abnormalities observed during relapse of the NS are able to interfere with its CSA-PK or if the abnormalities could influence the drug prescription (13). Some studies have suggested that edema, hypoproteinemia, and hypercholesterolemia are involved in CSA bioavailability and clearance (13,16). Hypercholes-terolemia is particularly important in CSA-PK because the drug is highly lipophilic and binds to blood cells and plasma proteins; the relative distribution depends on the temperature, drug concentration, hematocrit, and plasma lipoproteins (23).
Therefore, in particular, this study attempts to verify the potential differences in the CSA-PK parameters between nephrotic children during remission and relapse of the disease. We employed AUC0-12as a gold standard because
this parameter has been considered the most reliable. However, it is an invasive method that requires the col-lection of several blood samples, and it cannot be applied in clinical practice (20,22).
For years, CSA trough levels (C0) have been widely used to monitor CSA dosing (14,21,24). Since the development of Neoral, a micro-emulsified formulation, the bioavailability of CSA has increased, while inter- and intraindividual variabilities have improved remarkably and a new strategy for monitoring CSA was introduced, though mainly in post-transplant adult patients (25).
In several adult reports, C2 has been correlated better than C0 or other time points to the AUC0-12, particularly in
transplant patients (26). However, an important random trial involving cadaveric kidney recipients compared C0
and C2 in the first three weeks post-transplant and revealed no advantages in C2 monitoring, although it led to significantly higher CSA doses and blood levels than the C0 monitoring (27). Other reports have considered AUC0–4a
reliable parameter for Neoral dose monitoring in organ transplant patients (25). AUC0–4 was found to correlate
better with clinical effects in kidney and liver transplant recipients (28). Many reports of transplanted adults have shown that C2 was the best point of correlation with AUC0–4
and that C0 does not exhibit the same behavior (14,21,29). One report found a correlation coefficient between C2 and AUC0–4that varied from 0.67 to 0.85 (30).
In transplanted children, C2 has been considered a reliable marker of acute rejection (7). A study of renal transplantation in children reported a good correlation between AUC0–4,
C1.25, and C2 with AUC0–12, which was not observed with
C0 (14).
Therefore, several studies have suggested C2 as a reliable parameter to be used in transplant patients (adults and children); however, there is no consensus for INS (16), particularly in children (21). The efficacy of C2 as a parameter to fit the CSA dosage and its correlation with AUC0–4is still
uncertain (21). Nozu et al. (21) reported a late absorption peak in 33% of the patients (3–4 hours after drug adminis-tration), which supports the wide interindividual variability in the CSA PK profile.
Note that the CSA blood concentration is directly related to its potency and the duration of the calcineurin inhibition effect (19,31,32). Longer calcineurin inhibition and, conse-quently, longer inhibition of IL-2 production are known to occur during the first 2 hours after CSA administration (14). However, it is a limited strategy for measuring the actual effectiveness of its immunosuppressive action. Currently, pharmacodynamic studies show the real biological effects of the drug (33,34). In addition, polymorphisms in the CYP3A5 and ABCB1 genes have been investigated as modulators of the pharmacokinetic and clinical effects of CSA in Brazilian renal transplant recipients (35).
In this study, the patients received CSA dosages to achieve C0 between 50 and 150 ng/ml in the outpatient clinic evaluation; the patients were then hospitalized, and the blood collections were performed on remission and relapse, while maintaining the same dosage (mg/kg) in both situations. We prefer to employ C0 as an inclusion criterion because a fixed dose could have inter- and intraindividual variability, which is characteristic of CSA. In this protocol,
Figure 1 -AUC0-12 during remission and relapse of INS.
Table 3 -CSA-PK parameters in 10 INS patients during remission and relapse.
CASO
C0 (ng/ml)
C1 (ng/ml)
C2 (ng/ml)
C4 (ng/ml)
C6 (ng/ml)
C8 (ng/ml)
C12 (ng/ml)
R r R r R r R r R r R r R r
1 116 69 574 358 646 250 412 121 237 93 174 122 98 85
2 114 87 1038 1018 976 708 389 427 314 224 292 179 173 89
3 64 137 613 405 767 730 324 495 181 314 90 209 65 109
4 75 110 621 1204 435 1089 278 247 169 200 101 142 99 93
5 96 57 373 437 490 644 350 239 164 111 121 71 74 42
6 98 76 483 475 453 408 237 253 128 220 83 126 51 72
7 45 59 623 464 728 562 268 248 124 224 51 165 25 110
8 51 63 221 923 234 516 413 378 153 189 91 83 49 52
9 74 111 838 869 808 777 252 406 188 232 135 152 77 93
10 154 112 781 123 908 1131 261 376 348 226 231 163 128 113
we were unable to detect a significant difference of the INS between remission and relapse in the following pharmaco-kinetics parameters: AUC0–12, AUC0–4, or in all points of the
curve (C0, C1, C2, C4, C6, C8, or C12). In addition, we were unable to demonstrate a significant influence on the serum levels of cholesterol, albumin or hematocrit and proteinuria on the pharmacokinetics of CSA; the study has shown no significant correlations between these variables and AUC0–12,
AUC0–4, and all points of the curve during remission or
relapse. Therefore, in our study, we could not detect a significant difference between AUC0–12, AUC0–4, and all
points of the curve in the same children during remission and relapse, suggesting that there is no necessity to change the dose when the patient is in relapse or remission.
Medeiros et al. (16) studied seven children with SRNS during remission and relapse, employed a fixed dosage of CSA (6 mg/kg/day), and reported lower CSA exposure during remission, suggesting that the target area under the curve was not the same in both conditions and that a higher dosage could be necessary on relapse. Unfortunately, this study included patients in partial remission of the disease (four cases), which can influence the conclusions.
A similar study conducted with puromycin aminonucleo-side-induced nephrotic rats showed a higher drug exposure during relapse, as evaluated by AUC0–12. This study also
observed a positive correlation of AUC0–12with cholesterol
levels and negative correlations with CSA clearance and with its distribution volume (13). However, it is important to note that this was an experimental study conducted under ideal conditions; therefore, the findings cannot be directly applied to clinical practice (13).
Our study has shown that AUC0–4was the main point in
both the remission and relapse states of the disease when compared to AUC0–12(r= 0.95 on remission andr= 0.93 on
relapse) and that C2 was the second parameter identified (r= 0.86 on remission andr= 0.80 on relapse). Other CSA-PK points had good correlation with AUC0–12during remission;
however, this correlation was not observed on relapse. In our study, C2 was the point with a higher correlation with AUC0–4during remission and relapse (r= 0.98 on remission
andr= 0.83 on relapse).
We have observed that C2 appears to be the more adequate parameter to fit CSA dosage in nephrotic children during remission, relapse, and AUC0-4. However, we did
not take into account the concomitant drugs used by the patients, such as steroids, calcium-channel blockers, or H2
blockers. We must also emphasize that we could not be certain of the exact time of the drug administration on the previous day. Furthermore, the study used a small sample size, and it was heterogeneous.
Finally, larger prospective controlled studies should be conducted to reproduce these findings and to verify the target value of C2 to continue remission with less toxicity in INS. This important study of CSA-PK in INS in childhood during remission and relapse demonstrated that it is not necessary to change the dosage of CSA in both states; we considered the same reference values in both states.
ACKNOWLEDGMENTS
This study was financially supported by the Fundac¸a˜o de Amparo a` Pesquisa do Estado de Sa˜o Paulo (FAPESP - 2012/12285-7).
AUTHOR CONTRIBUTIONS
Henriques LS contributed to the data collection, review of the literature, statistical analysis, and drafting of the manuscript. Matos FM contributed to the data collection. Vaisbich MH contributed to the data collection, statistical analysis, and final review of the manuscript.
REFERENCES
1. International Study of Kidney Disease in Childreen. The primary nephrotic syndrome in children. Identification of patients with minimal change nephrotic syndrome from initial response to prednisone. J Pediatr. 1981;98(4):561-4.
2. Cattran DC, Alexopoulos E, Heering P, Hoyer PF, Johnston A, Meyrier A, et al. Cyclosporin in idiopathic glomerular disease associated with the nephrotic syndrome: workshop recommendations. Kidney Int. 2007;72(12):1429-47, http://dx.doi.org/10.1038/sj.ki.5002553.
3. Manrique-Rodrı´guez S, Fernandez-Llamazares C, Sanjurjo-Saez M. Pharmacotherapeutic review and uptade of idiopathic nephrotic syndrome in children. Pharm World Sci. 2010;32(3):314-21, http:// dx.doi.org/10.1007/s11096-010-9380-2.
4. Del Rio M, Kaskel F. Evaluation and management of steroid-unrespon-sive nephrotic syndrome. Curr Opin Pediatr. 2008;20(2):151-6, http:// dx.doi.org/10.1097/MOP.0b013e3282f4e6e4.
5. Eddy AA, Symons JM. Nephrotic syndrome in childhood. Lancet. 2003;362(9384):629-39, http://dx.doi.org/10.1016/S0140-6736(03)14184-0. 6. Su¨megi V, Haszon I, Bereczki C, Papp F, Tu´ri S. Long-term follow-up after cyclophosphamide and cyclosporine-A therapy in steroid-depen-dent and -resistant nephrotic syndrome. Pediatr Nephrol. 2008; 23(7):1085-92, http://dx.doi.org/10.1007/s00467-008-0771-8.
7. Rinaldi S, Sesto A, Barsotti P, Faraggiana T, Sera F, Rizzoni G. Cyclosporine therapy monitored with abbreviated area under curve in nephrotic syndrome. Pediatr Nephrol. 2005;20(1):25-9, http:// dx.doi.org/10.1007/s00467-004-1618-6.
8. El-Husseini A, El-Basuony F, Mahmoud I, Sheashaa H, Sabry A, Hassan R, et al. Long-term effects of cyclosporine in children with idiopathic nephrotic syndrome: a single-centre experience. Nephrol Dial Transplant. 2005;20(11):2433-8, http://dx.doi.org/10.1093/ndt/gfi059. Table 4 -Correlation between all pharmacokinetic parameters and AUC0-4with AUC0-12during remission and relapse of the nephrotic syndrome, expressed as absolute values or normalized by dose (mg/kg).
Pharmacokinetic parameter Remission Relapse
Absolute
PK Normalized by dose (mg/kg/dose) Absolute PK
Normalized by dose
(mg/kg/dose) Absolute PK
Normalized by dose (mg/kg/dose)
r r2
r r2
r r2 r
r2
AUC0–4 AUC0-4/dose 0.95 0.90 0.94 0.88 0.93 0.86 0.96 0.92
C0 C0/dose 0.73 0.53 0.80 0.64 0.74 0.54 0.88 0.77
C1 C1/dose 0.82 0.67 0.80 0.64 0.53 0.28 0.65 0.42
C2 C2/dose 0.86 0.74 0.84 0.70 0.80 0.64 0.93 0.86
C4 C4/dose 0.64 0.40 0.82 0.67 0.75 0.56 0.67 0.45
C6 C6/dose 0.96 0.92 0.95 0.90 0.72 0.52 0.78 0.61
C8 C8/dose 0.92 0.84 0.82 0.67 0.58 0.33 0.74 0.54
C12 C12/dose 0.86 0.74 0.76 0.58 0.46 0.21 0.74 0.55
r: Pearson’s correlation coefficient;r:2
9. Briggs WA, Gao ZH, Xing JJ, Scheel PJ, Gimenez LF, Samaniego MD, et al. Suppression of dialysis patients’ lymphocyte IL-2R expression by glucocorticoids and cyclosporine. Cytokine. 1997;9(8):624–8, http:// dx.doi.org/10.1006/cyto.1997.0210.
10. Resch K, Szamel M. Molecular mechanisms of the immunosuppressive action of cyclosporin A. Int J Immunopharmacol. 1997;19(9–10):579–85. 11. Desassis JF, Raats CJ, Bakker MA, van den Born J, Berden JH.
Antiproteinuric effect of ciclosporin A in adriamycin nephropathy in rats. Nephron. 1997;75(3):336–41, http://dx.doi.org/10.1159/000189558. 12. Faul C, Donnelly M, Merscher-Gomez S, Chang YH, Franz S, Delfgaauw J, et al. The actin cytoskeleton of kidney podocytes is a direct target of the antiproteinuric effect of cyclosporine A. Nat Med. 2008;14(9):931-8. 13. Medeiros M, Pe´rez-Urizar J, Pedraza-Chaverri J, Mun˜oz-Arizpe R,
Castan˜eda-Herna´ndez G. Increased cyclosporine bioavailability induced by experimental nephrotic syndrome in rats. Can J Physiol Pharmacol. 2007;85(5):502-6, http://dx.doi.org/10.1139/Y07-025.
14. Weber LT, Armstrong VW, Shipkova M, Feneberg R, Wiesel M, Mehls O, et al. Cyclosporin A absorption profiles in pediatric renal transplant recipients predict the risk of acute rejection. Ther Drug Monit. 2004;26(4):415-24, http://dx.doi.org/10.1097/00007691-200408000-00012. 15. Britto ZM, David-Neto E, Lemos FC, Pereira LM, Castro MC, Fonseca JA´ , et al. Identifying cyclosporine blood levels associated with the preven-tion of renal transplant rejecpreven-tion: a single-center, randomized prospective study. Transplant Proc. 2004;36(9):2649-55, http://dx.doi.org/10.1016/ j.transproceed.2004.10.015.
16. Medeiros M, Pe´rez-Urizar J, Mejı´a-Gaviria N, Ramı´rez-Lo´pez E, Castan˜eda-Herna´ndez G, Mun˜oz R. Decreased cyclosporine exposure during the remission of nephrotic syndrome. Pediatr Nephrol. 2007;22(1):84-90, http://dx.doi.org/10.1007/s00467-006-0300-6. 17. Schwartz GJ, Brion LP, Spitzer A. The use of plasma creatinine
concentration for estimating glomerular filtration rate in infants, children and adolescents. Pediatr Clin North Am. 1987;34(3):571-90.
18. Abbott Laboratories. TDxFLx cyclosporine monoclonal whole blood. Package insert 9797-60 E 34-0060/R7 2001:1-6 Abbott Laboratories Abbott Park, IL.
19. Naito M, Takei T, Eguchi A, Uchida K, Tsuchiya K, Nitta K. Monitoring of blood cyclosporine concentration in steroid-resistant nephrotic syndrome. Intern Med. 2008;47(18):1567-72, http://dx.doi.org/10.2169/ internalmedicine.47.1088.
20. Faulds D, Goa KL, Benfield P. Cyclosporin – a review of its pharmacodynamic and pharmacokinetic properties, and therapeutic use in immunoregulatory disorders. Drugs. 1993;45(6):953-1040, http:// dx.doi.org/10.2165/00003495-199345060-00007.
21. Nozu K, Iijima K, Sakaeda T, Okumura K, Nakanishi K, Yoshikawa N, et al. Cyclosporin A absorption profiles in children with nephrotic syndrome. Pediatr Nephrol. 2005;20(7):910-3, http://dx.doi.org/ 10.1007/s00467-005-1844-6.
22. Dello Strologo L, Campagnano P, Federici G, Rizzoni G. Cyclosporine A monitoring in children: abbreviated area under curve formulas and C2 level. Pediatr Nephrol. 1999;13(2):95-7, http://dx.doi.org/10.1007/s004670050570.
23. Von Ahsen N, Helmhold M, Schu¨tz E, Eisenhauer T, Armstrong VW, Oellerich M. Cyclosporin A trough levels correlate with serum lipoproteins and apolipoproteins: implications for therapeutic drug monitoring of cyclosporin A. Ther Drug Monit. 1997;19(2):140–5. 24. Ishikura K, Ikeda M, Hattori S, Yoshikawa N, Sasaki S, Iijima K, et al.
Effective and safe treatment with cyclosporine in nephrotic children: a prospective, randomized multicenter Trial. Kidney Int. 2008;73(10):1167-73, http://dx.doi.org/10.1038/ki.2008.24.
25. Amante AJ, Kahan BD. Abbreviated area-under-the-curve strategy for monitoring cyclosporin microemulsion therapy in immediate posttrans-plant period. Clin Chem. 1996;42:1294-6.
26. Kalyoncu M, Topaloglu R, Bayrakci U, Bakkaloglu A, Besbas N, Ozaltin F, et al. Cyclosporine drug monitoring with C0 and C2 concentrations in children with stable renal allograft function. Pediatr Transplant. 2006;10(2):168-71, http://dx.doi.org/10.1111/j.1399-3046.2005.00436.x. 27. Kyllo¨nen LE, Salmela KT. Early cyclosporine C0 and C2 monitoring in de
novo kidney transplant patients: a prospective randomized single-center pilot study. Transplantation. 2006;81(7):1010-5, http://dx.doi.org/ 10.1097/01.tp.0000203306.72858.df.
28. Strong DK, Lai A, Primmett D, White CT, Lirenman DS, Carter JE, et al. Limited sampling strategy for cyclosporine (Neoral) area under the curve monitoring in pediatric kidney transplant recipients. Pediatr Transplant. 2005;9(5):566-73, http://dx.doi.org/10.1111/j.1399-3046.2005.00339.x.
29. Critterio F. Evolution of the therapeutic drug monitoring of cyclosporine. Trasnplant Proc. 2004;36:420-5, http://dx.doi.org/10.1016/j. transproceed.2004.01.054.
30. Nashan B, Cole E, Levy G, Thervet E. Clinical validation studies of Neoral C(2) monitoring: a review. Transplantation. 2002;73(9Suppl):S3-11, http://dx.doi.org/10.1097/00007890-200205151-00002.
31. Halloran PF, Helms LM, Kung L, Noujaim J. The temporal profile of calcineurin inhibition by cyclosporine in vivo. Transplantation. 1999;68(9):1356-61, http://dx.doi.org/10.1097/00007890-199911150-00023.
32. Kung L, Batiuk TD, Palomo-Pinon S, Noujaim J, Helms LM, Halloran PF. Tissue distribution of calcineurin and its sensitivity to inhibition by cyclosporine. Am J Transplant. 2001;1(4):325-33, http://dx.doi.org/ 10.1034/j.1600-6143.2001.10407.x.
33. Van Rossum HH, Fijter JW, Van Pelt J. Pharmacodynamic monitoring of calcineurin inhibition therapy: principles, performance, and perspec-tives. Ther Drug Monit. 2010;32:3-10, http://dx.doi.org/10.1097/ FTD.0b013e3181c0eecb.
34. Marquet P. Counterpoint: Is pharmacokinetic or pharmacodynamic monitoring of calcineurin inhibition therapy necessary? Clin Chem. 2010;56(5):736-9, http://dx.doi.org/10.1373/clinchem.2009.138693. 35. Santoro A, Felipe CR, Tedesco-Silva H, Medina-Pestana JO, Struchiner CJ,