AR
TICLE
1 Agência Nacional de Saúde Suplementar, Núcleo da ANS Rio de Janeiro. Av. Augusto Severo 84, Glória. 20021-040 Rio de Janeiro RJ Brasil.
[email protected] 2 Departamento de Administração e Planejamento em Saúde, Escola Nacional de Saúde Pública, Fundação Oswaldo Cruz.
The elderly and healthcare plans in Brazil:
analysis of the complaints received by the National Regulatory
Agency for Private Health Insurance and Plans
Abstract Although the Unified Healthcare Sys-tem provides universal coverage, about 25% of the population in Brazil has some form of private healthcare. Considering that the population is aging, the prevalence of chronic diseases and the high costs associated with healthcare, the goal of this study is to assess if the barriers to access and use of the services offered by healthcare plans, ex-pressed as beneficiary complaints, have a greater impact on the elderly than on adults and children. Transverse, exploratory study using a quantitative descriptive approach and secondary data provided by the ANS (the National Regulatory Agency for Private Health Insurance and Plans). This study analyzed complaints filed with the ANS by ben-eficiaries in the Southeast of Brazil between 2010 and 2012. The study population corresponded to 92,235 complaints. The elderly filed proportion-ately more complaints (60.8 vs. 25.5 complaints per 10 thousand beneficiaries). The most frequent (68.1%) complaints by the elderly were related to coverage. The results reinforce the idea that the organizational elements of private healthcare plans affect especially those groups most likely to use healthcare plans.
Keywords Healthcare system, Supplemental
Health, Elderly, Healthcare Plans, Service cover-age
Wilson Marques Vieira Junior 1
V
ie
ir
a J
unio
r
WM, Introduction
Although Brazilians have a constitutional right to a universal public healthcare system, govern-ment healthcare policies are responsible for the creation, consolidation and growth of private healthcare in Brazil. The State made polarized policy decisions. On the one hand, it provided the constitutional right to universal health on an equal basis to all citizens, but on the other, it contributed to consolidating a private healthcare industry that is economically important. The structure of the supplemental healthcare sector is the result of historical relationships between the State and private healthcare. Over time, the Bra-zilian healthcare industry has had varied public/ private compositions, depending on the prevail-ing healthcare policy. Yet State and private ser-vices have always intersected, and some serser-vices provided by private providers are heavily funded by the government1.
Therefore, this is a universal and integrated system, with a private system that is partially funded by services purchased by the State, and a segment of healthcare plan providers that have significant direct and indirect state incentive, constituting a barrier to universality and equal use of healthcare services2,3.
Added to this, we have the issue of an aging population. In most of the developed world, population aging was a gradual process that took place over decades and generations of almost constant socioeconomic growth4. In Brazil, aging
is an accelerated process. IBGE (the Brazilian In-stitute for Geography and Statistics) data shows that in 1960, the elderly made up 4.8% of the population, or about 3 million individuals. Fifty years later, the IBGE census showed 20.6 million elderly, or 10.7% of the population5. Estimates
indicate that by 2030 there will be 40.5 million elderly in Brazil, or 18.7% of the population. By 2050, the elderly will make up close to 29% of this country’s population6.
Given the situation of demographic transi-tion, which will result in a higher proportion of elderly in Brazil and the world, the impact of the aging population on the higher costs of health-care is being discussed. In Brazil, over 25% of the population has some type of private healthcare plan, and 11% of them are 60 years of age or older7. This is a population group with a range
of chronic diseases, and thus more likely to use healthcare services, and there is a greater risk that they will require more intensive and thus more expensive care.
The combination of demographic transition and increased use of healthcare services by the el-derly results in a projected increase in demand for services and spending, which in turn has caused concern regarding the sustainability of health-care services8-10. Given this scenario, studies on
the pattern of use of healthcare services by the elderly show that they use these services more, and that the elderly account for a large share of hospitalization spending11-16. However, some
au-thors question if the elderly are really the major source of higher healthcare system expenses. Re-inhardt17 believes that the key factors influencing
progressive growth of healthcare spending in the United States are related more to the use of new technologies, increased sector remuneration and asymmetric market distribution, giving health-care providers more bargaining power to set val-ues and prices.
Expansion of the private healthcare sector in Brazil has made this a consumer good. For most private healthcare companies, profitability in-cludes risk selection, which naturally exin-cludes the higher risk consumers, in particular the chron-ically ill and the elderly18. When it comes to risk
selection, it is fair to say that the elderly are not desired by healthcare plan operators, as they have more chronic diseases, use the services more and more often, and are more likely to require very costly treatments in the final years of their life.
In light of this, one recognizes that the re-lationship between the elderly and healthcare operators is a source of considerable tension. The elderly have problems purchasing health-care, due to either sales strategies or difficulties or constraints imposed, such as requiring med-ical reports or qualified interviews. There are also regulating mechanisms such as require-ments for authorizations or analysis of medical requests that make it harder to use the system. Although these constraints affect all groups, one may assume that they have a greater impact on the older population or on people with diseases whose treatment requires intense the use of ex-pensive technologies. Add to that the impact of adjustments to the monthly fee, which for older patients can be twice the cost of the same plan for younger people, and in some cases the elder-ly are just unable to keep up their payments and migrate to the SUS.
In addition to selecting clients and risks, operators use all of the mechanisms allowed in supplemental healthcare regulations to control demand and use of services19. In Brazil, managed
e C
ole
tiv
a,
20(12):3817-3826,
2015
the search for a better cost/effectiveness ratio and the rational use of services and inputs for each
treatment20. However, the range of mechanisms
applied by healthcare plan operators limits not only those services that are unnecessary, but also those that are necessary.
It would be reasonable to assume that this micro-regulation is exercised by operators more frequently with patients or groups at a higher risk of increasing the claims ratio. This mecha-nism to limit access creates dissatisfaction among beneficiaries when a given procedure is medical-ly indicated, yet they face denials, postponements or outright refusal by the healthcare plan21. The
main reasons for dissatisfaction with healthcare plans are related to the delay in scheduling office visits, restrictions imposed on treatments, ser-vices and tests, and price adjustments as a func-tion of age and geographic coverage22.
All of these together lead one to expect that the dissatisfaction of the elderly with such bad practices would be reflected in complaints made to the ANS. Regardless of whether or not a giv-en complaint actually infringes supplemgiv-ental health legislation, the complaint originates from an impasse, a dissatisfaction arising from a point of conflict between the healthcare plan and the beneficiary. Recognition of the field of tension is important to signal a problem that will only tend to get worse as the elderly become an increasing share of the population in Brazil.
Thus, the goal of this study is to check if the barriers to use and access to healthcare services expressed in the complaints filed with the ANS by beneficiaries in the Southeast of Brazil, between 2010 and 2012, affect the elderly in a greater way.
Methodology
The universe of this study are complaints filed with the ANS between 2010 and 2012 by benefi-ciaries residing in the states of Southeastern Bra-zil. The choice of Southeast states is justified by the high concentration of private healthcare plan owners in the region. In December 2012, a total of 48,695,327 people were covered by medical-hos-pital healthcare plans in Brazil, 31,052,097, or 63.8% of whom lived in the Southeast. In Espíri-to SanEspíri-to, Rio de Janeiro and São Paulo, over 30% of the general population is has some form of coverage23.
The main source of information was the SIF (Integrated Oversight System) database, which records all of the complaints filed with the ANS.
This source dates back to the very creation of the ANS. According to Law 9,961, ANS respon-sibilities include overseeing the activities of pri-vate healthcare plan operators24. The consumer
service center, known as Disque ANS, was creat-ed in 2001, soon after the agency itself. Benefi-ciaries may use Disque ANS to file a complaint against the healthcare plan operator. If the prob-lem is not resolved, and there is any indication that supplemental health legislation is not being followed, an administrative case will be open to investigate the situation. If the investigation re-veals that the law is being broken, administrative sanctions may be imposed on the operator in the form of a fine.
The data in the database used for this analysis was taken from the SIF on 17 April 2013, limit-ed to complaints fillimit-ed in 2010, 2011 and 2012. Of the 106,037 cases, those excluding beneficia-ry DOB, duplicate complaints filed by the same beneficiary and those regarding dental operators or cooperatives were excluded. The final universe for this analysis was made up of 92,235 entries.
Of the variables available in the system, we analyzed:
Year of reference - This will allow us to track number of complaints over time. It was used to describe the share of complaints by age group.
Type of contract - Describes the link between the beneficiary and the operator - whether an in-dividual or group plan, whether a subscription or a group corporate plan.
Plan date - This shows if the healthcare plan of the beneficiary filing a complaint predates Law 9,656 of 2 January 1999, which regulates the private healthcare plan industry in Brazil. Plans subscribed to after 1999 are duly regulated by this law. If the beneficiary subscribed to a plan prior to this date it is not regulated, and coverage, ad-justments and other contractual clauses do not fall under this law.
Type of Operator - Administrator, self-man-aged, medical cooperative, philanthropy, group medicine or insurance. Complaints filed with group dental plans and dental cooperatives were excluded from this analysis.
V
ie
ir
a J
unio
r
WM, that do not fit any of the pre-defined Disque ANS
themes are considered “New Themes”. Regulato-ry issues involving economic-financial aspects, information that must be submitted to the ANS and transfer of customer portfolios between op-erators are considered “Other Themes”.
We developed the following indicators to an-alyze the complaints:
- Complaints as a percentage of all com-plaints filed between 210 and 2012, calculated as “# of complaints/total complaints times 100”. These were grouped into three age groups: 0 to 19 years, 20 to 59 years, 60 or over.
- Percent beneficiaries (# of beneficiaries/to-tal beneficiaries times 100). This calculation used the number of beneficiaries registered in the ANS Beneficiary Information System in Decem-ber 2012, taken from ANS-Tabnet in May 2013. These were grouped into three age groups: 0 to 19 years; 20 to 59 years; 60 or over. It is worth pointing out that there was no age information for 3,275 beneficiaries. Although these cases were not included in the specific indicators, they have been described in the tables.
- Ratio of complaints per beneficiary by age group, expressed using the formula “# of com-plaints/# of beneficiaries per 10,000”. This ratio expresses complaints per 10,000 beneficiaries and measures the extent to which the elderly complain compared to other age groups.
Results
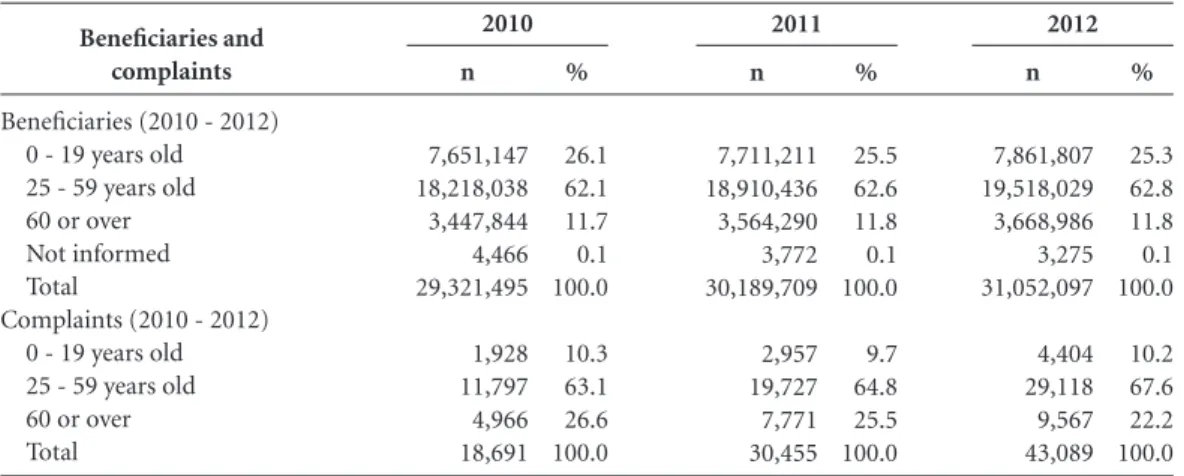
Of the 92,235 complaints analyzed, the elder-ly, which account for 11.8% total beneficiaries, were responsible for 24.2% of the complaints filed with the ANS (Table 1). The complaint ratio for the three years analyzed was 60.8/10,000 el-derly beneficiaries, compared to 31.1/10,000 for beneficiaries aged 20 to 59. In other words, the elderly complain almost twice as much as other adults (Table 2). Among the elderly, the number of complaints increases with age: 57.9/10,000 beneficiaries between 65 and 69, compared to 63.9/10,000 beneficiaries between 74 and 79.
The annual number of complaints increased 130.5% in the period, going from 18 thousand to over 40 thousand. The number of beneficia-ries grew only 5.9% in this period, from about 29 million to 31 million. In every year, the elderly complained more than other beneficiaries. The number of complaints filed by beneficiaries aged 20 to 59 increased faster (146.8%) than those filed by beneficiaries aged 60 or over (92%) (Table 3).
Despite a proportional reduction in the number of complaints filed by the elderly, their ratio was highest every year and increased progressively, from 14.4/10,000 in 2010 to 26.1/10,000 benefi-ciaries in 2012 (Table 2).
Although only 19.1% of the beneficiaries in the Southeast had individual/family plans, this group filed a disproportionate number of com-plaints (48.2%). However, there may be problems with the quality of this data as not all beneficia-ries were aware of the type of contract they were covered by. The proportion of “elderly beneficia-ries” filing complaints was larger than the pro-portion of “beneficiary elderlies”, regardless of the nature of the coverage. The complaint ratio was always larger among the elderly, regardless of how healthcare coverage was contracted. The highest ratio was found in individual plans, with 105.8 complaints per 10,000 elderly beneficiaries.
Although there are no records of this, in 58.7% of the complaints, the share of complaints related to non-regulated plans was quite high
Year
2010 2011 2012 Total
0 - 19 years old
2.5 3.8 5.6 11.8
20-59 years old
6.5 10.4 14.9 31.1
Table 2. Complaint ratio by age group and year,
Southeast, 2010-2012.
60 or over
14.4 21.8 26.1 60.8
Source: SIB/ANS/MS; SIF/ANS/MS.
Beneficiaries and complaints
Beneficiaries (Dec. 2012) 0 - 19 years old 25 - 59 years old 60 or over Not informed Total
Complaints (2010-2012) 0 - 19 years old 25 - 59 years old 60 or over Total
n
7,861,807 19,518,029 3,668,986 3,275 31,052,097
9,289 60,642 22,304 92,235
%
25.3 62.8 11.8 0.1 100.0
10.1 65.7 24.2 100.0
Table 1. Healthcare plan beneficiaries by age in 2012
and number of complaints by age group between 2010 and 2012, Southeast.
e C
ole
tiv
a,
20(12):3817-3826,
2015
(50.6%), in part due to the higher share of elderly beneficiaries of these contracts (25.2%) and the effectiveness of clauses limiting the use of the ser-vices provided or higher premium adjustments. These situations lead to conflicts between ben-eficiary and operator. Regardless of whether the contract was signed before or after the law regu-lating healthcare plans, the fact is that the elder-ly complain more. If we look onelder-ly at complaints that include the date the contract was signed, the ratio is 24 for every 10,000 elderly beneficiaries, for regulated and non-regulated plans.
Group medicine had the highest share of complaints (58.6%). However, regardless of the type of plan operator, the incidence of com-plaints by elderly beneficiaries was always higher. An analysis of the complaint ratios shows that the highest incidence was found among the el-derly beneficiaries, regardless of the type of oper-ator. In group medicine, the complaint ratio was 99.5 per 10,000 beneficiaries, followed by health insurance with 58.9 complaints/10,000 beneficia-ries. The lowest ratios were found in self-man-aged plans and philanthropies, both with about 22 complaints per 10,000 elderly beneficiaries (Table 4).
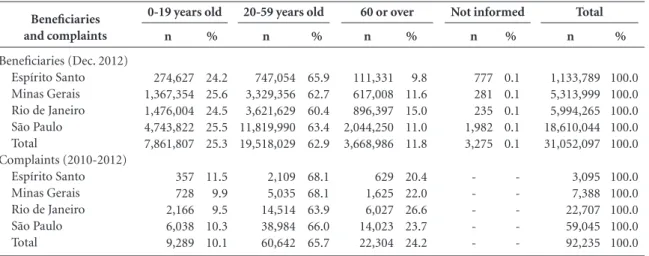
Of the Southeast states, São Paulo had 59.9% of the beneficiaries, who were responsible for 64% of the complaints. Minas Gerais on the other hand, had 17.1% of the beneficiaries who were responsible for only 8% of the complaints. In Southeast states the elderly complained more than beneficiaries in this age bracket. The high-est complaint ratio was found in Rio de Janeiro (26.5%), which also has the largest percent of el-derly beneficiaries (15.0%).
The complaint ratio for every state in the re-gion was higher among elderly beneficiaries, with the lowest ratio in Minas Gerais - 26.3/10,000 beneficiaries in this age bracket. The complaint ratio in Rio de January and São Paulo was around 65/10,000 elderly beneficiaries (Table 5).
If we look at the reason for the complaints, we find that coverage was the primary reason (68%) (Table 6), reflecting issues of limited access for this population group imposed by healthcare plan operators. One must point out that among the elderly there is a high proportion of com-plaints against “monthly premiums and adjust-ments” (12.7%), while the incidence of such complaints among adults is only 6.0% (Table 6).
Discussion
This study attempted to determine the extent to which risk selection strategies and service cost saving measures adopted by healthcare plans af-fect the elderly, as reflected in complaints filed with the ANS. The importance of this discussion for the nation’s healthcare policy is related to the aging population and the State’s incentives for private healthcare. Private healthcare companies that sell coverage plans aim to maximize their profits, as would be expected. In the search for profits, it is likely that some groups will be more affected than others.
This study shows that compared to other age groups, the elderly file more complaints with the ANS, even though they are not the largest group of plan beneficiaries. This is cause for concern, as it is when they are older and more fragile that
Beneficiaries and complaints
Beneficiaries (2010 - 2012) 0 - 19 years old 25 - 59 years old 60 or over Not informed Total
Complaints (2010 - 2012) 0 - 19 years old 25 - 59 years old 60 or over Total
Table 3. Beneficiaries and complaints by age group and year, Southeast, 2010-2012.
Source: SIB/ANS/MS; SIF/ANS/MS.
n
7,711,211 18,910,436 3,564,290 3,772 30,189,709
2,957 19,727 7,771 30,455
%
25.5 62.6 11.8 0.1 100.0
9.7 64.8 25.5 100.0
n
7,861,807 19,518,029 3,668,986 3,275 31,052,097
4,404 29,118 9,567 43,089
%
25.3 62.8 11.8 0.1 100.0
10.2 67.6 22.2 100.0
n
7,651,147 18,218,038 3,447,844 4,466 29,321,495
1,928 11,797 4,966 18,691
%
26.1 62.1 11.7 0.1 100.0
10.3 63.1 26.6 100.0
V ie ir a J unio r
WM, beneficiaries find barriers to accessing the
ser-vices that should be provided to them. This find-ing would seem to reinforce the rationale that the organizational devices of private healthcare plans create access barriers and risk reduction strategies that affect primarily the groups more likely to use the services. In this study, we chose to look at the elderly, as they are more susceptible to restrictions on the use of healthcare services due to their inherent characteristics, such as the
likelihood that they have a chronic disease and a pattern of increased use of healthcare services. However, adults and children are certainly also affected by these restrictions, in particular preg-nant women and people with chronic diseases.
Although there is no data on which proce-dures are denied, which would require a manual analysis of each complaint, previous studies based on data on lawsuits and ANS complaints show that in general these are high-cost procedures25-27.
Beneficiaries and complaints
Beneficiaries (Dec. 2012) Self-managed Medical cooperative Philanthropy Group medicine Insurance Total Complaints (2010-2012) Self-managed Medical cooperative Philanthropy Group medicine Insurance Administrator Not informed Total
Table 4. Beneficiaries and complaints by age group and type of operator, Southeast, 2010-2012
Source: SIB/ANS/MS; SIF/ANS/MS.
n 558,291 2,621,020 263,902 3,245,286 1,173,308 7,861,807 157 1.956 150 6.076 638 175 137 9.289 % 19.9 26.4 23.6 25.9 25.0 25.3 4.1 9.2 10.5 11.3 7.4 11.5 8.7 10.1
0-19 years old
n 1,629,208 6,129,942 654,459 7,896,848 3,207,572 19,518,029 2,265 14,727 821 34,357 6,164 1,178 1,130 60,642 % 58.0 61.7 58.3 63.1 68.3 62.8 59.1 69.3 57.5 63.6 71.4 77.3 72.2 65.7
20-59 years old
n 618,366 1,173,481 201,888 1,364,550 310,701 3,668,986 1,411 4,564 457 13,573 1,829 170 300 22,304 % 22.0 11.8 18.0 10.9 6.6 11.8 36.8 21.5 32.0 25.1 21.2 11.2 19.1 24.2
60 or over
n 1,348 1,089 128 394 316 3,275 -% 0.1 0.1 0.1 0.1 0.1 0.1 -Not informed n 2,807,213 9,925,532 1,120,377 12,507,078 4,691,897 31,052,097 3,833 21,247 1,428 54,006 8,631 1,523 1,567 92,235 % 100.0 100.0 100.0 100.0 100.0 100.0 100.0 100.0 100.0 100.0 100.0 100.0 100.0 100.0 Total Beneficiaries and complaints
Beneficiaries (Dec. 2012) Espírito Santo Minas Gerais Rio de Janeiro São Paulo Total
Complaints (2010-2012) Espírito Santo Minas Gerais Rio de Janeiro São Paulo Total
Table 5. Beneficiaries and complaints by age group and state, Southeast, 2010-2012.
Source: SIB/ANS/MS; SIF/ANS/MS.
n 274,627 1,367,354 1,476,004 4,743,822 7,861,807 357 728 2,166 6,038 9,289 % 24.2 25.6 24.5 25.5 25.3 11.5 9.9 9.5 10.3 10.1
0-19 years old
n 747,054 3,329,356 3,621,629 11,819,990 19,518,029 2,109 5,035 14,514 38,984 60,642 % 65.9 62.7 60.4 63.4 62.9 68.1 68.1 63.9 66.0 65.7
20-59 years old
n 111,331 617,008 896,397 2,044,250 3,668,986 629 1,625 6,027 14,023 22,304 % 9.8 11.6 15.0 11.0 11.8 20.4 22.0 26.6 23.7 24.2
60 or over
e C
ole
tiv
a,
20(12):3817-3826,
2015
This situations is illustrated by Scheffer25: Coverage exclusions consistently reported or claimed by users show the imbalance and conflict that currently exists between operators, providers and clients. This shows that not even the supposed virtuous nature of free enterprise, nor the regula-tions in place are able to properly solve the problem, as it involves disparate interests and expectations.
Furthermore, the percent complaints filed by the elderly about the high cost of monthly premiums (12.7%) illustrates the impact of the high percent adjustments charged to people as they advance in age. This also constitutes an ac-cess barrier, as it makes it impossible for people to keep up their healthcare plans. Added to this is the difficulty migrating to different plans, as most operators do not offer individual health-care plans.
This study found a number of limitations in terms of the data required for the intended analysis. Initially we found a number of inplete complaints files. When analyzing the com-plaints we realized that a large number did not include the date of enrollment in the plan, and many mentioned “New Theme”, which is vague
and likely used due to the inability to classify the complaint in one of the existing themes. The ANS must try to improve its theme tree for com-plaints to enable analyzing the reasons why bene-ficiaries file complaints, and to monitor operator conduct over time.
We were also unable to draw any conclusions about elderly people being denied enrollment in healthcare plans. The theme covering this would be “Contracts and Regulations”, which is far too broad. In this line, it would be interesting to fur-ther break down complaints, such as by mention-ing the procedure generatmention-ing the complaint, and the mechanism used to resolve the issue. This data would enable more complete analyses and monitoring for repeat incidents with operators.
We point out that the results submitted in this paper should be taken as the tip of the ice-berg due to, for example, the inability to map cases where individuals had trouble enrolling in healthcare plans, and also because the data used was limited to voluntary complaints. Cer-tainly there is other data regarding healthcare plan beneficiary complaints dispersed in other data system, such as the justice and consumer defense systems. There are also many situations where beneficiaries are able to solve their health problem by resorting to the SUS. A considerable number of people with healthcare plans also use the public health service2,28
The findings of the present study, that the conflict of interest between healthcare plan op-erators and beneficiaries affects the elderly quite specifically, is very relevant for defining health-care and regulatory policies for this sector. This is particularly the case in light of the challenges posed by population aging, with the associat-ed morbidity profile, requiring reorganization and coordination of healthcare in Brazil, just as in other countries. From this point of view, the healthcare systems and the healthcare organi-zation should prioritize preventive measures to keep people healthy, but at the same time try to integrate the healthcare network - outpatient clinics, emergency centers and hospitals - with social support services29.
Given this challenge, paradoxically, the cur-rent model operators use to market healthcare by o is going in the opposite direction, where health-care is driven primarily by financial aspects. This makes it difficult to make the right to health and healthcare compatible with private enterprise.
Here Campos30 mentions that when healthcare
becomes a competitive activity subject to the laws of free enterprise, private interests predominate, Age
group
0 - 19 years old
25 - 59 years old
60 or over
n
7,280 1,457 240 222 63 27 9,289 44,241 9,319 3,622 2,820 417 223 60,642 15,179 3,107 2,827 684 381 126 22,304
%
78.4 15.7 2.6 2.4 0.6 0.3 100.0 73.0 15.3 6.0 4.6 0.7 0.4 100.0 68.1 13.8 12.7 3.1 1.7 0.6 100.0
Table 6. Complaint theme by age group, Southeast,
2010-2012.
Source: SIF/ANS/MS.
Theme
Coverage
Contracts and regulations New Theme
Monthly fees and adjustments Other themes
Not informed Total Coverage
Contracts and Regulations Monthly fees and adjustments New Theme
Other themes Not informed Total Coverage
Contracts and Regulations Monthly fees and adjustments New Theme
V
ie
ir
a J
unio
r
WM, degrading the quality and efficiency of care, and
responsibility.
This debate, along with other long-term chal-lenges to healthcare in Brazil, must inevitably include a discussion of a new arrangement for supplemental health, including a review of the current compensation model, where providers are encouraged to work within a production ra-tionale based on the number of procedures31.
If the State agenda privileges incentives to the private sector by waiving and reducing taxes, it must also be aware that these providers will al-ways opt for the solution that brings in the most economic benefit. In itself this would justify an urgent intervention by the State, with a regula-tory policy that preserves the rights of beneficia-ries that chose to use private healthcare plans. Considering that it is the goal of the ANS to
promote the defense of the public interest in sup-plemental healthcare, operator conduct must be closely monitored, including checks if healthcare plans are imposing restrictions and harming the health of their beneficiaries. This regulatory ef-fort would require acting in several spheres, from mobilizing players and society through provid-ing suitable and reliable information systems.
e C
ole
tiv
a,
20(12):3817-3826,
2015
References
Cecílio LCO, Aciole GG, Meneses CS, Iriart CB. A saú-de suplementar na perspectiva da microrregulação. In: Brasil. Ministério da Saúde (MS). Agência Nacional de Saúde Suplementar. Duas Faces da Mesma Moeda: mi-crorregulação e modelos assistenciais na saúde suplemen-tar. Rio de Janeiro: MS; 2005. p. 63-74.
Santos IS, Ugá MAD, Porto SM. O mix público-privado no Sistema de Saúde Brasileiro: financiamento, oferta e utilização de serviços de saúde. Cien Saude Colet 2008; 13(5):1431-1440.
Fundação Oswaldo Cruz (Fiocruz). A saúde no Brasil em 2030: diretrizes para a prospecção estratégica do sis-tema de saúde brasileiro. Rio de Janeiro: Fiocruz/Ipea/ Ministério da Saúde/Secretaria de Assuntos Estratégi-cos da Presidência da República; 2012. [acessado 2013 set 11]. Disponível em http://www.fiocruz.br/editora/ media/Saude_Brasil_2030.pdf
Kalache A, Keller I. The greying world: a challenge for the 21st century. Science Progress 2000; 83(1):33-54. Instituto Brasileiro de Geografia e Estatística, Diretoria de Pesquisas. Censo demográfico, 2010. Rio de Janeiro: IBGE; 2011.
Instituto Brasileiro de Geografia e Estatística (IBGE).
Indicadores sociodemográficos e de saúde no Brasil 2009. Rio de Janeiro: IBGE; 2009.
Agência Nacional de Saúde Suplementar. Caderno de informação da saúde suplementar: beneficiários, ope-radoras e planos. Rio de Janeiro: Agência Nacional de Saúde Suplementar; 2013.
Spillman BC, LubitzJ. The effect of longevity on spend-ing for acute and long-term care. N Engl J Med 2000; 342(19):1409-1415.
Polder JJ, Bonneux L, Meerding WJ, Van der Maas PJ. Age-specific increases in health care costs. Eur J Public Health 2002; 12(1):57-62.
Bains M. Projecting Future Needs: Long-term Projec-tions of Public Expenditure on Health and Long-term Care for EU Member States. In: OECD. A Disease-based Comparison of Health Systems: What is Best and at What Cost? Paris: OECD Publishing; 2003. p. 145-161. Nunes A. O envelhecimento populacional e as despesas do Sistema Único de Saúde. In: Camarano AA, orga-nizador. Os novos idosos brasileiros. Muito além dos 60? Rio de Janeiro: Instituto de Pesquisa Econômica Apli-cada; 2004. p. 427-450.
Louvison MCP, Lebrão ML, Duarte YAO, Santos JLF, Malik AM, Almeida ES. Desigualdades no uso e acesso aos serviços de saúde entre idosos do município de São Paulo. Rev Saude Publica 2008; 42(4):733-740. Lima-Costa MFF, Guerra HL, Barreto SM, Guimarães RM. Diagnóstico da situação de saúde da população idosa brasileira: um estudo da mortalidade e das inter-nações hospitalares públicas. Informe Epidemiológico SUS 2000; 23-41.
Peixoto SV, Giatti L, Afradique ME, Lima-Costa MFF. Custo das internações hospitalares entre idosos brasi-leiros no âmbito do Sistema Único de Saúde. Epidemiol Serv Saúde 2004; 13(4):239-246.
Berenstein CK, Wajnman S. Efeitos da estrutura etá-ria nos gastos com internação no Sistema Único de Saúde: uma análise de decomposição para duas áreas metropolitanas brasileiras. Cad Saude Publica 2008; 24(10):2301-2313.
1.
2.
3.
4. 5.
6.
7.
8.
9.
10.
11.
12.
13.
14.
15. Collaborations
WM Vieira Junior designed the study, analyzed the data and drafted the text. M Martins helped design the study, analyze the data and draft the text. He also did a critical review.
Acknowledgements
V
ie
ir
a J
unio
r
WM, Kanamura AH, Viana ALD. Gastos elevados em plano
privado de saúde: com quem e em quê. Rev Saude Pu-blica 2007; 41(5):814-820.
Reinhardt UE. Does the Aging of the Population Re-ally Drive the Demand for Health Care? Health Affairs
2003; 22(6):27-39.
Ocké-reis CO. SUS: o desafio de ser único. Rio de Janei-ro: Editora Fiocruz; 2012.
Brasil. Resolução do Conselho de Saúde Suplementar. CONSU nº 8, de 3 de novembro de 1998. Dispõe sobre mecanismos de regulação nos Planos e Seguros Pri-vados de Assistência à Saúde. Diário Oficial da União
1998; 4 nov.
Aciole GG, Malta DC, Cecílio LCO, Jorge AO. Refle-xões sobre o trabalho médico na Saúde Suplementar. In: Brasil. Ministério da Saúde (MS). Agência Nacional de Saúde Suplementar. Duas Faces da Mesma Moeda: microrregulação e modelos assistenciais na saúde suple-mentar. Rio de Janeiro: MS; 2005. p. 203-222. Machado JRO. Negativas de cobertura pelas operado-ras de planos de saúde: análise das denúncias de be-neficiários encaminhadas à Agência Nacional de Saúde Suplementar (ANS) [dissertação]. Rio de Janeiro: Fio-cruz; 2011.
Gerschman S, Veiga L, Guimarães C, Ugá MAD, Portela MC, Vasconcellos MM, Barbosa PR, Lima SML. Estu-do de satisfação Estu-dos beneficiários de planos de saúde dos hospitais filantrópicos. Cien Saude Colet 2007; 12(2):487-500.
Agência Nacional de Saúde Suplementar. ANS Tabnet. [acessado 2013 maio 10]. Disponível em: http://www. ans.gov.br/anstabnet/
Brasil. Lei n.º 9.961, de 28 de janeiro de 2000. Cria a Agência Nacional de Saúde Suplementar - ANS e dá outras providências. Diário Oficial da União 2000; 29 jan.
16.
17.
18. 19.
20.
21.
22.
23.
24.
Scheffer M. Os planos de saúde nos tribunais: uma aná-lise das ações judiciais movidas por clientes de planos de saúde, relacionados à negação de coberturas assistenciais no Estado de São Paulo [dissertação]. São Paulo: USP; 2006.
Alves DC, Bahia L, Barroso AF. O papel da Justiça nos planos e seguros de saúde no Brasil. Cad Saude Publica
2009; 25(2):270-290.
Scheffer M. Coberturas assistenciais negadas pelos pla-nos e seguros de saúde em ações julgadas pelo Tribu-nal de Justiça do estado de São Paulo. R. Dir. Sanitário
2013; 14(1):122-132.
Porto SM, Ugá MAD, Moreira RS. Uma analise da utilização de serviços de saúde por sistema de finan-ciamento: Brasil 1998-2008. Cien Saude Colet 2011; 16(9):3795-3806.
Curry N, Ham C. Clinical and service Integration The route to improved outcomes. List Int J Integr Care 2012; 12:e199.
Campos GWS. O público, o estatal e o particular nas políticas públicas de saúde. In: Heimann LS, Ibanhes LC, Barboza R. O público e o privado na saúde. São Pau-lo: Hucitec; 2005. p. 89-101.
Hernández-Quevedo C, Llano R, Mossialos E. Paying for integrated care: an overview. Euro health incorpora-ting Euro Observer 2013; 19(2):3-6.
Article submitted 04/08/2014 Approved 26/11/2014
Final version submitted 28/11/2014 25.
26.
27.
28.
29.
30.