RE
VISÃO
RE
VIE
W
Integrated assessment of environment and health:
America’s children and the environment
*
Avaliação integrada de saúde e ambiente:
crianças americanas e o ambiente
* This article was originally published by the journal Environmental Health Perspectivesand is part of the scientific collaboration between Rev C S Col and EHP.
1 School of Public Health, University of California. 140 Warren Hall, Berkeley, CA, 94720-7360 USA. [email protected]. 2 U.S. Environmental Protection Agency, San Francisco, CA. 3 U.S. Environmental Protection Agency, Washington, DC.
Amy D. Kyle 1
Tracey J. Woodruff2
Daniel A. Axelrad 3
Abstract There is a need for systematic ap-proaches to assessment of environmental factors most relevant to health, health outcomes most in-fluenced by the environment, and relationships between them, as well as for approaches to repre-senting results of such assessments in policy delib-erations. As a step in the development of such methods, we used findings and data from envi-ronmental protection and public health sectors to develop a set of measures representing topics rele-vant to children’s environmental health. We used a definition of the environment that emphasized contaminants and a process that involved both analytic and deliberative elements. The steps in this process were to: a) develop a conceptual framework to depict relationships between envi-ronment and health with relevant types of data and information, b) select topic areas of signifi-cance for children, c) identify best available data sources and devise measures, d) assess possible surrogate data sources and measures when need-ed, e) design and implement metrics for compu-tation of measures; f) select graphical representa-tions of measures, g) identify related measures, and h) identify data gaps. Representatives of poli-cy and stakeholder audiences participated in this process.
Key words Child welfare, Children’s
environ-mental health, Environenviron-mental contaminants, En-vironmental exposure, EnEn-vironmental health in-dicators
Resumo No momento atual do conhecimento sobre o tema, existe a necessidade de avaliações sistemáticas a respeito dos fatores que mais con-tribuem para a saúde, das contribuições mais relevantes do setor saúde para o ambiente e das relações entre ambos os campos, assim como de abordagens sobre resultados das deliberações po-líticas sobre resultados dos estudos. Neste artigo, apresentamos achados e dados a respeito da pro-teção ambiental e de saúde visando desenvolver propostas a favor da saúde ambiental das crian-ças. Usamos uma definição de ambiente que en-fatiza contaminantes e processos e envolvem ele-mentos analíticos e deliberativos. As etapas do es-tudo foram: a) desenvolver um marco conceitual que retratasse relações entre saúde e ambiente por meio de relevantes tipos de dados e informações; b) selecionar tópicos de significância para a saúde das crianças; c) identificar as melhores fontes e tópicos para medição; d) avaliar possíveis medi-das e fontes adicionais se necessário; e) desenhar e implementar métrica para medidas de com-putação; f) selecionar representações gráficas das medidas; g) identificar medidas relacionadas e h) identificar lacunas de dados. Gestores e finan-ciadores participaram do processo.
Palavras-chave Bem-estar infantil, Saúde
Ky
le
,A
.
D
.
et
a
l
.
440 440 440 440 440 440 440 440 440 440 440
The significance of environmental factors to the health and well-being of human popula-tions is increasingly apparent1, 2, 3.
Environ-mental factors are known or suspected to con-tribute to important chronic diseases for which incidence has increased, including asthma4,
certain cancers5, and neurodevelopmental
out-comes6, 7, 8, 9, 10.
In the United States, an environmental public health tracking initiative to develop ca-pacity for ongoing assessment of environmen-tal hazards, exposures, and health outcomes is being coordinated by the Centers for Disease Control and Prevention (CDC)11, 12, 13. This
initiative is one example of efforts to better as-sess, characterize, and address relationships be-tween environmental factors and health and to address the challenges of noninfectious agents and chronic diseases. Initiatives to assess envi-ronmental factors that contribute to health sta-tus require findings, data, and expertise from both the environmental protection and public health sectors14, 15. Integrated assessments use
findings and data from different disciplines to generate more informative assessments rele-vant to public policy problems16. Integrated
as-sessment methods relevant to climate change17, 18, 19, 20and integration of human and
ecologi-cal risk assessment21have been developed.
Ele-ments of these methods can be applied to envi-ronmental health.
To communicate effectively to stakeholders and policy audiences requires development of understandable and interpretable ways to pre-sent data. Environmental health indicators are increasingly being used to summarize technical information and characterize key environmen-tal factors, health outcomes, and relationships between them22, 23, 24, 25, 26. Such
environmen-tal health indicators can be distinguished from indicators that focus primarily on either the environment27or on health28.
Environmental factors that affect children may differ from those most relevant to adults because children can be both more vulnerable and more highly exposed than adults29, 30.
Life-long consequences of exposures in early life are beginning to be observed31, 32. Efforts to assess
children’s environmental health systematically are beginning internationally33, 34, 35, 36. For
ex-ample, the WHO in Europe has developed esti-mates of children’s disease burden from air pollution, water and sanitation, lead, and in-jury37. Addressing children’s health needs,
in-cluding those associated with environmental
factors, requires targeted approaches to infor-mation gathering and assessment32.
In 1999, we began to develop a set of mea-sures relevant to children’s environmental health in the United States. The goals were to a) iden-tify environmental contaminants significant for children and diseases or disorders of chil-dren likely to be related to environmental con-taminants or conditions, b) develop quantifi-able measures of changes in these contami-nants or diseases in the United States for the period 1990 to 2000 using existing data, c) as-sess differences by race/ethnicity and socio-economic status (SES), d) identify areas in need of attention or further research, and e) identify data gaps. Initial results were released in 200038, and an expanded assessment, titled
America’s Children and the Environment: Mea-sures of Contaminants, Body Burdens, and Ill-nesses, was released in 200339. In this article, we
report on the framework and methods used to develop this first integrated assessment of en-vironment and health for children in the Unit-ed States.
Methods and approach
The steps in the assessment of children’s envi-ronmental health, shown in figure 1, were to develop a framework to represent relationships between environmental factors and health; se-lect topic areas; identify, assess, and sese-lect data sources and develop specific measures to repre-sent the data; investigate surrogate measures when data were not available for a measure identified as most directly relevant; specify com-putational approaches or metrics and data ele-ments to generate the measures and implement them; develop graphical representations of the measures; identify measures that are related; and identify data gaps and future directions for additional research and analysis. Assessment of differences by SES and by race/ethnicity was a critical component, because identifying such differences and looking for their causes is es-sential to eliminating health disparities.
appropri-oleti
va,
11(2):439-451,
2006
Select topic areas
Outdoor air pollutants Indoor air pollutants Drinking water contaminants
Food contaminants Land contaminants
Lead in blood Mercury in blood Cotinine in blood
Respiratory diseases Childhood cancer Neurodevelopmental
Information sources and considerations
Literature review Expert consultation Stakeholder interests Institutional mission
Select best data sources
Environmental monitoring data Environmental surveys Body burden measurements
Health survery data Medical care utilization
Devise measures
Define relevant parameters Consider best representation
of data
Surrogates If needed, explore surrogate
approaches
Develop and implement metrics Use specified data elements
Develop graphical presentation
Identify related measures
Identify data gaps Figure 1
Ky
le
,A
.
D
.
et
a
l
.
442 442 442 442 442
ate to use a broader definition of the environ-ment and include eleenviron-ments of the built envi-ronment or factors originating in sectors such as education, housing, or transportation.
We convened workshops that included stakeholders and experts in toxicology, epi-demiology, children’s health, exposure assess-ment, and public health surveillance to discuss conceptual approaches, topics to be addressed, data sources, metrics, graphical representa-tions, and data gaps. We consulted with techni-cal and policy experts from key federal agen-cies. This analytic-deliberative process allowed us to meld the views of technical experts and stakeholders into a consistent approach and to identify the best available data sources and methods to address questions of interest.
Develop framework to depict the relationship between environment and health.We developed a framework to depict relationships between environmental factors and health. We incorpo-rated some elements of a widely used WHO model, which includes: driving forces → pres-sures →environmental states →exposures → health conditions or effects, shown in figure 222, 40, 24. Driving forces include major social and
economic changes and practices such as urban-ization, poverty and inequality, scientific and technical advances, and patterns of production and consumption. Pressures include sources or releases of environmental agents. Environmen-tal states include conditions of environmenEnvironmen-tal media such as lakes or streams.
Our framework, shown in figure 3, includes driving forces; sources of releases of environ-ment agents of concern; concentrations of en-vironmental agents of concern measured or es-timated in environmental ambient or exposure media; concentrations of agents of concern in human tissues; and health outcomes (diseases and disorders) in populations. We included driving forces and sources of agents in the framework because control or elimination of sources is the policy strategy that reflects pri-mary prevention. However, we did not develop measures for them because of resource limita-tions. We do not use the terms “pressures,” “states,” or “responses” because we have found them ambiguous.
Figure 3 shows types of information rele-vant to each component. Ambient environ-mental media include outdoor air, water, soil, or agricultural products; exposure media in-clude outdoor air, indoor air, drinking water, food products, and dust. Concentrations in
ambient media are often significant determi-nants of exposure. For example, epidemiologic studies have measured pollutant contaminants in ambient media and quantified relationships to health effects (i.e., relationships between outdoor measurements of fine particulate mat-ter and mortality). In this approach, we consid-er data about concentrations of environmental agents in exposure media and concentrations of agents of concern in human tissues.
Identify topic areas to address. The second step was to identify topic areas of interest. For environmental contaminants, these areas in-cluded outdoor air pollutants, indoor air pol-lutants, drinking water contaminants, contam-inants in foods, and contamcontam-inants in soil. For contaminants in humans, we included topic ar-eas identified as a concern in the environment and for children for which we could produce a meaningful interpretation of data available from the nationally representative sample de-veloped by CDC41. For diseases and disorders,
we included examples important to the health of children for which there was also published research that showed an established or suggest-ed link to one or more environmental contam-inants, based on previous analysis, consultation with experts, survey of the scientific literature, and use of standard references and existing re-views42. We reviewed emerging research on the
links between air pollutants and respiratory outcomes in children and adults, evidence for environmental factors that contribute to can-cer in children, and studies that examined links between environmental exposures and neu-rodevelopmental disorders39.
We did not attempt at the outset to identify all topic areas that might be relevant; rather, we endeavored to identify a scope of work that could be accomplished with available resources. We identified agents and outcomes of concern first and then sought data sources for these agents and outcomes to allow for identification of data gaps.
oleti
va,
11(2):439-451,
2006
Driving forces Population growth Economic development
Technology
States Natural resources
Natural hazard Pollution
Exposures Exposure Absorbed dose Target organ dose
Effects Well-being Morbidity Mortality
Economic policy Social policy Clean technology
Process/product control Emission control
Environmental improvement
Education Awareness raising
Treatment
v
v
v
Figure 2
WHO framework for assessment of relationships between environment and health and policy actions or interventions. The DPSEE (driving force, pressure, state, exposure, effect) model is commonly used in international contexts as a framework for developing indicators and assessing relationships between environmental factors and health outcomes. Adapted from a presentations of the model in a recent
document from the World Health Organization33.
v
v
v
v
v Pressures Production Consumption
Waste release
v
v
consulted key references and knowledgeable parties. When multiple sources were available, we selected the source with the best representa-tion of the United States and best coverage of the study period. For some topic areas, we could not identify usable data sources.
In conjunction with the review of data sources, we developed measures for the topic ar-eas. We reviewed measures included in Healthy People 201043. In some cases, we concluded
that more than one measure was needed. For example, for criteria air pollutants, we
includ-ed one measure that reflectinclud-ed air quality on a daily basis, which is related to health effects associated with short-term, high concentra-tions of pollutants. Because chronic exposures to lower concentrations of pollutants are also relevant, we included a measure based on an-nual concentrations for some pollutants. To reflect the coverage of data sources, we esti-mated the percent of the population repre-sented.
representa-Ky
le
,A
.
D
.
et
a
l
.
444
or generate the measure, to select the metric, and to identify data elements to be used and their sources. Measures were then computed.
Design graphical representation of the mea-sure. Along with the computation of the mea-sure, we selected an approach to present results graphically for each measure. We considered how to show limitations, distributions, and coverage of the data. When possible, presenta-tions showed trends over time and differences by race/ethnicity and SES.
Sources of agents Industry Transportation
Energy Consumer products
Human health Precursor effects
Disorders Diseases
Ambient media Water bodies
Outdoor air Crops
Soil
People Body burdens Exposure markers Biomarkers of effect Susceptibility markers
Exposure media Drinking water
Indoor air Food Dust Driving forces
Social Economic Technological
Qualitative assessment Integrated assessment
Epidemiology studies Toxicology Studies
Assays
Research Modeling Measurement
Modeling Measurement Modeling
Measurement Emissions inventories
Measurements Permits Figure 3
Conceptual framework to represent relationships between environmental factors and health. This framework shows relationships as well as the types of data that can be used to represent the characteristics relevant to each of the major components (shown in the small boxes).
v
v
v
v
v
v
tive of a condition of interest was not available, we investigated surrogates that reflected related conditions. For example, we used reported vio-lations of drinking water standards as a surro-gate for concentrations of contaminants in drinking water. We assessed data for surrogate measures using the same approach used for other sources.
oleti
va,
11(2):439-451,
2006
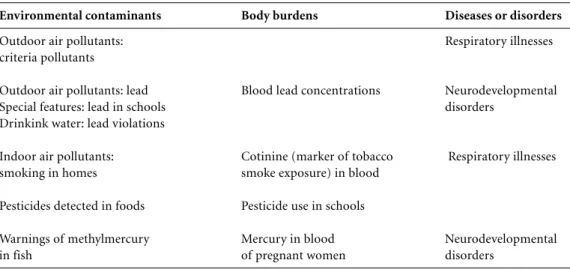
Identify related measures. To highlight rela-tionships between contaminants and outcomes, we identified measures that were related. For example, measures that reflect concentrations of mercury in foods would be related to mea-sures that reflect concentrations of mercury in blood of women of childbearing age. Table 1 shows measures that may be viewed as related. Related measures can be considered together to look at patterns with regard to time, geogra-phy, race/ethnicity, and SES. This approach can identify additional areas for research, needs for further review or consideration of existing re-search, or areas in need of policy development or intervention.
Identify data gaps. The last step was to de-scribe data gaps. In some cases, we included a narrative description of the topic area as an emerging issue. Other topic areas were identified as data gaps. For even the best data sources, there are usually limitations on coverage or representativeness. We addressed some of these issues in the final step. There are many impor-tant topics for children’s environmental health with little or no coverage in the set of measures assembled.
Results and discussion
The analysis resulted in the development of measures for environmental contaminants, hu-man body burdens, and diseases and disorders. Table 2 shows the full set of measures and their coverage.
The development of measures raises nu-merous issues. One issue for environmental contaminant and body burden measures is whether a point of comparison should be used. Measured or estimated values can be compared to regulatory standards, such as ambient air quality standards, or other benchmarks. Such comparisons can be useful because most people understand that concentrations that exceed such standards may be related to potential for disease. However, regulatory standards may re-sult from balancing of health with other factors, such as cost or technologic feasibility of control technologies. Such standards would not repre-sent an appropriate point of comparison from a health perspective. Comparison to a fixed standard can create an impression that there is a “safe” concentration below which exposures would not pose any risk to health. However, for many pollutants, there may be no threshold, as is the case for particulate matter, ozone, and blood concentrations of lead44, 45, 46, 47, 48, 49.
How to reflect the distribution of the data is important as well. For example, for blood lead concentrations, the median or average val-ue gives an idea of the typical child’s exposure, but will not convey the potential magnitude of risk that could be experienced by children with concentrations at the higher end, such as the 95th percentile. It is useful to report both cen-tral and high-end estimates and to characterize groups likely to be affected by the higher expo-sures. This approach may be important for identifying health disparities or differences in exposures.
Table 1
Measures that may be viewed as related.
Environmental contaminants Body burdens Diseases or disorders
Outdoor air pollutants: Respiratory illnesses
criteria pollutants
Outdoor air pollutants: lead Blood lead concentrations Neurodevelopmental
Special features: lead in schools disorders
Drinkink water: lead violations
Indoor air pollutants: Cotinine (marker of tobacco Respiratory illnesses
smoking in homes smoke exposure) in blood
Pesticides detected in foods Pesticide use in schools
Warnings of methylmercury Mercury in blood Neurodevelopmental
Ky
le
,A
.
D
.
et
a
l
.
446
Table 2
Measures in America's Children and the Environmentfor environmental contaminants, body burdens, and diseases
Topic area Description of measure Time period Coverage Geographic Notes
resolution
Measures for environmental contaminants
Common air E1: Percentage of children 1990-2000 Varies by County Includes ozone, PM10,
pollutants children living in counties pollutanta S02, N02and lead (where
in which air quality date are available)
standarts were exceeded
Common air E2: Percentage of 1990-2000 Varies by County Includes ozone, PM10,
pollutants children's days with good, pollutanta S0
2, N02and C0 (where
moderate, or unhedalthy date are available)
air quality
Common air E3a: Long-term trends 1990-2000 Varies by County Includes three common
pollutants in annual average pollutanta air pollutants with
concentration of long-term standards:
common pollutants PM10, S02, N02
Common air E3b: Number of children 1990-2000 About 70% County
pollutants living in counties of children
with high annual
concentrations of PM10
Hazardous air E4: Percentage of children 1996 Continental County 1 year only, based
pollutants living in counties where USA on estimates for 33
hazardous air pollutants pollutants
concentrations exceeded benchmarks
Environmental E5: Percentage of homes 1994-1999 US population National Basead on representative
tobacco smoke with children <7 years sample of US population
of age where someone Surrogate for
smokes regularly concentration
Drinking water E6: Percentage of children 1993-1999 About 85% County Data on violations are
contaminants living in areas served by of population incomplete. Measure
public water systems that is a surrogate for
exceeded a drinking water concentrations of
standard or violated contaminants
treatment requirements
Drinking water E7: Percentage of children 1993-1999 About 85% County Shows children living
contaminants living in areas with major of population in areas without
monitoring violations of drinking water reported data
and reporting monitoring and reporting
requirements
Food contaminants E8: Percentage of fruits, 1994-2001 Fron National Surrogate for dietary
pesticide use vegetables, and grains distribution pesticide exposure to
with detectable residues center in 10 states organophosphate
of organophosphate representing 50% pesticides
pesticides of population
oleti
va,
11(2):439-451,
2006
Table 2 (continued)
Topic area Description of measure Time period Coverage Geographic Notes
resolution
Land contaminants E10: Percentage of 1990-2000 All Superfund Sites specific Does not reflect sites
hazardous waste children residing within sites locations not included on
sites 1 mile of a Superfund site National Priority List.
Surrogate for exposure
Measures for body burdens
Lead in blood B1: Concentration of 1976-2000 US population National Based on representative
lead in bood of children sample of US population
≤5years of age
Lead in blood B2: Median concentrations 1999-2000 US population National Based on representative
of lead in blood of children sample of US population
1-5 years of age by race/ ethnicity and family income
Lead in blood B3: Distribution of 1999-2000 US population National Based on representative
concentrations of lead sample of US population
in blood of children 1-5 years of age
Mercury in blood B4: Distribution of 1999-2000 US population National Based on representative
concentration of mercury sample of US population
in blood of women of child-bearing age
Continine in blood B5: Concentrations 1988-2000 US population National Based on representative
of continine in blood sample of US population
of children
Mensures for childhood diseases and disorders
Respiratory disease D1: Percentage of 1980-2001 US population National Based on representative
children with asthma sample of US population
Respiratory disease D2: Percentage of children 1997- 2000 US population National Based on representative
having an asthma attack sample of US population
in the previous 12 months, by race/ethnicity and family income
Respiratory disease D3: Children's emergency 1992-1999 US population National Based on representative
room visits for asthma and sample of US population
other respiratory causes
Respiratory disease D4: Children's hospital 1980-1999 US population National Based on representative
admissions for asthma and sample of US population
and other respiratory causes
Cancer D5: Cancer incidence 1975-1998 US population National Based on representative
and mortality for children sample of US population
< 20 years of age
Ky
le
,A
.
D
.
et
a
l
.
448
The analysis identified numerous data gaps. For criteria air pollutants, a significant gap is the geographic extent of the monitoring net-work. Even when monitors are assigned by county, many counties have no data. This data gap might be rectified best by additional mod-eling. For hazardous air pollutants, the assess-ment was based on model predictions of ambi-ent concambi-entrations of a certain number of haz-ardous air pollutants. There are two structural limitations for this data source. One is that the modeling is done only every 3 years, and the results are presented several years after the year to which they apply. The second is that the ap-proach includes only a relatively small number of pollutants.
For indoor air pollutants, data do not exist on any large scale. Different approaches to as-sessing indoor air pollutants and indoor envi-ronments as a whole are needed. We believe that surrogate measures will be necessary for indoor pollutants.
For drinking water contaminants, the na-tional data reporting system has the significant limitation that violations, not measured con-centrations, are reported. The latter would be more informative, but such data are available only at the state level. There are also significant limitations on monitoring and reporting.
For food and land contaminants, the data available are very limited. Surrogates were needed in both categories. Substantial addi-tional assessment would be needed to charac-terize these areas fully.
For body burdens, the data available for most contaminants come from the recent mon-itoring programs developed by the CDC.
Be-cause this initiative is relatively new, the data are limited to only a few years.
For diseases, surveys such as the National Health Interview Survey provides a good pic-ture of the population as a whole, but it does not allow for breakout by geographic area or state. The information cannot be put on a com-mon scale with other environmental data or in-formation. For some important health out-comes, such as birth defects, there is no nation-al data source that can be used. Data for neuro-developmental effects are also very limited.
What to include in an assessment is an im-portant consideration. The working definition of “the environment” used for these measures corresponded closely to the mandates of the U.S. EPA. It included environmental agents that can contaminate environmental media re-sulting in exposure. Such agents fall under reg-ulatory mandates of the U.S. EPA. However, many other factors can be viewed as falling un-der the rubric of the environment. It may be more difficult to identify data sources if a more expansive definition of environmental factors is used in future work. Even with this relatively narrow scope, there are significant limits to our understanding of the links between environ-mental factors and health outcomes. In con-ducting an assessment that is geared to report-ing progress and identifyreport-ing areas in need of attention, it is important to consider probable contributors to disease and diseases that are likely caused at least partly by environmental factors, even when these relationships have not been fully established.
It is helpful to look at available information in two ways. It is beneficial to look at toxicology
Table 2 (continued)
Topic area Description of measure Time period Coverage Geographic Notes
resolution
Cancer D6: Cancer incidence 1974-1998 US population National Based on representative
for children < 20 years sample of US population
of age by type
Neurodevelopmental D7: Children reported 1997-2000 US population National Based on representative
disorders to have mental retardation, sample of US population
by race/ethnicity and family income
Designations E, B, and D are from the original report39.
oleti
va,
11(2):439-451,
2006
and other experimental results, to see what can be learned about possible relationships of envi-ronmental factors to health outcomes or related biologic effects. Such literature will be available for compounds that have not been included in epidemiologic studies, including agents for which widespread human exposure has not yet occurred or has not yet been measured. Con-versely, it is useful to consider results of epi-demiologic studies that identify environmental factors that contribute to disease, recognizing that such studies can be conducted only after significant human exposure has occurred.
Defining the type of data appropriate to as-sess components of a conceptual framework is an important step. The commonly used terms “hazard” and “exposure” represent general con-cepts rather than particular approaches to measurement. “Hazard” has been used to refer to several different types of data, including those that reflect production, uses, releases, concentrations in environmental media, and concentrations in exposure media of chemi-cals. All of these types of data can be impor-tant, but they also provide different types of in-formation that can be explicated more careful-ly. Types of “hazard” metrics need to be defined better, and distinctions must be clarified.
Using measures that address different parts of the framework can be informative. Ideally, increasing trends in concentration of environ-mental contaminants or body burdens would lead to further investigation and policy action aimed at reversing the trend. Monitoring trends in illnesses that are both known and suspected of being associated with environ-mental factors is important, given the limita-tions of scientific knowledge of relalimita-tionships between environmental factors and diseases. Increasing trends in illnesses also are worthy of attention and action to identify and address possible causal factors.
Work that focuses on children’s environ-mental health has led to the development of the Multiple Exposure-Multiple Effects (MEME) model33, which emphasizes the multiple
rela-tionships between environmental factors and health outcomes. A single environmental agent or factor may contribute to multiple health out-comes, and a single outcome may be affected by multiple environmental factors. How to address the genuine complexity posed by these “many-to-many” relationships remains an important question. There are different ways in which linkages between environment and health can
be conceptualized and implemented. Because of the multiple relationships between many en-vironmental factors and health outcomes, it would be enormously complex to model all re-lationships or to represent the results of such a model. However, it is possible to synthesize and present available data in ways that identify en-vironmental factors relevant to health and dis-eases or disorders with possible or likely envi-ronmental causes and to show likely relation-ships in ways that are cognizant of the “many-to-many” nature of these relationships.
For future work, it is important to consider what determinants of exposure can be system-atically tracked on a large scale. Exposure of in-dividuals cannot be easily monitored or tracked on a large scale partly because individuals’ ac-tions mediate it. Determinants can be further understood through use of models that inte-grate environmental determinants of exposure with behavioral determinants of exposure, to provide useful data for understanding the rela-tionship between environment and health.
Further development of a concept of deter-minants of population exposure is needed, along with research to better identify these de-terminants. Much of the assessment work con-ducted in environmental health relates to esti-mation of exposure and consequent doses of environmental contaminants for individuals, as well as research on the relationships between such exposures or doses and adverse health outcomes. Such work establishes understand-ing of the relationships between environmental factors and health. However, the primary goal is not to establish such relationships. Rather, it is to identify and track the element that con-tribute to exposure and to adverse health out-comes on a broad scale in ways that are infor-mative to stakeholders and policy communities. The purpose is to identify needs for specific ac-tions to improve health. In this context, it is the determinants of exposure that are, in most cas-es, going to be amenable to measurement or es-timation on a broad scale and also to interven-tion. Further, analysis of such determinants is critical to better linkage between assessment and intervention.
Ky
le
,A
.
D
.
et
a
l
.
450
a beginning to develop such methods, but more needs to be done.
It would also be relevant to consider admin-istrative or policy actions that contribute to the various environmental conditions portrayed. So, for example, permit requirements for power plants have a bearing on emissions of several key air pollutants. Such “administrative” meas-ures could be developed to address these con-cerns, and this process would more directly link results to policy change or evaluation.
An integrated assessment can provide a framework to portray diverse data sources to reflect key elements that affect environmental
health status. It may rely on data generated for a variety of purposes and adapted to forms that can reflect the purposes of the assessment. Ad-ditional challenges include further develop-ment of data sources and measures to address some of the key data gaps; to strengthen the measures for driving forces, sources, and other sectors; to explore the implications of the MEME models; to elucidate better the relation-ship between links in the chain from environ-ment to health; and to identify policy ap-proaches that could reduce the determinants of ill health and promote determinants of good health.
America’s Environmental Public Health Gap. At-lanta, GA: CDC; 2003.
12. Marmagas SW, King LR, Chuk MG. Public health’s response to a changed world: September 11, biologi-cal terrorism, and the development of an environ-mental health tracking network. Am J Pub Health 2003; 93:1226-30.
13. McGeehin MA, Qualters JR, Niskar AS. National en-vironmental public health tracking program: bridg-ing the information gap. Environ Health Perspect 2004; 112:1409-13.
14. California Policy Research Center. Strategies for Es-tablishing an Environmental Health Surveillance System in California. Berkeley: CPRC, University of California; 2004.
15. Institute of Medicine. The Future of Public Health. Washington, DC: IOM; 1988.
16. Parson EA. Integrated assessment and environmen-tal policy making: in pursuit of usefulness. Energy Policy 1995; 23:463-75.
17. Mastrandrea MD, Schneider SH. Probabilistic inte-grated assessment of “dangerous” climate change. Science 2004; 304:571-5.
18. McMichael AJ. Integrated assessment of potential health impact of global environmental change: prospects and limitations. Environ Modeling Assess 1997; 2:129-37.
19. Parson EA, Corell RW, Barron EJ, Burkett V, Janetos A, Joyce L, et al. Understanding climatic impacts, vulnerabilities, and adaptation in the United States: building a capacity for assessment. Clim Change 2003; 57:9-42.
20. Parson EA, Fishervanden K. Integrated assessment models of global climate change. Annu Rev Energy Environ 1997; 22:589-628.
21. Suter GW II. Bottom-up and top-down integration of human and ecological risk assessment. J Toxicol Environ Health A 2004; 67:779-90.
22. Briggs D, Corvalan C, Nurminen M. Linkage Meth-ods for Environment and Health Analysis. Geneva: World Health Organization; 1996. Available from:
References
1. Pew Environmental Health Commission. America’s Environmental Health Gap: Why the Country Needs a Nationwide Health Tracking Network. Companion Report. Baltimore, MD: Johns Hopkins School of Hygiene and Public Health; 2000.
2. Rosenstock L. The environment as a cornerstone of public health. Environ Health Perspect 2003;111: A376-7.
3. World Health Organization. Health and Environment in Sustainable Development: Five Years After the Earth Summit WHO/EHG/97-8. Geneva: WHO; 1997. 4. Mannino DM, Homa DM, Pertowski CA, Ashizawa
A, Nixon LL, Johnson CA, et al. Surveillance for asth-ma – United States, 1960–1995. MMWR CDC Sur-veill Summ 1998; 47(1):1-27.
5. Ries LAG, Smith MA, Gurney JG, Linet M, Tamra T, Young JL,et al., editors. Cancer Incidence and Sur-vival among Children and Adolescents: United States SEER Program 1975-1995. Bethesda, MD: National Cancer Institute, SEER Program; 1999.
6. Blaxill MF. 2004. What’s going on? The question of time trends in autism. Public Health Rep 2004; 119: 536-51.
7. Landrigan PJ, Schechter CB, Lipton JM, Fahs MC, Schwartz J. Environmental pollutants and disease in American children: estimates of morbidity, mortali-ty, and costs for lead poisoning, asthma, cancer, and developmental disabilities. Environ Health Perspect 2002; 110:721-8.
8. Mendola P, Selevan SG, Gutter S, Rice D. Environ-mental factors associated with a spectrum of neu-rodevelopmental deficits. Ment Retard Dev Disabil Res Rev 2002; 8:188-97.
9. Schettler T. Changing patterns of disease: human health and the environment. San Francisco Medicine 2002; 75:10-3.
10. Stein J, Schettler T, Wallinga D, Valenti M. In harm’s way: toxic threats to child development. J Dev Behav Pediatr 2002; 23:S13-S22.
oleti
va,
11(2):439-451,
2006
http://www.who.int/phe/children/en/cehindicpref. pdf [cited 27 January 2006].
23. California Department of Health Services. California Environmental Health Indicators. Oakland: CDHS, Environmental Health Investigations Branch; 2002. 24. von Schirdning Y. Health in Sustainable
Develop-ment Planning: The Role of Indicators. Geneva: World Health Organization; 2002.
25. World Health Organization. Environmental Health Indicators for the WHO European Region: Towards Reporting EUR/03/5039763/1. Copenhagen: WHO, European Region; 2002.
26. World Health Organization. Environmental Health Indicators for the WHO European Region: Survey Methods for Environmental Health Assessments Working Group Report EUR/03/5039763/1. Copen-hagen: WHO, European Region; 2003.
27. U.S. Environmental Protection Agency. Draft Report on the Environment EPA-260-R-02-006. Washington, DC: U.S. EPA, Office of Environmental Information and Office of Research and Development; 2003. 28. Federal Interagency Forum on Child and Family
Sta-tistics. America’s Children in Brief: Key National In-dicators of Well-Being, 2004. Washington, DC: U.S. Government Printing Office; 2004. Available from: http://www.childstats.gov/pubs.asp [cited 27 Janu-ary 2006].
29. National Research Council (NRC). Pesticides in the Diets of Infants and Children. Washington, DC: Na-tional Academy Press; 1993.
30. Tamburlini G, von Ehrenstein OS, Bertollini R, edi-tors. Children’s Health and Environment: A Review of Evidence. A Joint Report from the European Envi-ronment Agency and the WHO Regional Office for Europe. Luxembourg: Office for Official Publica-tions of the European Communities; 2002. 31. Forrest CB, Riley AW. Childhood origins of adult
health: a basis for life-course health policy. Health Aff (Millwood) 2004; 23:155-64.
32. National Research Council (NRC). Children’s Health, the Nation’s Wealth: Assessing and Improving Child Health. Washington, DC: National Academy Press; 2004.
33. Briggs D. Making a Difference: Indicators to Improve Children’s Environmental Health: Geneva: World Health Organization; 2003.
34. North American Commission for Environmental Cooperation. Cooperative Agenda for Children’s Health and the Environment in North America. Council Resolution 02-06. Ottawa, Ontario, Canada; 2002. Available from: http://www.cec.org/files/pdf/ COUNCIL/SR02-00_en.pdf [cited 27 January 2006]. 35. Secretariat of the Commission for Environmental Cooperation of North America. Final Draft: Devel-opment of Indicators of Children’s Health and the Environment in North America. Montreal, Quebec, Canada: Commission for Environmental Coopera-tion of North America; 2003.
36. United Nations. Johannesburg Declaration on Sus-tainable Development. Johannesburg: United Na-tions World Summit on Sustainable Development; 2002. Available from: http://www.un.org/esa/sust-dev/documents/WSSD_POI_PD/English/POI_PD.h tm [cited 27 January 2006].
37. Valent F, Little DA, Tamburlini G, Barbone F. Burden of disease attributable to selected environmental fac-tors and injuries among Europe’s children and ado-lescents. Geneva: World Health Organization; 2004. 38. Woodruff TJ, Axelrad DA, Kyle AD. America’s
Chil-dren and the Environment: A First View of Available Measures. Washington, DC: U.S. Environmental Pro-tection Agency, Office of Children’s Health Protec-tion and Office of Policy, Economics, and Innova-tion, 2000.
39. Woodruff TJ, Axelrad DA, Kyle AD, Miller G, Nweke O. America’s Children and the Environment: Mea-sures of Contaminants, Body Burdens, and Illnesses. Washington, DC: U.S. Environmental Protection Agency, Office of Children’s Health Protection and Office of Policy, Economics, and Innovation; 2003. Available from: http://www.epa.gov/envirohealth/ children/ [cited 27 January 2006].
40. Furgal C, Gosselin P. Challenges and directions for environmental public health indicators and surveil-lance. Can J Public Health 2002; 93(Suppl 1):S5-S8. 41. Centers for Disease Control and Prevention. Second
National Report on Human Exposure to Environ-mental Chemicals. NCEH No. 02-0716. Atlanta, GA: CDC; 2003.
42. Woodruff TJ, Axelrad DA, Kyle AD, Nweke O, Miller GG, Hurley BJ. Trends in environmentally related childhood illnesses. Pediatrics 2004; 113:1133-40. 43. U.S. Department of Health and Human Services.
Healthy People 2010: Understanding and Improving Health. 2nd ed. Washington, DC: U.S. Government Printing Office; 2000.
44. American Academy of Pediatrics Committee on En-vironmental Health. Ambient air pollution: health hazards to children. Pediatrics 2004; 114:1699-707. 45. Canfield RL, Henderson CR Jr, Cory-Slechta DA,
Cox C, Jusko TA, Lanphear BP. Intellectual impair-ment in children with blood lead concentrations be-low 10 microg per deciliter. N Engl J Med 2003; 348:1517-26.
46. Canfield RL, Kreher DA, Cornwell C, Henderson CR Jr. Low-level lead exposure, executive functioning, and learning in early childhood. Neuropsychol Dev Cogn C Child Neuropsychol 2003; 9:35-53. 47. Lanphear BP, Dietrich K, Auinger P, Cox C.
Cogni-tive deficits associated with blood lead concentra-tions < 10 microg/dL in US children and adolescents. Public Health Rep 2000; 115:521-9.
48. McMichael AJ, Baghurst PA, Wigg NR, Vimpani GV, Robertson EF, Roberts RJ. Port Pirie Cohort Study: environmental exposure to lead and children’s abili-ties at the age of four years. N Engl J Med 1988; 319: 468-75.
49. Schwartz J. Low-level lead exposure and children’s IQ: a meta-analysis and search for a threshold. Envi-ron Res 1994; 65:42-55.