Lateral Sclerosis Using RNA-Seq
Marka van Blitterswijk1,2, Eric T. Wang3,4, Brad A. Friedman5,6, Pamela J. Keagle2, Patrick Lowe2, Ashley Lyn Leclerc2, Leonard H. van den Berg1, David E. Housman6, Jan H. Veldink1., John E. Landers2*.
1Department of Neurology, Rudolf Magnus Institute of Neuroscience, University Medical Center Utrecht, Utrecht, The Netherlands,2Department of Neurology, University of Massachusetts Medical Center, Worcester, Massachusetts, United States of America,3Department of Biology, Massachusetts Institute of Technology, Cambridge, Massachusetts, United States of America,4Harvard-MIT Division of Health Sciences and Technology, Cambridge, Massachusetts, United States of America,5Department of Molecular and Cell Biology, Harvard University, Cambridge, Massachusetts, United States of America,6David H. Koch Institute for Integrative Cancer Research, Massachusetts Institute of Technology, Cambridge, Massachusetts, United States of America
Abstract
Amyotrophic lateral sclerosis (ALS) is a neurodegenerative disease resulting in severe muscle weakness and eventual death by respiratory failure. Although little is known about its pathogenesis, mutations in fused in sarcoma/translated in liposarcoma (FUS) are causative for familial ALS. FUS is a multifunctional protein that is involved in many aspects of RNA processing. To elucidate the role of FUS in ALS, we overexpressed wild-type and two mutant forms ofFUSin HEK-293T cells, as well as knocked-down FUSexpression. This was followed by RNA-Seq to identify genes which displayed differential expression or altered splicing patterns. Pathway analysis revealed that overexpression of wild-typeFUSregulates ribosomal genes, whereas knock-down of FUS additionally affects expression of spliceosome related genes. Furthermore, cells expressing mutantFUSdisplayed global transcription patterns more similar to cells overexpressing wild-typeFUSthan to the knock-down condition. This observation suggests that FUS mutants do not contribute to the pathogenesis of ALS through a loss-of-function. Finally, our results demonstrate that the R521G and R522G mutations display differences in their influence on transcription and splicing. Taken together, these results provide additional insights into the function of FUS and how mutations contribute to the development of ALS.
Citation:van Blitterswijk M, Wang ET, Friedman BA, Keagle PJ, Lowe P, et al. (2013) Characterization of FUS Mutations in Amyotrophic Lateral Sclerosis Using RNA-Seq. PLoS ONE 8(4): e60788. doi:10.1371/journal.pone.0060788
Editor:Huaibin Cai, National Institute of Health, United States of America
ReceivedOctober 11, 2012;AcceptedMarch 2, 2013;PublishedApril 8, 2013
Copyright:ß2013 van Blitterswijk et al. This is an open-access article distributed under the terms of the Creative Commons Attribution License, which permits unrestricted use, distribution, and reproduction in any medium, provided the original author and source are credited.
Funding:This work was supported by The Netherlands ALS Foundation; J.R. van Dijk; the Adessium Foundation; the European Community’s Health Seventh Framework Program [grant number 259867]; the Thierry Latran Foundation; the National Institutes of Health/National Institute of Neurological Disorders and Stroke [grant numbers 1R01NS065847, 1R01NS073873]; and the University of Massachusetts Clinical and Translational Science Award Pilot Program [grant number UL1RR031982]. The funders had no role in study design, data collection and analysis, decision to publish, or preparation of the manuscript.
Competing Interests:The authors have declared that no competing interests exist. * E-mail: [email protected]
.These authors contributed equally to this work.
Introduction
Amyotrophic lateral sclerosis (ALS) is a fatal neurodegenerative disease affecting upper and lower motor neurons causing pro-gressive muscle weakness. Patients typically die within three to five years after onset of symptoms due to respiratory failure [1]. Although most cases are sporadic, approximately 10% of ALS cases are familial (FALS). Mutations in several genes are causative for FALS, including fused in sarcoma/translated in liposarcoma (FUS), superoxide dismutase-1 (SOD1), TAR DNA-binding protein (TARDBP), angiogenin (ANG), vesicle-associated membrane pro-tein B (VAPB), optineurin (OPTN), and valosin-containing protein (VCP) [2,3]. Recently, an expanded hexanucleotide repeat (GGGGCC) within chromosome 9 open reading frame 72 (C9ORF72) has also been identified in a large percentage (23.5– 46%) of patients with ALS and frontotemporal dementia (FTD), and additionally, mutations in profilin 1 (PFN1) have been reported in patients with ALS [4–6].
Mutations inFUSare detected in,4% of FALS patients and infrequently in sporadic ALS (SALS) cases [7,8]. FUS is also known as heterogeneous nuclear ribonucleoprotein (hnRNP) P2
Given the role of FUS in RNA processing, it could be hypothesized that mutant FUS contributes to ALS by altering expression of many genes. A very recent study did identify more than 5,500 RNA targets of FUS in mouse and human brain, and showed that depletion of FUS changed at least 600 mRNA levels and 350 splicing patterns [15]. However, the influence of overexpressed wild-type and mutant forms of FUS on global expression has yet to be determined. Towards this goal, we have performed RNA-Seq on cells expressing exogenous wild-typeFUS, two mutant forms of FUS(R521G, R522G) or small interfering RNA (siRNA) againstFUS. The results of this study yield insights into the normal pathways influenced by wild-type FUS and how mutations lead to the pathogenesis of ALS.
Materials and Methods
Plasmid Constructs
Human wild-typeFUS(clone MGC-8537, Invitrogen, Carlsbad, CA) was inserted into a pcDNA3.1 vector containing an N-terminal V5 (Invitrogen) epitope tag with BP and LR Clonase kits (Invitrogen). Mutations located in exon 15 (p.Arg521Gly (R521G [c.C1561G]) and p.Arg522Gly (R522G [c.C1564G])) were generated by using QuikChange II Site-Directed Mutagenesis kit (Stratagene, La Jolla, CA). Sequencing was used to verify the orientation of the inserts and absence of polymerase chain reaction (PCR)-induced mutations.
Cell Culture
HEK-293 cells optimized for transfections (HEK-293T) were cultured in Dulbecco’s Modified Eagle’s medium (DMEM) supplemented with 10% fetal calf serum and 4 mM L-glutamine. Transfections were performed with Lipofectamine 2000 trans-fection reagent (Invitrogen) according to the manufacturer’s recommendations. Cells were transfected with either 4mg of expression constructs or 50.0 rmol Silencer pre-designed siRNA directed againstFUS(s5402, Applied Biosystems, Carlsbad, CA). To test the efficiency of transfections, cells were co-transfected with 0.4mg enhanced green fluorescent protein (pEGFP-C1) plasmid, which expressed GFP (Clontech, Mountain View, CA). After 24 hours the medium was changed to DMEM and cells were analyzed at 48 hours post-transfection. Transfection efficiencies for all conditions were greater than 75%, as determined by immunofluorescence staining.
Preparation of Cell Lysates
Transfected cells were washed in phosphate-buffered saline (PBS) and then detached with a cell scraper. An aliquot of the cell suspension was centrifuged, resuspended in TENN buffer (50 mM Tris-HCl [pH 7.4], 5 mM EDTA, 150 mM NaCl, 0.5% Nonidet P-40) with Protease Inhibitor Cocktail (Roche, Basel, Switzerland) and analyzed by western blot. Western blot analysis was performed using the following antibodies: rabbit anti-FUS (1:5,000, Bethyl Laboratories, Montgomery, TX, A300-302A), mouse anti-V5 (1:5,000, Invitrogen, catalog #
37-7500), rabbit anti-glyceraldehyde 3-phosphate dehydrogenase (GAPDH, 1:15,000; Abcam, Cambridge, UK, catalog #
Ab22555), Odyssey IRDye anti-rabbit IgG (1:20,000) and Odyssey IRDye anti-mouse IgG (1:20,000). The Odyssey Infrared Imaging System (Li-cor, Lincoln, NE) was used for quantification of western blots. RNA was isolated from the remaining cell suspension according to the RNeasy Mini Kit protocol (Qiagen, Hilden, Germany).
RNA-Seq and Data Analysis
RNA-Seq libraries were generated as described previously [16]. Briefly, polyA+RNA was reverse transcribed using Superscript III and converted to double-stranded cDNA. Illumina adapters were ligated and libraries were amplified by PCR and size selected by gel electrophoresis prior to sequencing on an Illumina Genome Analyzer (Illumina, San Diego, CA). Analysis of RNA-Seq was performed utilizing software package ExpressionPlot [17]: gene expression levels were estimated by counting the number of reads mapping to constitutive exons for each gene and determining RPKM values (reads per kilobase of exon model per million uniquely mapped reads). P-values were calculated using the Fisher’s exact test for pairwise comparison between samples, which is shown to be conservative, as described elsewhere [17]. For skipped exon analysis, P-values were determined based on the ratio of inclusion reads to the sum of skipping and flanking reads (Materials and Methods S1 in File S1) using Fisher’s exact test. For intron retention analysis, P-values were calculated using the Fisher’s exact test based on the comparison of inclusion and flanking reads between conditions (Materials and Methods S1 in File S1). Plots demonstrating the distribution of data by showing the log intensity ratio (M) and the average log intensity for a dot (A, [MA plots]) per condition comparison did not display expression level dependent differential signals (Figure S1 in File S1).
Events with Ensemble gene identifiers were subjected to further analysis. For the differential expression analysis, events without RPKM units were excluded. After Bonferroni multiple test correction, significant events (P-value ,0.05) were selected and used to perform functional annotation and functional domain analysis by Kyoto Encyclopedia of Genes and Genomes (KEGG) pathway analysis. Details of all significant events can be found in the Supplementary spreadsheet in File S2. To avoid length-dependent bias [18], two different background lists were initially utilized: theHomo sapiensbackground list as supplied by Database for Annotation, Visualization and Integrated Discovery (DAVID) Functional Annotation Tool (http://david.abcc.ncifcrf.gov/home. jsp) and the list generated from cells transfected with the vector alone. However, the results from the two approaches displayed few differences. Therefore, only analysis using the Homo sapiens
background list is reported for all conditions. Venn diagrams were generated comparing the vector condition to wild-type FUS, the two FUS mutants and siRNA againstFUS, using an online tool (http://bioinfogp.cnb.csic.es/tools/venny/index.html). Our data has been deposited to the ExpressionPlot Web Server (http://als-research.dyndns-server.com/cgi-bin/expressionplot/home.pl) [17], and will be accessible from the date of publication.
PCR
TCCTTCAGCTAAGG-CAGCCATTGA/GGCTCATTGCACTGATTGCAGGAA, (3) threonyl-tRNA synthetase (TARS) TTTGAGGATGAG-GAAGCTCAGGCA/TTGCCCGTGTGTCTAACATGAGGA, (4) translocated promoter region, nuclear basket protein (TPR) AACAACTCCGCAAATCACGACAGC/TGTTTAAGGG-CAGCCTTAGCCTCT, (5) amyloid beta (A4) precursor protein (APP) ACCAACCAGTGACCATCCAGAACT/CAGCAA-CATGCCGTAGTCATGCAA, and (6) hematological and neu-rological expressed 1 (HN1) TGGGTTTACCAAGCCT-CAACTGGA/AGGAAGACCCGCTTCAGTGTGATT. For differential expression analysis, threshold cycle (Ct) values were collected in quadruplicate for each condition, and delta-Ct values were normalized using GAPDH values for the same condition. Hereafter, the average Ct value for the reference condition was subtracted from the normalized Ct values (delta-delta-Ct) and the fold decrease change was calculated (2ˆ(delta-delta-Ct)). Sub-sequently, the relative expression and log2 fold changes were determined.
For the confirmation of alternative splicing RNA-Seq results, semi-quantitative PCR was performed using primers derived from the upstream and downstream exons. Two genes (PRPF8 and
RPS24) displaying a minimal log2 fold change in exon exclusio-n:inclusion of 0.4 (.1.32 fold change) were chosen for confirma-tion. Quadruplicate reverse transcribed PCR products were separated on a 2% gel, and bands were analyzed with ImageJ (http://rsbweb.nih.gov/ij/). For each condition, an unspliced:s-pliced ratio and log2 fold change were calculated. Primer pairs used for this reaction are as follows: (1) pre-mRNA-processing-splicing factor 8 (PRPF8) TTGGGAATCTGGTTCAGTCC/ GGCACACACTGGCTTATGAT, and (2) ribosomal protein S24 (RPS24) ATGAAGAAAGTCAGGGGGACTG/ TAATGTTCTTGCGAAAAATCCAC. A general linear model was fitted with delta-delta-Ct values or unspliced:spliced values as dependent variable, and all conditions as categorical independent variable, using the appropriate condition as reference (e.g. wild-type FUS, when comparing one mutant with wild-wild-type FUS).
Results
To investigate the global effects of wild-type and mutant FUS protein on cellular transcription and splicing, HEK-293T cells were transfected with expression vectors encoding wild-type FUS, two FUS mutants (R521G and R522G) or siRNA directed against
FUS. Transfection with an empty vector served as a control condition. RNA-Seq resulted in 24 to 31 million reads for each transfection condition (Table S1 in File S1). Quality control assessments revealed that.69.9% of reads uniquely mapped to the genome and less than 2.72% of reads were derived from ribosomal RNA (Table S1 in File S1). Analysis of RNA-Seq data demonstrated that cells expressing either wild-type or mutantFUS
displayed a,2-fold increase in expression, whereas cells harboring siRNA displayed a,4-fold decrease inFUSexpression (Figure S2 in File S1). Interestingly, western blot analysis of an aliquot of transfected cells used for RNA-Seq displayed lower levels of overexpression ofFUSmutants relative to the wild-type, suggesting that post-transcriptional regulation may influence FUS protein levels (Figure S3 in File S1).
Pathway analysis was performed for differential expressed genes using the DAVID Functional Annotation Tool (Materials and Methods). This analysis revealed that overexpression of wild-type
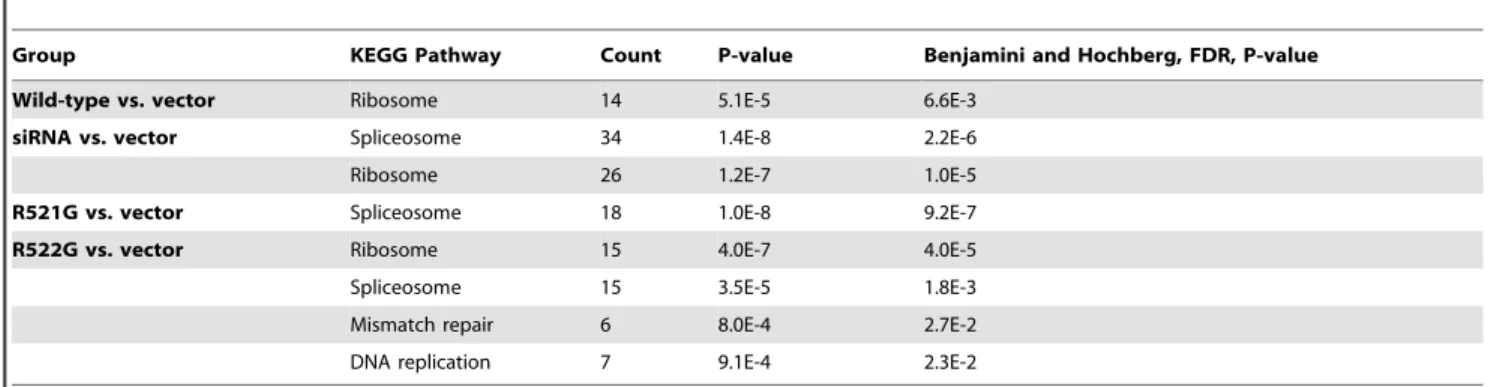
FUS (wild-type FUS vs. vector alone) influences expression of ribosomal related genes, whereas knock-down ofFUSexpression (siRNA vs. vector alone) influences expression of both ribosome and spliceosome related genes (Table 1, Table S2 in File S1). The
differentially expressed genes encoded several ribosomal proteins, aspartic acid, glutamic acid, alanine, and aspartic acid (DEAD) box proteins, RNA-binding motif proteins, hnRNPs, and splicing factors (Table S3 in File S1). Further analysis revealed that the differentially expressed genes often encoded proteins containing RRMs, endoplasmic reticulum (ER) targeting sequences, and nucleotide-binding alpha-beta plaits (Table S4 in File S1).
To understand the mechanism by which FUS mutants may contribute to ALS pathogenesis, we determined whether the expression patterns induced by mutant FUS were more similar to reducedFUSexpression or overexpressed wild-typeFUS. Similar-ity to reduced expression ofFUSwould suggest that the mutants act by a loss-of-function mechanism, whereas similarity to overexpressed wild-type FUS would suggest a gain-of-function for the mutants. Towards this end, the number of differentially expressed genes between each of the two FUS mutants and either siRNA or wild-type FUS conditions was calculated. As shown in Table 2, both the R521G and R522G mutants displayed an increased number of differentially expressed genes when com-pared to reducedFUSexpression than to overexpressed wild-type conditions (P-value ,0.0001 for both). In other words, the transcriptional profiles of cells expressing thisFUS mutant more closely resembled that of overexpressed wild-type FUS than of reduced levels of FUS. These results suggested that the FUS mutants do not contribute to ALS pathogenesis through a loss-of-function.
To investigate whether the two FUS mutants differed in their influence on transcription, the direction of change for differentially expressed genes was compared. Interestingly, although the total number of genes that was regulated by R521G and R522G was not significantly different, there was a significant difference in the number of genes that was up/down-regulated. As shown in Table 3, R521G dramatically favored up-regulation of the differentially identified genes, whereas R522G favored down-regulation. Despite the fact that the two FUS mutants appeared to have opposite effects on differential gene expression, pathway analysis revealed that both mutants significantly influenced spliceosome related genes (Table 1). Additionally, the R522G mutant also altered ribosome, mismatch repair and DNA replication related genes. The identified genes encoded, amongst others, DEAD box proteins, hnRNPs, splicing factors, ribosomal proteins, exonuclease, replication factors, mini-chromosome maintenance complex components, and proliferating cell nuclear antigen (Table S3 in File S1). The most significantly enriched protein domains were RRMs, nucleotide-binding alpha-beta plaits and helicases (Table S4 in File S1).
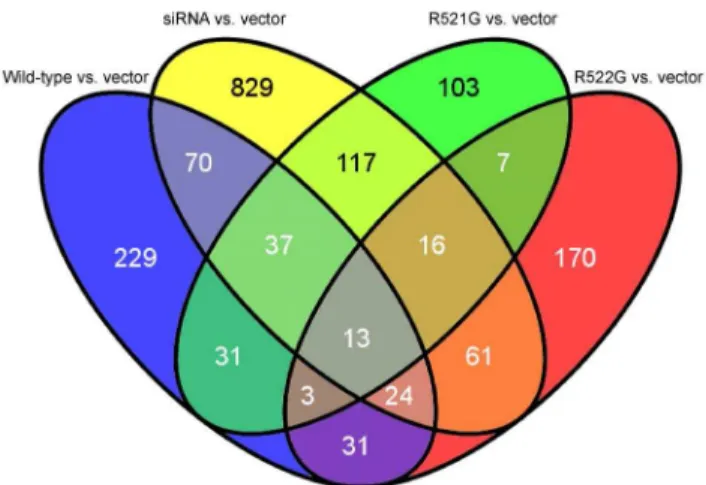
Venn diagrams were generated (Figure 1) to identify genes shared amongst conditions. When both mutants, wild-type FUS and siRNA, directed againstFUS,were compared to the vector condition, 13 genes were revealed (Table 4), including HN1, ribosomal protein S3, S16, S19 (RPS3, RPS16, RPS19), CCR4-NOT transcription complex, subunit 1 (CNOT1), and RNA component of mitochondrial RNA processing endoribonuclease (RMRP).
To assess the reliability of our RNA-Seq differential expression analysis, we attempted to validate a subset by qRT-PCR. Towards this end, we selected 10 significant expression differences from 6 different genes observed by our RNA-Seq results (RBM25,TAF15,
TARS,TPR,APP, andHN1) for validation. Through our analysis, we were able to validate 8 out of the 10 observed expression changes by qRT-PCR (Figure S4 in File S1), suggesting that our RNA-Seq results are reliable.
overexpressed wild-typeFUSto vector transfected cells resulted in only 32 significant events and did not reveal any functional pathways enriched by these events (Table S2 in File S1). In contrast, knock-down ofFUSexpression resulted in 579 significant changes in skipped exons splicing patterns. These changes were enriched in ribosome and spliceosome related genes (Table S2 in File S1). Pathway analysis of the R521G mutant revealed involvement of ribosome related genes, whereas the R522G mutant also affected spliceosome related genes (Table S2 in File S1). Additionally, we detected a small significant difference in the number of genes that were affected by R521G and R522G mutations, but there was no significant difference in the direction of this change (Table 5). Semi-quantitative PCR of two alternatively spliced genes, PRPF8 and RPS24, demonstrated similar splicing patterns by both techniques (Figure S5 in File S1). To further investigate the influence of FUS on alternative splicing, we similarly analyzed our results for genes displaying changes in retained introns. Overexpression of wild-type FUS
revealed 3,116 significant retained intron events. Pathway analysis showed these event were enriched in spliceosome, Huntington’s disease, proteasome, Parkinson’s disease, oxidative phosphoryla-tion, cell cycle, DNA replicaphosphoryla-tion, and pyrimidine metabolism related genes (Table S2 in File S1). Down-regulation of FUS
resulted in 3,054 significant retained intron events that were involved in the same pathways. There was a significant difference in the number of genes that were affected by R521G and R522G (P-value 5.2E-08). The direction of this change was significantly different as well: the R522G mutant displayed increased intron
retention relative to the R521G mutant (Table 6). Pathway analysis revealed enrichment for genes related to the spliceosome, Huntington’s disease, proteasome, DNA replication, cell cycle, pyrimidine metabolism oxidative phosphorylation, and RNA polymerase (Table S2 in File S1).
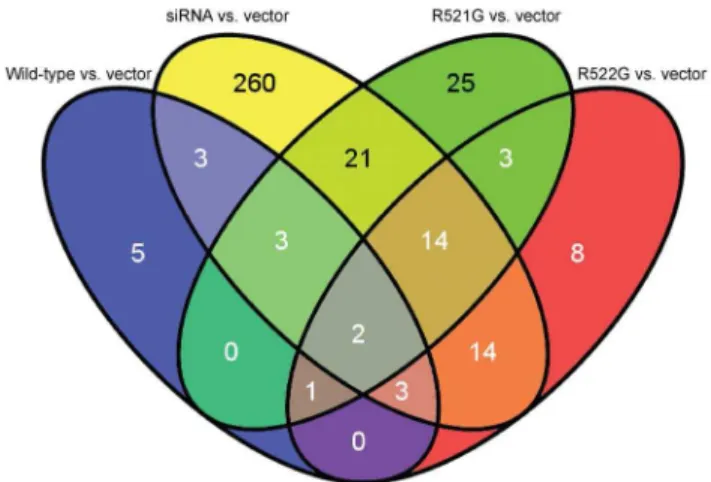
We created Venn diagrams to determine which genes were shared amongst all conditions for both alternative splicing analyses. A Venn diagram of skipped exon analysis identified two genes (Figure 2): ribosomal protein L34 (RPL34) and protein kinase, DNA-activated, catalytic polypeptide (PRKDC). Retained intron analysis identified 1,099 genes (Figure 3); pathway analysis of these genes resulted in 15 significant KEGG pathways (Table 7). The most significant pathways were related to the spliceosome, Huntington’s disease, DNA replication, the proteasome, and pyrimidine metabolism (Table S5 in File S1).
Discussion
To study the effects of wild-type and mutant forms of FUS, we utilized RNA-Seq analysis to investigate alterations in gene expression and alternative splicing. Our results show that wild-type FUS affects ribosomal and spliceosome related genes, and that proteins containing RRMs and nucleotide-binding alpha-beta plaits were most frequently influenced, confirming the important role of FUS in RNA processing pathways [8]. This role is strengthened by previous reports; it has already been shown that FUS associates with products of RNA polymerase II transcription, forms complexes with hnRNPs, and represses RNA polymerase III transcription [19–21]. Furthermore, FUS inhibits the acetyltrans-ferase activities of CREB-binding protein (CBP) and p300 on cyclin D1 (CCND1) [22], and regulates the transcription factor nuclear factor kB (NF-kB) [23,24]. FUS also engages in rapid nucleocytoplasmic shuttling [25], associates with actin-dependent Table 1.Functional pathway analysis of differentially expressed genes.
Group KEGG Pathway Count P-value Benjamini and Hochberg, FDR, P-value
Wild-type vs. vector Ribosome 14 5.1E-5 6.6E-3
siRNA vs. vector Spliceosome 34 1.4E-8 2.2E-6
Ribosome 26 1.2E-7 1.0E-5
R521G vs. vector Spliceosome 18 1.0E-8 9.2E-7
R522G vs. vector Ribosome 15 4.0E-7 4.0E-5
Spliceosome 15 3.5E-5 1.8E-3
Mismatch repair 6 8.0E-4 2.7E-2
DNA replication 7 9.1E-4 2.3E-2
FDR = False Discovery Rate. doi:10.1371/journal.pone.0060788.t001
Table 2.Number of differentially expressed genes by mutant FUS,FUSoverexpression, andFUSknock-down.
Wild-type (n)
siRNA (n)
Fisher’s exact, P-value
R521G Significant 566 863 5.4E-17
Non-significant 17,122 16,511
R522G Significant 1,198 1,937 7.4E-47 Non-significant 16,610 15,583
R521G Up-regulated 509 423 1.3E-62 Down-regulated 57 440
R522G Up-regulated 112 88 1.6E-07
Down-regulated 1,086 1,849
doi:10.1371/journal.pone.0060788.t002
Table 3.The FUS R521G mutant causes increased up-regulation of genes as compared to the R522G mutant.
R521G
(n) R522G (n)
Fisher’s exact, P-value
Vector Significant 332 328 0.78
Non-significant 17,052 17,214
Vector Increased expression 297 8 3.7E-134 Decreased expression 35 320
motor protein myosin Va (MyoVa) [26,27], and is a component of RNA granules that transport mRNAs [28]. Splicing factors, such as serine and arginine (SR) proteins, form complexes with FUS and removal of FUS from the nuclear extract causes disturbances of the splicing factor equilibrium [29]. Additionally, photoactiva-table ribonucleoside-enhanced cross-linking and immunoprecipi-tation (PAR-CLIP) analysis has shown that FUS binds RNA at high frequency, and preferably near splice acceptors [30]. Very recently, high-throughput sequencing and computational ap-proaches demonstrated FUS binding sites in thousands of mouse and human brain pre-mRNAs [15]. Moreover, in mice, FUS depletion with single-stranded antisense oligonucleotides (ASOs) resulted in up-regulation of 275 genes, down-regulation of 355 genes, and 374 splicing events [15].
FUS shows several structural and functional similarities with transactive response DNA-binding protein 43 (TDP-43) [31].
Mutations in TARDBP, which encodes TDP-43, have been identified in,5% of ALS patients [32]. Similar to FUS, the role of TDP-43 is diverse and includes transcriptional regulation, splicing inhibition, regulation of mRNA transport, repression of translation, and mRNA degradation [8]. Recently, it has been shown that TDP-43 interacts with a diverse spectrum of RNAs with important functions in the brain [33]. Depletion of TDP-43 from mouse adult brain resulted in a reduction of long introns, which encode proteins involved in synaptic activity [34]. Deep sequencing further identified more than 4,300 TDP-43 RNA-binding partners in rat cortical neurons [35]. These RNA partners were particularly enriched for genes related to synaptic function, RNA metabolism, and neuronal development [35]. Thus, RNA targets of both FUS and TDP-43 emphasize that alterations in RNA processing pathways play a central role in neurodegenerative diseases [31,32].
In the present study, we have revealed that FUS mutants are more similar to overexpression of wild-type FUS than to our knock-down condition. These results suggest that mutants do not contribute to ALS pathogenesis through a loss-of-function, and are supported by recent findings. Caenorhabditis elegans expressing mutant FUS, for instance, demonstrated adult-onset, age-de-pendent loss of motility, progressive paralysis and neuronal degeneration [36]; although mutant phenotypes could be rescued by methylene blue [37], this could not be established by Figure 1. Venn diagram of differentially expressed genes.A
comparison between each condition (wild-type FUS, siRNA againstFUS
and mutants) and the vector reveals that 13 differentially expressed genes are shared amongst them (Table 4).
doi:10.1371/journal.pone.0060788.g001
Table 4.Genes shared amongst all conditions for differential expression analysis and skipped exon analysis as shown by Venn diagrams.
Gene Description
Differential expression HN1 hematological and neurological expressed 1 RPS3 ribosomal protein S3
HSPA5 heat shock 70 kDa protein 5
RPS16 ribosomal protein S16
RPS19 ribosomal protein S19
FLNA filamin A, alpha, actin-binding protein
CNOT1 CCR4-NOT transcription complex, subunit 1, transcription repressor
CALM3 calmodulin 3 (phosphorylase kinase, delta)
NFKB2 nuclear factor of kappa light polypeptide gene enhancer in B-cells 2 (p49/p100)
PLK1 polo-like kinase 1, serine/threonine-protein kinase
RMRP RNA component of mitochondrial RNA processing endoribonuclease
EIF4G2 eukaryotic translation initiation factor 4 gamma, 2
NCL nucleolin, synthesis and maturation of ribosomes
Exon skipping RPL34 ribosomal protein L34
PRKDC protein kinase, DNA-activated, catalytic polypeptide
doi:10.1371/journal.pone.0060788.t004
Table 5.The FUS R521G mutant induces increased skipping of exons relative to the R522G mutant.
R521G (n) R522G (n)
Fisher’s exact, P-value
Vector Significant 106 64 0.0031
Non-significant 65,812 63,215
Vector Increased skipping 42 30 0.35 Decreased skipping 64 34
overexpressing wild-type FUS [38]. These findings are further substantiated by reports that transgenic mice overexpressing wild-typeFUSdeveloped an aggressive phenotype with limb paralysis and death by twelve weeks in homozygous animals [39], and that
FUS mutations in Drosophila appeared to cause adult-onset neurodegeneration via a gain-of-toxicity [40]. Whether mutations inFUSare indeed causative for ALS through a gain-of-function mechanism is, however, still a matter of debate, especially since other studies have advocated a loss-of-function mechanism [15,32,41–43].
Our analysis also identified differences between R521G and R522G FUS mutants. Differential expression analysis demon-strated that these mutations appeared to have opposite effects on transcriptional regulation. Moreover, both mutations influenced the spliceosome, but the R522G mutation also altered genes involved in ribosomal processes, mismatch repair, and DNA replication. In addition, analysis of skipped exons revealed that both FUS mutants affected ribosomal genes; the R522G mutant influenced spliceosome related genes as well. Retained intron analysis displayed that intron retention was more frequently detected for R522G than for R521G, suggesting that R522G mutations cause more profound changes than R521G mutations. Previously, R521G and R522G mutations have been studied in several experimental models. Yeast strains have been developed expressing wild-type and mutantFUS[44–47]. Overexpression of both resulted in punctuate aggregates in the cytoplasm; R521G aggregated with very similar kinetics to wild-type FUS in protein aggregation assays [44–47].In vitrostudies, demonstrated that the R521G mutant caused a relatively mild cytoplasmic mislocaliza-tion, whereas R522G caused a strong mislocalization [48]. The R522G mutant was also investigated in neuroblastoma cells, and was shown to predominantly accumulate in the cytoplasm and formed aggregates varying in size and shape [49]. InCaenorhabditis elegans, the motor function and lifespan of animals expressing R521G mutations was indistinguishable from wild-type FUS, whereas R522G mutations caused a significant decrease in motor function and lifespan [38]. These observations suggest that FUS mutants may act through differing but converging mechanisms leading to ALS.
Researchers planning on pursuing differential expression or altered splicing observations from any transcriptome-wide study should always confirm results through an alternative method. Here, we have attempted to address the reliability of our RNA-Seq data through validation by RT-PCR (differential expression) and semi-quantitative PCR (exon skipping). Among the specific molecular targets that were affected by FUS, we validated the expression patterns ofRBM25,TAF15,TARS,TPR, andAPP, and the alternative splicing ofPRPF8 and RPS24. In the differential expression analysis, as well as the skipped exons and retained introns analyses, proteins with spliceosomal and ribosomal
functions were among the most prominent molecular targets. These results underscore the function of FUS in the translation of mRNA to proteins, and splicing of introns from pre-mRNAs, respectively.
In addition to caveats of analyzing RNA-Seq data on an individual gene level, we have additionally performed KEGG pathway analysis. This methodology is highly dependent on the selection of a proper reference gene list. There is extensive literature on random lists of genes that appear to be ‘‘enriched’’ for specific pathways [50], which emphasizes the importance of using an appropriate reference list. Many studies use a specific platform to acquire data, which, by definition, could enrich itself. For RNA-Seq data a potential length-dependent bias has to be considered as well [18]. We addressed this issue by using both our successfully sequenced transcripts and theHomo sapiensbackground list from DAVID as reference lists; this minimized bias, although we cannot completely exclude the possibility of residual bias. Furthermore, technical limitations hampered our ability to detect splicing events, for instance, our reads were relatively short as compared to the improved methods that are currently available.
To summarize, we have shown that FUS is implicated in the regulation of ribosomal and spliceosome related genes, highlight-Table 6.The FUS R522G mutant induces increased retention
of introns relative to the R521G mutant.
R521G (n) R522G (n)
Fisher’s exact, P-value Vector Significant 2,932 2,521 5.2E-08
Non-significant 109,789 109,655
Vector Increased retention 621 1,086 6.3E-68 Decreased retention 2,311 1,435
doi:10.1371/journal.pone.0060788.t006
Figure 2. Venn diagram of genes demonstrating exon skip-ping.Two overlapping genes are identified when significant splicing events are compared between conditions (Table 4).
doi:10.1371/journal.pone.0060788.g002
ing the importance of RNA processing pathways in the pathogenesis of ALS. Furthermore, the expression changes induced by FUS mutants suggest that they do not contribute to ALS pathogenesis through a loss-of-function. Finally, our results demonstrate that R521G and R522G mutations display differ-ences in their influence on transcription and splicing. Taken together, these observations provide additional insights into the normal function of FUS and how mutations lead to the development of ALS.
Supporting Information
File S1 This file includes supporting materials and methods, Tables S1–S5, and Figures S1–S5. Legends for Figure S1–S5 are as follows: Figure S1. MA plots per condition comparison. MA plots per comparison where M = log (rpkmcondition) – log (rpkmvector) and A = 0.5 * (log (rpkmcondition)+log (rpkmvector)).Figure S2. FUSgene expres-sion levels measured by RNA-Seq. Reads per kilobase of exon model per million uniquely mapped reads (RPKM) counts are displayed for each condition. Transfections with wild-type
FUS, R521G and R522G resulted in a ,2-fold increase in expression level, transfections with siRNA in a,4-fold decrease in expression level.Figure S3. FUS protein levels measured by western blot.The same samples were used for western blotting and RNA-Seq. We stained for FUS and the V5-tag (Materials and Methods), and bands were subsequently detected and quantified with an Odyssey Infrared Imaging System. For FUS, we compared each condition to the vector and calculated relative integrated intensities. We demonstrated that siRNA caused a decrease inFUSexpression (1.0 versus 0.2), whereas transfections
with wild-type FUSand the two mutants caused an increase in
FUSexpression (1.0 versus 4.2, 1.8 and 1.1). The multiple bands detected by FUS antibodies have been observed previously [51]. Figure S4. Correlation of RNA-Seq and RT-PCR for RBM25,TAF15,TARS,TPR,APPandHN1.We selected 10 differentially expressed conditions within six genes for RT-PCR validation. These genes required at least one comparison with a log2fold change of 0.4 (1.32 fold change). For each comparison, the log2 fold change and corresponding P-values are shown. Validation was observed in 8 out of 10 comparisons for 5 out of 6 genes. Figure S5. Correlation of RNA-Seq and Semi-quantitative PCR forPRPF8andRPS24.Two alternatively spliced genes, pre-mRNA-processing-splicing factor 8 (PRPF8) and ribosomal protein S24 (RPS24), with a log2 fold change in exon exclusion:inclusion above 0.4, (1.32 fold-change) were selected for RT-PCR. The log2fold change and corresponding P-values are shown. RNA-Seq results were validated by semi-quantitative PCR in both cases.
(PDF)
File S2 This Excel spreadsheet file contains detail of all significant events observed from the RNA-Seq analysis. (XLS)
Author Contributions
Conceived and designed the experiments: MVB ETW BAF PJK PL ALL LHVDB DEH JHV JEL. Performed the experiments: MVB ETW BAF PJK PL ALL. Analyzed the data: MVB ETW BAF PJK PL ALL JHV JEL. Contributed reagents/materials/analysis tools: ETW BAF. Wrote the paper: MVB JHV JEL.
References
1. Rowland LP, Shneider NA (2001) Amyotrophic lateral sclerosis. N Engl J Med 344: 1688–1700.
2. Andersen PM, Al-Chalabi A (2011) Clinical genetics of amyotrophic lateral sclerosis: what do we really know? Nat Rev Neurol 7: 603–615.
3. van Blitterswijk M, van Es MA, Hennekam EA, Dooijes D, van Rheenen W, et al. (2012) Evidence for an oligogenic basis of amyotrophic lateral sclerosis. Hum Mol Genet 21: 3776–3784.
4. DeJesus-Hernandez M, Mackenzie IR, Boeve BF, Boxer AL, Baker M, et al. (2011) Expanded GGGGCC hexanucleotide repeat in noncoding region of C9ORF72 causes chromosome 9p-linked FTD and ALS. Neuron 72: 245–256. 5. Renton AE, Majounie E, Waite A, Simon-Sanchez J, Rollinson S, et al. (2011) A hexanucleotide repeat expansion in C9ORF72 is the cause of chromosome 9p21-linked ALS-FTD. Neuron 72: 257–268.
Table 7.Functional pathway analysis of shared genes for retained introns analysis as shown by Venn diagram.
KEGG Pathway Count P-value Benjamini and Hochberg, FDR, P-value
Spliceosome 43 1.9E-16 3.6E-14
Huntington’s disease 42 5.6E-10 4.5E-8
DNA replication 16 4.0E-8 2.2E-6
Proteasome 18 6.1E-8 2.5E-6
Pyrimidine metabolism 25 3.2E-7 1.0E-5
RNA polymerase 12 5.5E-6 1.5E-4
Cell cycle 27 5.6E-6 1.3E-4
Parkinson’s disease 27 8.9E-6 1.8E-4
Purine metabolism 30 1.1E-5 2.0E-4
Aminoacyl-tRNA biosynthesis 14 1.2E-5 2.0E-4
Oxidative phosphorylation 25 1.0E-4 1.5E-3
Alzheimer’s disease 28 2.5E-4 3.4E-3
Nucleotide excision repair 12 5.9E-4 7.4E-3
Mismatch repair 8 1.8E-3 2.0E-2
Citrate cycle (TCA cycle) 9 2.7E-3 2.8E-2
6. Wu CH, Fallini C, Ticozzi N, Keagle PJ, Sapp PC, et al. (2012) Mutations in the profilin 1 gene cause familial amyotrophic lateral sclerosis. Nature 488: 499–503. 7. Mackenzie IR, Rademakers R, Neumann M (2010) TDP-43 and FUS in amyotrophic lateral sclerosis and frontotemporal dementia. Lancet Neurol 9: 995–1007.
8. van Blitterswijk M, Landers JE (2010) RNA processing pathways in amyotrophic lateral sclerosis. Neurogenetics 11: 275–290.
9. Calvio C, Neubauer G, Mann M, Lamond AI (1995) Identification of hnRNP P2 as TLS/FUS using electrospray mass spectrometry. RNA 1: 724–733. 10. Gal J, Zhang J, Kwinter DM, Zhai J, Jia H, et al. (2011) Nuclear localization
sequence of FUS and induction of stress granules by ALS mutants. Neurobiol Aging 32: 2323 e2327–2340.
11. Kwiatkowski TJ Jr, Bosco DA, Leclerc AL, Tamrazian E, Vanderburg CR, et al. (2009) Mutations in the FUS/TLS gene on chromosome 16 cause familial amyotrophic lateral sclerosis. Science 323: 1205–1208.
12. Vance C, Rogelj B, Hortobagyi T, De Vos KJ, Nishimura AL, et al. (2009) Mutations in FUS, an RNA processing protein, cause familial amyotrophic lateral sclerosis type 6. Science 323: 1208–1211.
13. Deng HX, Zhai H, Bigio EH, Yan J, Fecto F, et al. (2010) FUS-immunoreactive inclusions are a common feature in sporadic and non-SOD1 familial amyotrophic lateral sclerosis. Ann Neurol 67: 739–748.
14. Pokrishevsky E, Grad LI, Yousefi M, Wang J, Mackenzie IR, et al. (2012) Aberrant localization of FUS and TDP43 is associated with misfolding of SOD1 in amyotrophic lateral sclerosis. PLoS One 7: e35050.
15. Lagier-Tourenne C, Polymenidou M, Hutt KR, Vu AQ, Baughn M, et al. (2012) Divergent roles of ALS-linked proteins FUS/TLS and TDP-43 intersect in processing long pre-mRNAs. Nat Neurosci.
16. Wang ET, Sandberg R, Luo S, Khrebtukova I, Zhang L, et al. (2008) Alternative isoform regulation in human tissue transcriptomes. Nature 456: 470– 476.
17. Friedman BA, Maniatis T (2011) ExpressionPlot: a web-based framework for analysis of RNA-Seq and microarray gene expression data. Genome Biol 12: R69.
18. Oshlack A, Wakefield MJ (2009) Transcript length bias in RNA-seq data confounds systems biology. Biol Direct 4: 14.
19. Zinszner H, Albalat R, Ron D (1994) A novel effector domain from the RNA-binding protein TLS or EWS is required for oncogenic transformation by CHOP. Genes Dev 8: 2513–2526.
20. Bertolotti A, Lutz Y, Heard DJ, Chambon P, Tora L (1996) hTAF(II)68, a novel RNA/ssDNA-binding protein with homology to the pro-oncoproteins TLS/ FUS and EWS is associated with both TFIID and RNA polymerase II. EMBO J 15: 5022–5031.
21. Tan AY, Manley JL (2010) TLS inhibits RNA polymerase III transcription. Mol Cell Biol 30: 186–196.
22. Wang X, Arai S, Song X, Reichart D, Du K, et al. (2008) Induced ncRNAs allosterically modify RNA-binding proteins in cis to inhibit transcription. Nature 454: 126–130.
23. Goransson M, Andersson MK, Forni C, Stahlberg A, Andersson C, et al. (2009) The myxoid liposarcoma FUS-DDIT3 fusion oncoprotein deregulates NF-kappaB target genes by interaction with NFKBIZ. Oncogene 28: 270–278. 24. Uranishi H, Tetsuka T, Yamashita M, Asamitsu K, Shimizu M, et al. (2001)
Involvement of the pro-oncoprotein TLS (translocated in liposarcoma) in nuclear factor-kappa B p65-mediated transcription as a coactivator. J Biol Chem 276: 13395–13401.
25. Zinszner H, Sok J, Immanuel D, Yin Y, Ron D (1997) TLS (FUS) binds RNA in vivo and engages in nucleo-cytoplasmic shuttling. J Cell Sci 110 (Pt 15): 1741– 1750.
26. Selamat W, Jamari I, Wang Y, Takumi T, Wong F, et al. (2009) TLS interaction with NMDA R1 splice variant in retinal ganglion cell line RGC-5. Neurosci Lett 450: 163–166.
27. Yoshimura A, Fujii R, Watanabe Y, Okabe S, Fukui K, et al. (2006) Myosin-Va facilitates the accumulation of mRNA/protein complex in dendritic spines. Curr Biol 16: 2345–2351.
28. Belly A, Moreau-Gachelin F, Sadoul R, Goldberg Y (2005) Delocalization of the multifunctional RNA splicing factor TLS/FUS in hippocampal neurones: exclusion from the nucleus and accumulation in dendritic granules and spine heads. Neurosci Lett 379: 152–157.
29. Meissner M, Lopato S, Gotzmann J, Sauermann G, Barta A (2003) Proto-oncoprotein TLS/FUS is associated to the nuclear matrix and complexed with splicing factors PTB, SRm160, and SR proteins. Exp Cell Res 283: 184–195. 30. Hoell JI, Larsson E, Runge S, Nusbaum JD, Duggimpudi S, et al. (2011) RNA
targets of wild-type and mutant FET family proteins. Nat Struct Mol Biol 18: 1428–1431.
31. Lagier-Tourenne C, Polymenidou M, Cleveland DW (2010) TDP-43 and FUS/ TLS: emerging roles in RNA processing and neurodegeneration. Hum Mol Genet 19: R46–64.
32. Da Cruz S, Cleveland DW (2011) Understanding the role of TDP-43 and FUS/ TLS in ALS and beyond. Curr Opin Neurobiol 21: 904–919.
33. Tollervey JR, Curk T, Rogelj B, Briese M, Cereda M, et al. (2011) Characterizing the RNA targets and position-dependent splicing regulation by TDP-43. Nat Neurosci 14: 452–458.
34. Polymenidou M, Lagier-Tourenne C, Hutt KR, Huelga SC, Moran J, et al. (2011) Long pre-mRNA depletion and RNA missplicing contribute to neuronal vulnerability from loss of TDP-43. Nat Neurosci 14: 459–468.
35. Sephton CF, Cenik C, Kucukural A, Dammer EB, Cenik B, et al. (2011) Identification of neuronal RNA targets of TDP-43-containing ribonucleoprotein complexes. J Biol Chem 286: 1204–1215.
36. Vaccaro A, Tauffenberger A, Aggad D, Rouleau G, Drapeau P, et al. (2012) Mutant TDP-43 and FUS cause age-dependent paralysis and neurodegeneration in C. elegans. PLoS One 7: e31321.
37. Vaccaro A, Patten SA, Ciura S, Maios C, Therrien M, et al. (2012) Methylene Blue Protects against TDP-43 and FUS Neuronal Toxicity in C. elegans and D. rerio. PLoS One 7: e42117.
38. Murakami T, Yang SP, Xie L, Kawano T, Fu D, et al. (2012) ALS mutations in FUS cause neuronal dysfunction and death in Caenorhabditis elegans by a dominant gain-of-function mechanism. Hum Mol Genet 21: 1–9. 39. Mitchell JC, McGoldrick P, Vance C, Hortobagyi T, Sreedharan J, et al. (2012)
Overexpression of human wild-type FUS causes progressive motor neuron degeneration in an age- and dose-dependent fashion. Acta Neuropathol. 40. Lanson NA Jr, Maltare A, King H, Smith R, Kim JH, et al. (2011) A Drosophila
model of FUS-related neurodegeneration reveals genetic interaction between FUS and TDP-43. Hum Mol Genet 20: 2510–2523.
41. Sasayama H, Shimamura M, Tokuda T, Azuma Y, Yoshida T, et al. (2012) Knockdown of the Drosophila fused in sarcoma (FUS) homologue causes deficient locomotive behavior and shortening of motoneuron terminal branches. PLoS One 7: e39483.
42. Wang JW, Brent JR, Tomlinson A, Shneider NA, McCabe BD (2011) The ALS-associated proteins FUS and TDP-43 function together to affect Drosophila locomotion and life span. J Clin Invest 121: 4118–4126.
43. Halliday G, Bigio EH, Cairns NJ, Neumann M, Mackenzie IR, et al. (2012) Mechanisms of disease in frontotemporal lobar degeneration: gain of function versus loss of function effects. Acta Neuropathol 124: 373–382.
44. Ju S, Tardiff DF, Han H, Divya K, Zhong Q, et al. (2011) A yeast model of FUS/TLS-dependent cytotoxicity. PLoS Biol 9: e1001052.
45. Sun Z, Diaz Z, Fang X, Hart MP, Chesi A, et al. (2011) Molecular determinants and genetic modifiers of aggregation and toxicity for the ALS disease protein FUS/TLS. PLoS Biol 9: e1000614.
46. Kryndushkin D, Wickner RB, Shewmaker F (2011) FUS/TLS forms cytoplasmic aggregates, inhibits cell growth and interacts with TDP-43 in a yeast model of amyotrophic lateral sclerosis. Protein Cell 2: 223–236. 47. Fushimi K, Long C, Jayaram N, Chen X, Li L, et al. (2011) Expression of
human FUS/TLS in yeast leads to protein aggregation and cytotoxicity, recapitulating key features of FUS proteinopathy. Protein Cell 2: 141–149. 48. Dormann D, Rodde R, Edbauer D, Bentmann E, Fischer I, et al. (2010)
ALS-associated fused in sarcoma (FUS) mutations disrupt Transportin-mediated nuclear import. EMBO J 29: 2841–2857.
49. Shelkovnikova TA, Ustyugov AA, Smirnov AP, Skvortsova VI, Buchman VL, et al. (2011) FUS gene mutations associated with familiar forms of amyotrophic lateral sclerosis affect cellular localization and aggregation properties of the encoded protein. Dokl Biochem Biophys 438: 123–126.
50. Elbers CC, van Eijk KR, Franke L, Mulder F, van der Schouw YT, et al. (2009) Using genome-wide pathway analysis to unravel the etiology of complex diseases. Genet Epidemiol 33: 419–431.