Shoots under Different Levels of NaCl Stress in Rice
(
Oryza sativa
L.)
Zhoufei Wang., Zhiwei Chen., Jinping Cheng, Yanyan Lai, Jianfei Wang, Yongmei Bao, Ji Huang*, Hongsheng Zhang*
The Laboratory of Seed Science and Technology, State Key Laboratory of Crop Genetics and Germplasm Enhancement, Nanjing Agricultural University, Nanjing, People’s Republic of China
Abstract
The key to plant survival under NaCl salt stress is maintaining a low Na+level or Na+/K+ratio in the cells. A population of recombinant inbred lines (RILs, F2:9) derived from a cross between the salt-tolerantjaponicarice variety Jiucaiqing and the salt-sensitiveindicavariety IR26, was used to determine Na+and K+concentrations in the roots and shoots under three different NaCl stress conditions (0, 100 and 120 mM NaCl). A total of nine additive QTLs were identified by QTL Cartographer program using single-environment phenotypic values, whereas eight additive QTLs were identified by QTL IciMapping program. Among these additive QTLs, five were identified by both programs. Epistatic QTLs and QTL-by-environment interactions were detected by QTLNetwork program in the joint analyses of multi-environment phenotypic values, and one additive QTL and nine epistatic QTLs were identified. There were three epistatic QTLs identified for Na+in roots (RNC), three additive QTLs and two epistatic QTLs identified for Na+in shoots (SNC), four additive QTLs identified for K+in roots (RKC), four additive QTLs and three epistatic QTLs identified for K+in shoots (SKC) and one additive QTL and one epistatic QTL for salt tolerance rating (STR). The phenotypic variation explained by each additive, epistatic QTL and QTL6environment
interaction ranged from 8.5 to 18.9%, 0.5 to 5.3% and 0.7 to 7.5%, respectively. By comparing the chromosomal positions of these additive QTLs with those previously identified, five additive QTLs,qSNC9,qSKC1, qSKC9,qRKC4and qSTR7, might represent novel salt tolerance loci. The identification of salt tolerance in selected RILs showed that a major QTLqSNC11 played a significant role in rice salt tolerance, and could be used to improve salt tolerance of commercial rice varieties with marker-assisted selection (MAS) approach.
Citation:Wang Z, Chen Z, Cheng J, Lai Y, Wang J, et al. (2012) QTL Analysis of Na+and K+Concentrations in Roots and Shoots under Different Levels of NaCl
Stress in Rice (Oryza sativaL.). PLoS ONE 7(12): e51202. doi:10.1371/journal.pone.0051202
Editor:James C. Nelson, Kansas State University, United States of America
ReceivedSeptember 6, 2012;AcceptedOctober 30, 2012;PublishedDecember 6, 2012
Copyright:ß2012 Wang et al. This is an open-access article distributed under the terms of the Creative Commons Attribution License, which permits unrestricted use, distribution, and reproduction in any medium, provided the original author and source are credited.
Funding:This work was supported by the National Natural Science Foundation of China (Grant No. 31000748; 31271806), the Special Fund for Agro-scientific Research in the Public Interest (Grant No. 201203052), the Fundamental Research Funds for the Central Universities (Grant No. KYZ201202-9) and the 111 Project. The funders had no role in study design, data collection and analysis, decision to publish, or preparation of the manuscript.
Competing Interests:The authors have declared that no competing interests exist.
* E-mail: [email protected] (HZ); [email protected] (JH)
.These authors contributed equally to this work.
Introduction
Salt stress is one of the most important abiotic stresses affecting crop productivity worldwide. For plants, sodium ions (Na+) are
harmful, whereas potassium ions (K+) are essential to reduce the
uptake of Na+[1–2]. Several studies support the idea that many
transporters, such as members of HAK/KUP/KT, HKT and LCT families, play important roles in the uptake and translocation of K+and Na+in plants [2–5]. TheSKC1QTL in rice, which has
a major effect on K+concentration, was cloned and identified as
the sodium transporterOsHTK8[6]. Because rice salt tolerance is a complex quantitative trait and it is difficult to elucidate the genetic control of salt tolerance through the study of a single gene, the genetic basis of salt tolerance in rice is widely documented through QTL analysis, comparative genomic and transcriptome analysis [7–9].
In rice, QTL analysis of Na+uptake, K+uptake and ion balance
is used for genetic analysis and also to facilitate plant breeding
using marker-assisted selection (MAS). A large number of QTLs involved in Na+and K+concentrations of roots and shoots have
been identified [10–16]. For example, ten QTLs for salt tolerance parameters, including Na+ and K+ uptake, Na+ and K+
concentrations and Na+/K+ ratio in shoots were identified by
Koyama et al. [10]. Bonilla et al. [11] mapped theSALTOLlocus, which is linked to QTLs for Na+and K+uptake and Na+/K+ratio,
on chromosome 1. Lin et al. [12] mapped QTLs for root and shoot Na+/K+ concentrations and transport on twelve rice
chromosomes. Ammar et al. [13] reported 25 QTLs for salt ion concentrations on rice chromosomes 1, 2, 3 and 8. Pandit et al. [14] reported eight QTLs for salt ion concentrations on rice chromosomes 1, 8 and 12, and Cheng et al. [16] reported twelve QTLs for salt ion concentrations on rice chromosomes 1, 2, 3, 4, 7 and 11. These studies focused on the additive QTLs for Na+and
K+and Na+/K+ratios in roots and shoots under a single level of
and QTL6environment interaction analyses under different levels of NaCl stress [16].
The complex epistatic and interaction effects between QTLs and environment are important in controlling the quantitative traits [17–20]. As rice salt tolerance is a complex trait, in addition to the additive QTLs, it is necessary to identify epistatic QTLs and the interaction of QTLs and environment in rice for salt tolerance. It is difficult to correlate the epistatic QTLs and QTL6 environ-ment interactions with the pattern of epistasis, and the interaction with environment is very complex for some traits [21]. Some programs, such as QTLNetwork, genotype matrix mapping (GMM), QTL Mapper, IciMapping program and the multiple interval mapping (MIM) of QTL Cartographer, have been used to identify epistatic QTLs in several crop species [16,22–26], and QTLNetwork and GMM have also been used to identify the interaction of QTLs with environment [19,24].
Although several QTLs for salt tolerance have been identified in rice, the comparison of additive QTLs for Na+ and K+
concentrations in roots and shoots under different salt stress conditions has rarely been conducted, and the epistasis and interaction between QTLs and environment for rice salt tolerance remains unknown. In this study, a RIL population derived from a cross betweenjaponicaJiucaiqing (salt tolerant) andindicaIR26 (salt sensitive) [25] was used. We examined the additive QTLs for Na+ and K+concentrations in roots and shoots under different
levels of NaCl stress (0, 100 and 120 mM NaCl) using Cartographer [27] and IciMapping [28] approaches, and the epistatic QTLs and interaction between QTLs and environment were also analyzed using QTLNetwork approach [29]. These QTLs can be used in improving salt tolerance in rice by MAS.
Materials and Methods
Plant Materials
Two rice varieties, Jiucaiqing (japonica) and IR26 (indica), and their 150 RIL lines (F2:9) were used in this study. In our previous
experiments, we found that Jiucaiqing was highly salt tolerant, whereas IR26 was salt sensitive [25].
Evaluation of Salt Tolerance
A sample of fifty healthy grains from each parent and RIL were surface-sterilized with 0.1% mercuric chloride solution for 10 min and then rinsed three times with sterile distilled water. The seeds were soaked in distilled water at 30uC for 3 days to allow the seed germination. The germinated seeds were sown in a plastic box (40 cm630 cm618 cm) filled with 1.5 kg of quartz sand and placed in a growth chamber at 30uC. At the three-leaf seedling stage, the well-established, uniform seedlings were transplanted to 1-cm plugged holes in foam sheets floated over 15 liters of nutrient solution [30] in the plastic box for 7 days. For salt treatment, the nutrient solution was replaced with a fresh solution containing 100 or 120 mM NaCl for 10 days. The culture solution was refreshed every 2 days, and the pH was maintained at 5.6. After 10 days of salt stress, the salt tolerance rating (STR) was assessed from 0 to 5 [31]. Here 0 means no damage; 1 means very slight damage; 2 means 25–50% of leaves yellow; 3 means 50–75% of leaves yellow; 4 means more than 75% of leaves yellow and 5 means all seedlings dead. The Na+and K+in shoots and roots of each sample were
extracted using 6.5 mL nitrification liquid [32] including 60% trichloroacetic acid (1 mL), 98% nitric acid (5 mL) and 98% sulfuric acid (0.5 mL), and the concentrations in roots (RNC and RKC) and shoots (SNC and SKC) were analyzed by atomic absorption spectroscopy using a TAS-986 machine (PGENERAL, Beijing, China).
Two selected lines (lines 4 and 8) with their parents were used for a further salt tolerance evaluation under 120 mM NaCl stress. The seedlings were grown under normal conditions (control) for 26 days; for salt treatment, after growth under normal conditions for 14 days, the nutrient solution was replaced with a fresh solution containing 120 mM NaCl for 9 days, with 3days of recoveryand
growth. Seedling fresh weight, seedling height and root length of treatments and control were measured. The experimental design consisted of three replications.
Data Analysis
The experimental data were analyzed using Statistical Analysis System (SAS) software, and the indices of parents were compared with Student’st-test at the 5% and 1% levels of probability. The correlations of indices were computed using PROC CORR by SAS software [33]. The heritability in broad sense (H2
) was calculated and is expressed as the ratio of total genetic variance (VG) to phenotypic variance (VP):H2= VG/VP
.
Construction of Linkage Map
The DNA was extracted from rice seedlings using SDS method [34]. PCR was performed using the procedure of Chen et al. [35], and PCR products were then separated on an 8% non-denaturing polyacrylamide gel and visualized using silver staining method described in Sanguinetti et al. [36]. The Mapmaker/EXP 3.0 program was used to construct a complete linkage map [37]. Lastly, a set of 168 SSR markers, covering most of the rice genome at an average interval of 15 cM, was constructed.
QTL Mapping
Additive QTLs were identified by the method of composite interval mapping (CIM) using WinQTL Cartographer, version 2.5 [27], and the method of inclusive composite interval mapping (ICIM) in QTL IciMapping ver. 3.1 [28] using single-environment phenotypic values. The QTLNetwork program ver. 2.0, based on a mixed linear model [29], was used to identify the epistatic QTLs and QTL6environment interactions for salt tolerance indices in joint analyses of the multi-environment phenotypic values. The LOD thresholds of QTL were determined by a 1,000 permutation test at a 95% confidence level. The proportion of observed phenotypic variance explained by each additive and epistatic QTL and the corresponding additive effects were also estimated. The QTL nomenclature followed the suggestion of McCouch and CGSNL [38].
Results
Salt Tolerance Phenotypes
There were significant differences in the STR, RNC, SNC and SKC between two parents under both NaCl stress conditions (100 and 120 mM NaCl), but no significance for the control condition was found (Table 1). In contrast, the salt-tolerant Jiucaiqing had lower STR, RNC, RKC, SNC and SKC values than the sensitive IR26 under both NaCl stress conditions. The Na+ and K+
Correlation of Na+ and K+in Roots and Shoots
There were significantly positive correlations between the Na+
and K+ in roots and shoots under NaCl conditions, but no
significant correlations were identified under the control condition (Table 2). The correlation of Na+between roots and shoots was
significantly positive only under 100 mM NaCl condition and not under the control and 120 mM NaCl conditions. However, the correlation for K+ between roots and shoots was significantly
positive only under the control condition. The relationship among the STR and Na+and K+concentrations was also examined, and
there were highly significant positive correlations among the STR and Na+concentrations in roots and shoots, respectively, under
NaCl stress conditions (Table 2).
Additive QTLs for Seedling Salt Tolerance
QTLs for Na+ concentration. There were three additive
QTLs,qSNC3,qSNC9andqSNC11, mapped for Na+concentration
using CIM and ICIM approaches (Table 3; Fig. 1). The QTLs for Na+concentration were detected only in shoots, but not in roots
under NaCl stress. Under 100 mM NaCl condition, QTLsqSNC3
andqSNC9were mapped to chromosome 3 and 9 in the marker intervals RM7370-RM6832 and RM5688-RM444, respectively; the LOD scores were 2.5 and 3.3, explaining 13.1 and 8.8% of phenotypic variance, respectively. The positive alleles for both of these QTLs were contributed by Jiucaiqing. Another QTL for Na+
in shoot (qSNC11) under 120 mM NaCl condition was mapped simultaneously by both CIM and ICIM approaches to chromo-some 11 in the marker interval RM286-RM6288; the LOD scores were 4.0 and 3.8, explaining 14.9 and 16.1% of phenotypic variance, respectively. The positive allele for qSNC11 was contributed by IR26 to increase the SNC.
QTLs for K+
concentration. There were four additive QTLs, qRKC6.1,qRKC6.2, qRKC10and qRKC4, mapped for K+
concentration in roots by CIM and ICIM approaches (Table 3; Fig. 1). The QTLs for K+concentration were detected in roots Table 1.Phenotypic performance of relevant traits in two parents and RIL population (Jiucaiqing/IR26) under different NaCl conditions.
NaCl treatments (mM)
Traitsa
(mg/g) Parentsb RIL Populationc
Jiucaiqing IR26 Mean Max Min SD Skewness Kurtosis
Heritability (%)
0 RNC(mg/g) 13.161.9 16.663.1 16.4 30.1 4.2 4.58 0.38 0.85 95.6
RKC(mg/g) 25.263.7 31.867.0 31.1 57.4 13.2 7.51 0.85 1.07 88.8
SNC(mg/g) 14.963.7 12.463.1 13.6 34.7 6.5 5.69 1.65 2.72 89.8
SKC(mg/g) 48.964.5 49.164.5 53.5 71.8 36.5 5.97 20.66 1.11 97.6
100 STR 2.660.2 3.460.3* 3.4 5.0 2.3 0.60 0.91 0.27 94.4
RNC(mg/g) 34.165.4 36.864.5* 33.7 57.5 18.8 6.24 0.67 1.47 95.6
RKC(mg/g) 32.465.8 32.462.3 31.4 51.3 18.6 5.25 0.57 0.85 98.4
SNC(mg/g) 51.265.4 60.062.6** 66.6 115.1 38.4 15.15 0.60 0.09 64.6
SKC(mg/g) 44.662.7 56.865.5** 62.1 95.7 37.7 10.25 0.26 0.16 63.5
120 STR 3.160.3 4.260.2* 3.8 5.0 2.2 0.60 20.11 20.35 81.9
RNC(mg/g) 41.462.2 47.662.3* 52.7 93.3 27.1 10.35 0.78 1.66 98.0
RKC(mg/g) 26.866.1 27.264.1 34.7 49.1 20.9 6.191 0.32 20.51 94.9
SNC(mg/g) 126.065.6 137.367.9** 128.3 202.6 65.0 28.50 0.24 20.52 86.1
SKC(mg/g) 72.966.5 89.762.4** 73.2 115.2 43.7 13.09 0.37 0.43 92.8
aRNC: root Na+concentration; RKC: root K+concentration; SNC: shoot Na+concentration; SKC: shoot K+concentration; STR: salt tolerance rating;
bMeans
6SD (standard deviation);
*and **indicates significance at the level of 5% and 1%, respectively, according to Student’st-test; cRILs sample size n = 150, replications r = 3.
doi:10.1371/journal.pone.0051202.t001
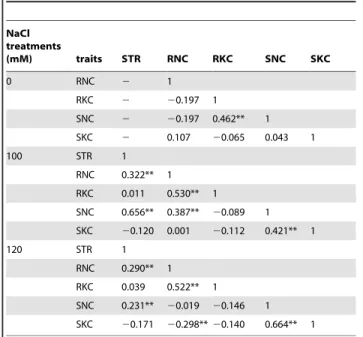
Table 2.Correlation coefficients between different traits under different NaCl conditions.
NaCl treatments
(mM) traits STR RNC RKC SNC SKC
0 RNC 2 1
RKC 2 20.197 1
SNC 2 20.197 0.462** 1
SKC 2 0.107 20.065 0.043 1
100 STR 1
RNC 0.322** 1
RKC 0.011 0.530** 1
SNC 0.656** 0.387** 20.089 1
SKC 20.120 0.001 20.112 0.421** 1
120 STR 1
RNC 0.290** 1
RKC 0.039 0.522** 1
SNC 0.231** 20.019 20.146 1
SKC 20.171 20.298**20.140 0.664** 1
RNC: root Na+concentration; RKC: root K+concentration; SNC: shoot Na+
concentration; SKC: shoot K+concentration; STR: salt tolerance rating;
only under control and 120 mM NaCl conditions, whereas no QTLs were detected under 100 mM NaCl condition. The QTLs
qRKC6.1, qRKC6.2 and qRKC10 were mapped under control condition to chromosomes 6 and 10 in the marker intervals RM340-RM6811, RM6811-RM176 and RM3773-RM8202, with LOD scores ranging from 2.7 to 3.6, explaining 9.1 to 11.5% of phenotypic variance. Among them, QTL qRKC10 was mapped simultaneously by both CIM and ICIM approaches. One QTL for K+in roots (qRKC4) under 120 mM NaCl condition was mapped
simultaneously by both CIM and ICIM approaches to chromo-somes 4 in the marker interval RM518-RM16535, with LOD scores of 3.3 and 2.6, explaining 11.8 and 8.5% of phenotypic variance, respectively. The positive alleles of these QTLs were contributed by Jiucaiqing.
There were four additive QTLs, qSKC10, qSKC1, qSKC9 and
qSKC4, mapped for the K+concentration in shoots by CIM and
ICIM approaches (Table 3; Fig. 1). The QTLs for K+
concentration were detected only in shoots under control and 100 mM NaCl conditions; no QTL was detected under 120 mM NaCl condition. QTL qSKC10 was mapped under control condition to chromosome 10 in the marker interval RM5620-RM258, with a LOD score of 2.6, explaining 12.1% of phenotypic variance. Three QTLs,qSKC1,qSKC4and qSKC9, were mapped under 100 mM NaCl condition on chromosomes 1, 4 and 9 in the marker intervals RM7341-RM7419, RM5687-RM273 and RM5688-RM444; the LOD scores ranged from 2.7 to 4.1, explaining 9.0 to 18.9% of phenotypic variance. QTLsqSKC1and
qSKC9 were mapped simultaneously by both CIM and ICIM Figure 1. Location of additive QTLs for salt tolerance indices under 0, 100 and 120 mM NaCl conditions on linkage groups by CIM and ICIM.
approaches. The positive alleles of these QTLs were contributed by Jiucaiqing.
QTLs for STR. There was only one QTL (qSTR7) for STR that was mapped under 100 mM NaCl condition by ICIM, and no QTL was detected under 120 mM NaCl condition. The QTL
qSRT7 was located on chromosome 7 in the marker interval RM11-RM5380, with a LOD score of 2.8 that explained 8.6% of phenotypic variance (Table 3; Fig. 1). The positive allele forqSRT7
was contributed by Jiucaiqing.
Identification of the QTL6Environment Interactions for Seedling Salt Tolerance
One additive QTL and nine epistatic QTLs were identified by the combined analysis of the multi-environment phenotypic values under 0, 100 and 120 mM NaCl conditions (Table 4; Fig. 2). Among them, three epistatic QTLs for RNC were detected, two with both an epistatic main effect and epistasis6environment interaction effects and one with only an epistatic main effect. Three QTLs for SNC were detected, one additive QTL with both additive and additive6environment interaction effects, one epistatic QTL with only epistasis6environment interaction effect and one epistatic QTL with both epistatic main effect and epistasis6environment interaction effects. The SKC was con-trolled by three epistatic QTLs, two with only epistasis6 environ-ment interaction effects and one with both an epistatic main effect and an epistasis6environment interaction effect. One epistatic QTL for STR was identified with only an epistatic main effect. The phenotypic variance explained by each QTL ranged from 0.5 to 5.3%, and the phenotypic variation explained by each QTL6 environment interaction ranged from 0.7 to 7.5%.
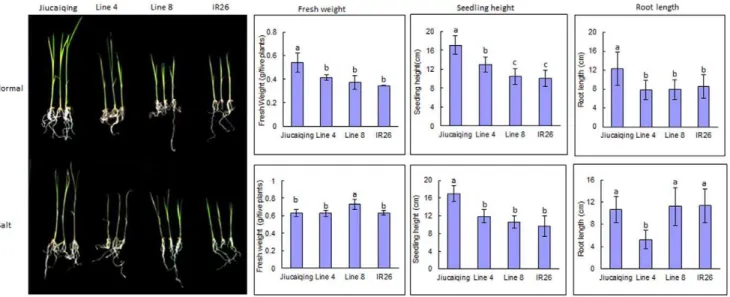
Identification of Effects of QTLqSNC11on Seedling Salt Tolerance
Under 120 mM NaCl condition, two additive QTLsqRKC4and
qSNC11were identified, and the positive alleles of both QTLs were contributed by Jiucaiqing variety to increase seedling salt tolerance. The rice seedling salt tolerance under 120 mM NaCl might be mainly affected by these two additive QTLs in this study. To identify the major effects of QTLqSNC11, the seedling salt tolerance of two lines (lines 4 and 8) were further evaluated under 120 mM NaCl (Fig. 3). The lines 4 and 8 have a relative high similar genotype (about 60% similarity), and the alleles ofqRKC4
in both lines were those of the IR26 parent, whereas theqSNC11
allele of line 4 was from IR26 and that of line 8 was from Jiucaiqing (Fig. 4). The seedlings of line 8 survived and maintained a green leaf color, whereas the line 4 seedlings died (Fig. 3). There was no significant difference in the seedling fresh weight and root length between lines 4 and 8 under the control condition. Compared with line 4, the seedling fresh weight and root length of line 8 were significantly higher under the 120 mM NaCl condition. Taken together, these results indicate that qSNC11
might play an important role in rice seedling salt tolerance under 120 mM NaCl stress.
Discussion
Accurate phenotyping is important for QTL mapping. At the seedling stage, the capacity to maintain a low Na+concentration
or a high K+ in leaves or roots is considered an indicator of
potential salt tolerance in rice [39–41]. In this study, the correlations between the STR and Na+ or K+ concentration
under NaCl stress supported these results. The salt concentration Table 3.Putative additive QTLs for relevant traits in RIL population (Jiucaiqing/IR26) under different NaCl conditions by CIM and ICIM.
Methods
NaCl treatments
(mM) Traitsa Chr.b QTLs Marker interval LOD r2(%)c Addd
CIM 0 RKC 6 qRKC6.1 RM340-RM6811 2.7 9.4 2.5
RKC 6 qRKC6.2 RM6811-RM176 3.2 11.5 2.7
RKC 10 qRKC10 RM3773-RM8202 3.6 9.1 2.4
SKC 10 qSKC10 RM5620-RM258 2.6 12.1 2.2
100 SNC 9 qSNC9 RM5688-RM444 3.3 8.8 4.7
SKC 1 qSKC1 RM7341-RM7419 3.3 9.0 3.3
SKC 9 qSKC9 RM5688-RM444 3.2 10.1 3.3
120 RKC 4 qRKC4 RM518-RM16535 3.3 11.8 2.2
SNC 11 qSNC11 RM286-RM6288 4.0 14.9 211.4
ICIM 0 RKC 10 qRKC10 RM3773-RM8202 3.1 9.1 2.3
100 STR 7 qSTR7 RM11-RM5380 2.8 8.6 0.2
SNC 3 qSNC3 RM7370-RM6832 2.5 13.1 5.5
SKC 1 qSKC1 RM7341-RM7419 4.1 14.3 3.9
SKC 4 qSKC4 RM5687-RM273 2.7 18.9 4.5
SKC 9 qSKC9 RM5688-RM444 2.5 9.2 3.2
120 RKC 4 qRKC4 RM518-RM16535 2.6 8.5 1.8
SNC 11 qSNC11 RM286-RM6288 3.8 16.1 211.7
aRNC: root Na+concentration; RKC: root K+concentration; SNC: shoot Na+concentration; SKC: shoot K+concentration; STR: salt tolerance rating;
bChromosome on which the QTL was located; cVariation explained by each putative QTL;
dAdditive effect is the effect of substituting a Jiucaiqing allele for an IR26 allele; Its positive value indicates that Jiucaiqing has the positive allele; The case of negative
values is just the opposite.
for the treatment is particularly important for effective evaluation of rice salt tolerance. Therefore, it was appropriate to jointly estimate the rice seedling salt tolerance using the indices of STR and Na+or K+concentrations in leaves or roots under different
salt concentrations.
Previous studies showed that the recirculation of Na+ from
shoots to roots was important for detoxifying Na+[6]. Our results
suggested that the Na+was increased more in shoots than in roots
under 100 and 120 mM NaCl conditions, compared to the control condition. A similar result was observed for K+. The processes of
Na+and K+ uptake in rice were considered to be independent
Figure 2. Location of additive and epistatic QTLs for salt tolerance indices with QTL6environment interactions on linkage groups by QTLNetwork.
doi:10.1371/journal.pone.0051202.g002
Table 4.Epistatic and QE interaction loci for relevant traits of RILs under different NaCl conditions by QTLNetwork.
Traitsa loci(i)b loci(j)b
A/AAc AE/AAEc r
2(A/AA)
(%)d
r2(AE/AAE)
(%)d
chr. intervals chr. intervals AE1/AAE1 AE2/AAE2 AE3/AAE3
RNC 2 RM5804-RM5651 9 RM2144-RM160 22.5** 1.6 0.6 22.2* 4.6 3.0
4 RM518-RM335 12 RM5609-RM1103 21.4** 1.0 1.1 22.0* 3.8 4.2
8 RM3459-RM342 9 RM3164-RM6570 21.3** 0.9 0.2 21.1 3.2 2.5
SNC 12 RM6296-RM20 / / 25.1** 3.8** 4.2** 28.2** 3.2 4.8
5 RM267-RM7302 6 RM340-RM1370 1.6 21.1 25.3 6.5** 0.5 5.3
8 RM223-RM3459 12 RM7344-RM1261 26.6** 3.2 0.4 23.7* 5.3 1.5
SKC 3 RM6832-RM7370 12 RM1337-RM101 0.3 20.6 22.0 2.5** 0.7 5.5
3 RM6832-RM7370 12 RM7344-RM1261 0.2 21.5 21.6 3.1** 0.6 6.5
5 RM1366-RM267 6 RM6811-RM340 2.0** 22.2* 23.0 5.0** 1.9 7.5
STR 6 RM6298-RM6818 12 RM5609-RM1103 20.2** / 0.0 0.0 4.6 0.7
aRNC: root Na+concentration; RKC: root K+concentration; SNC: shoot Na+concentration; SKC: shoot K+concentration; STR: salt tolerance rating;
bChromosome on which the QTL was located;
cA or AA represents the estimated additive effect of additive QTL or epistatic QTL, and the AE1, AE2 and AE3 represent the additive effects of additive QTL under 0, 100
and 120 mM NaCl conditions, respectively; Its positive value indicates that Jiucaiqing has the positive allele and the case of negative values is just the opposite; AAE1, AAE2 and AAE3 represent the additive effects of epistatic QTL under 0, 100 and 120 mM NaCl conditions, respectively; Its positive value indicates that two loci genotypes being the same as those in parent Jiucaiqing (or IR26) take the positive effects, while the two-loci recombinants take the negative effects; dr2(A), r2(AA), r2(AE) and r2(AAE) represent the phenotypic variation explained by the additive QTL, epistatic QTL, additive QTL
6environment interactions and epistatic QTL6environment interactions, respectively.
under salt stress because the major pathways of Na+ and K+
uptake in rice occur in parallel and not in direct competition [10,42–43]. Similar results were observed in our study in that the significantly positive correlations between SNC and SKC in shoots and between RNC and RKC in roots were observed under salt stress.
The use of three different NaCl concentrations greatly facilitated the detection of QTLs, also allowing for the identifica-tion of QTL6environment interactions. As a result, nine and seven additive QTLs were identified by CIM and ICIM, respectively, and five of them were identified by both programs. These five additive QTLs may be considered as reliable QTLs. We found that the expressions of additive QTLs for Na+and K+
under the control and salt stress conditions in rice were different, so that additive QTLs rarely co-localized among the different NaCl conditions. This finding suggests that additive QTLs are affected by environmental factors.
The QTLs detected in seedling shoots and roots were quite different. The QTLs for SNC and RNC and QTLs for SKC and
RKC did not map to the same locations. Similarly, the QTLs detected for Na+and K+concentrations were also quite different.
The QTLs for RNC and RKC did not map to the same locations, and the same map location was found only for the QTL for SNC and SKC (qSNC and qSKC). These results suggest that the loci controlling the transport of two ions, Na+and K+, between shoots
and roots of seedlings may be different or induced differentially by salt stress, similar to the results of Lin et al. [12].
With the integration of different linkage maps of RGP and the updating of Gramene database (http:// www.gramene.org/), it is possible to compare roughly the QTLs found in different research groups according to the physical location of markers linked with QTLs. In rice, a number of additive QTLs for salt tolerance have been identified. In our study, a total of eight additive QTLs were identified under salt stress condition. By comparing the chromo-somal positions of these additive QTLs, several QTLs identified in previous studies were found to lie near the additive QTLs identified in this study. For example, we found thatqSNC11was near the region of QSkc11 and QKna11 for rice seedling salt Figure 3. Effects of QTLqSNC11on seedling salt tolerance.
doi:10.1371/journal.pone.0051202.g003
tolerance, and thatqSNC3was located in a position that coincided with the region of a QTL (QSst3b) for score of leaf salt toxicity symptoms [16]. In addition,qSKC4mapped near the QTLqRKC-4
for root K+concentration in rice seedlings [12]. There were no
QTLs previously reported to be close to qSNC9, qSKC1, qSKC9,
qRKC4 and qSTR7, which indicates that these additive QTLs might be novel salt tolerance loci. Further study is necessary to confirm these QTLs using near isogenic lines (NILs). With the increase of number of QTLs identified for salt tolerance, the genetic control of rice salt tolerance will be better understood, and a MAS strategy could become a promising approach for improving salt tolerance.
In general, if the additive QTL identified explains most of genotypic variation, i.e., the proportion of phenotypic variation explained is close to broad-sense heritability, epistasis is less important [28]. In this study, the total phenotypic variances explained by additive QTLs were relatively lower compared with the heritability of Na+and K+in shoots and roots under different
salt stress conditions, indicating that there were epistatic QTLs or interactions between the QTLs and environment. Finally, one additive QTL and nine epistatic QTLs were identified by joint analyses, suggesting that epistatic QTLs and QTL6environment interactions are important components for Na+and K+
concen-trations in shoots and roots. For example, there were no additive QTLs for Na+concentration in roots, while the Na+concentration
in roots was controlled by epistatic QTLs and QTL6environment interactions.
Several major QTLs for Na+or K+concentrations have been
identified in different salt-tolerant rice varieties. For example, the salt-tolerant variety Pokkali was the source of positive alleles for the major QTLSaltolon chromosome 1 [11], accounting for high K+ and low Na+ absorptions and a low Na+/K+ ratio under
salinity stress [44]. Lin et al. [12] identified a major QTLqSKC-1
for the control of shoot K+concentration in the same region of
chromosome 1, and the allele of highly salt-tolerant variety Nona Bokra at this locus increased K+concentration in shoot. Ren et al.
[6] cloned theSKC1locus, and showed that the SKC1 protein is highly similar to HKT-type transporters. In this study, one novel major QTL qSNC11 was identified with a relatively higher contribution to the variation and additive effects, and the allele of the salt-tolerant variety Jiucaiqing at this locus decreased Na+
concentration in shoots. Through the analysis of selected RILs with Jiucaiqing alleles atqSNC11, we found that theqSNC11locus was able to confer salt tolerance, thus providing an opportunity for marker-assisted backcrossing to improve the salt tolerance of commercial varieties.
Author Contributions
Conceived and designed the experiments: JH HZ. Performed the experiments: ZC JC. Analyzed the data: ZW YL. Contributed reagents/ materials/analysis tools: JW YB. Wrote the paper: ZW.
References
1. Kader MA, Seidel T, Golldack D, Lindberg S (2006) Expressions ofOsHKT1, OsHKT2, andOsVHA are differentially regulated under NaCl stress in salt-sensitive and salt-tolerant rice (Oryza sativaL.) cultivars. J Exp Bot 57: 4257– 4268.
2. Wu Y, Hu Y, Xu G (2009) Interactive effects of potassium and sodium on root growth and expression of K/Na transporter genes in rice. Plant Growth Regul 57: 271–280.
3. Garciadebla´s B, Senn ME, Ban˜uelos MA, Rodrı´guez-Navarro A (2003) Sodium transport and HKT transporters: the rice model. Plant J 34: 788–801. 4. Ridrıguez-Navarro A, Rubio F (2006) High-affinity potassium and sodium
transport systems in plants. J Exp Bot 57: 1149–1160.
5. Munns R, Tester M (2008) Mechanisms of salinity tolerance. Annu Rev Plant Biol 59: 651–681.
6. Ren ZH, Gao JP, Li LG, Cai XL, Huang W, et al. (2005) A rice quantitative trait locus for salt tolerance encodes a sodium transporter. Nat Genet 37: 1141– 1146.
7. Sahi C, Singh A, Kumar K, Blumwald E, Grover A (2006) Salt stress response in rice: genetics, molecular biology, and comparative genomics. Funct Integr Genom 6: 263–284.
8. Ismail AM, Heuer S, Thomson MJ, Wissuwa M (2007) Genetic and genomic approaches to develop rice germplasm for problem soils. Plant Mol Biol 65: 547– 570.
9. Negra˜o S, Courtois B, Ahmadi N, Abreu I, Saibo N, et al. (2011) Recent updates on salinity stress in rice: from physiological to molecular responses. Crit Rev Plant Sci 30: 329–377.
10. Koyama ML, Levesley A, Koebner RMD, Flowers TJ, Yeo AR (2001) Quantitative trait loci for component physiological traits determining salt tolerance in rice. Plant Physiol 125: 406–422.
11. Bonilla P, Dvorak J, Mackill D, Deal K, Gregorio G (2002) RFLP and SSLP mapping of salinity tolerance genes in chromosome 1 of rice (Oryza sativaL.) using recombinant inbred lines. Philip Agric Sci 85: 68–76.
12. Lin HX, Zhu MZ, Yano MJ, Gao P, Liang ZW, et al. (2004) QTLs for Na+and
K+uptake of the shoots and roots controlling rice salt tolerance. Theor Appl
Genet 108: 253–260.
13. Ammar MHM, Pandit A, Singh RK, Sameena S, Chauhan MS, et al. (2009) Mapping of QTLs controlling Na+, K+ and Cl–
ion concentrations in salt tolerant indica rice variety CSR27. J Plant Biochem Biotechnol 18: 139–150. 14. Pandit A, Rai V, Bal S, Sinha S, Kumar V, et al. (2010) Combining QTL
mapping and transcriptome profiling of bulked RILs for identification of functional polymorphism for salt tolerance genes in rice (Oryza sativaL.). Mol Genet Genomics 284: 121–136.
15. Ahmadi N, Negra˜o S, Katsantonis D, Frouin J, Ploux J, et al. (2011) Targeted association analysis identified japonica rice varieties achieving Na+/K+
homeostasis without the allelic make-up of the salt tolerant indica variety Nona Bokra. Theor Appl Genet 123: 881–895.
16. Cheng L, Wang Y, Meng L, Hu X, Cui Y, et al. (2012) Identification of salt-tolerant QTLs with strong genetic background effect using two sets of reciprocal introgression lines in rice. Genome 55: 45–55.
17. Malmberg RL, Held S, Waits A, Mauricio R (2005) Epistasis for fitness-related quantitative traits inArabidopsis thalianagrown in the field and in the greenhouse. Genetics 171: 2013–2027.
18. Carlborg O¨ , Jacobsson L, Ahgren P, Siegel P, Andersson L (2006) Epistasis and the release of genetic variation during long-term selection. Nat Genet 38: 418– 420.
19. Shen X, Zhang T, Guo W, Zhu X, Zhang X (2006) Mapping fiber and yield QTLs with main, epistatic and QTL6environment interaction effects in recombinant inbred lines of upland cotton. Crop Sci 46: 61–66.
20. Wu¨rschum T, Maurer HP, Schulz B, Mo¨hring J, Reif JC (2011) Genome-wide association mapping reveals epistasis and genetic interaction networks in sugarbeet. Theor Appl Genet 123: 109–118.
21. Li H, Ribaut JM, Li Z, Wang J (2008) Inclusive composite interval mapping (ICIM) for digenic epistasis of quantitative traits in biparental populations. Theor Appl Genet 116: 243–260.
22. Mohan A, Kulwal P, Singh R, Kumar V, Mir RR, et al. (2009) Genome-wide QTL analysis for pre-harvest sprouting tolerance in bread wheat. Euphytica 168: 319–328.
23. Yang X, Guo Y, Yan J, Zhang J, Song T, et al. (2009) Major and minor QTL and epistasis contribute to fatty acid compositions and oil concentration in high-oil maize. Theor Appl Genet 120: 665–678.
24. Ravi K, Vadez V, Isobe S, Mir RR, Guo Y, et al. (2011) Identification of several small main-effect QTLs and a large number of epistatic QTLs for drought tolerance related traits in groundnut (Arachis hypogaeaL.). Theor Appl Genet 122: 1119–1132.
25. Wang ZF, Wang JF, Bao YM, Wu YY, Zhang HS (2011) Quantitative trait loci controlling rice seed germination under salt stress. Euphytica 178: 297–307. 26. Wang Z, Cheng J, Chen Z, Huang J, Bao Y, et al. (2012) Identification of QTLs
with main, epistatic and QTL6environment interaction effects for salt tolerance in rice seedlings under different salinity conditions. Theor Appl Genet 125: 807– 815.
27. Wang S, Basten JC, Zeng ZB. (2007) Window QTL cartographer version 2.5. Statistical Genetics, Raleigh: North Carolina State University.
28. Li H, Ye G, Wang J (2007) A modified algorithm for the improvement of composite interval mapping. Genetics 175: 361–374.
29. Yang J, Hu CC, Ye XZ, Zhu J (2005) QTLNetwork 2.0. Available at http://ibi. zju.edu.cn/software/qtlnetwork. Institute of Bioinformatics, Zhejiang Universi-ty, Hangzhou, China.
30. Yoshida S, Forno DA, Cock JH, Gomez KA (1976) Laboratory manual for physiological studies of rice. IRRI, Los Ban˜os.
32. Gulati A, Jaiwal PK (1993) Comparative salt responses of callus cultures ofVigna radiatato various osmotic and ionic stresses. J Plant Physiol 141: 120–124. 33. Wang ZF, Wang JF, Wang FH, Bao YM, Wu YY, et al. (2010) Segregation
analysis of rice seed germination under cold stress using major gene plus polygene mixed inheritance model. Seed Sci Technol 38: 104–113. 34. Dellaporta SL, Wood T, Hicks TB (1983) A plant DNA mini preparation:
version II. Plant Mol Bio Rep 1: 19–21.
35. Chen X, Temnykh S, Xu Y, Cho YG, McCouch SR (1997) Development of a microsatellite framework map providing genome-wide for constructing primary genetic linkage maps of experimental and natural populations. Genomics 1: 174–181.
36. Sanguinetti CJ, Neto ED, Simpson AJ (1994) Rapid silver staining and recovery of PCR products separated on polyacrylamide gels. Biotechniques 17: 914–921. 37. Lander ES, Green P, Abrahamson J, Barlow A, Daly MJ, et al. (1987) MAPMAKER: an interactive computer package coverage in rice (Oryza sativa L.). Theor Appl Genet 95: 553–567.
38. McCouch SR, CGSNL (Committee on Gene Symbolization, Nomenclature, Linkage, Rice Genetics Cooperative) (2008) Gene nomenclature system for rice. Rice 1: 72–84.
39. Tester M, Davenport RJ (2003) Na+
transport and Na+
tolerance in higher plants. Ann Bot 91: 503–527.
40. Feki K, Quintero FJ, Pardo JM, Masmoudi K (2011) Regulation of durum wheat Na+
/H+
exchanger TdSOS1 by phosphorylation. Plant Mol Biol 76: 545– 556.
41. Yeo AR, Flowers TJ (1982) Accumulation and localization of sodium ions within the shoots of rice (Oryza sativa) varieties differing in salinity resistance. Physiol Plant 56: 343–348.
42. Garcia A, Rizzo CA, Ud-Din J, Bartos SL, Senadhira D, et al. (1997) Sodium and potassium transport to the xylem are inherited independently in rice, and the mechanism of sodium: potassium selectivity differs between rice and wheat. Plant Cell Environ 20: 1167–1174.
43. Yadav R, Courtois B, Huang N, McLaren G (1997) Mapping genes controlling root morphology and root distribution in a doubledhaploid population of rice. Theor Appl Genet 94: 619–632.