Subclass in Patients with Acute Coronary Syndrome
Li Tian1, Chuanwei Li2, Yinghui Liu1, Yucheng Chen2, Mingde Fu1*
1Laboratory of Endocrinology and Metabolism, West China Hospital, Sichuan University, Chengdu, Sichuan, People’s Republic of China,2Cardiovascular Department, West China Hospital, Sichuan University, Chengdu, Sichuan, People’s Republic of China
Abstract
Background:High-density lipoprotein (HDL) enhances cholesterol efflux from the arterial wall and exhibits potent anti-inflammatory and anti-atherosclerosis (AS) properties. Whether raised HDL levels will clinically benefit patients with acute coronary syndrome (ACS) and the value at which these effects will be apparent, however, is debatable. This study examined the HDL subclass distribution profile in patients with ACS.
Methods:Plasma HDL subclasses were measured in 158 patients with established ACS and quantified by two-dimensional gel electrophoresis and immunoblotting. ACS diagnosis was based on symptoms of cardiac ischemia, electrocardiogram (ECG) abnormalities, speciality cardiac enzyme change along with presence of coronary heart disease (CHD) on coronary angiography.
Results:The small-sized preb1-HDL, HDL3b, and HDL3alevels were significantly higher, and the large-sized HDL2aand HDL2b levels were significantly lower in patients with ACS than in those with stable angina pectoris (SAP) and in normal control subjects. Meanwhile, with an elevation in the low-density lipoprotein cholesterol (LDL-C), fasting plasma glucose (FPG), body mass index (BMI), and blood pressure (BP), and the reduction in the high density lipoprotein cholesterol (HDL-C) levels, the HDL2bcontents significantly decreased and the preb1-HDL contents significantly increased in patients with ACS. The correlation analysis revealed that the apolipoprotein (apo)A-I levels were positively and significantly with all HDL subclasses contents; plasma total cholesterol (TC) and fasting plasma glucose (FPG) levels were inversely associated with HDL2a, and HDL2b. Moreover, the FPG levels were positively related to HDL3c, HDL3b, and HDL3ain ACS patients.
Conclusion:The HDL subclass distribution profile remodeling was noted in the patients with ACS. Plasma lipoprotein and FPG levels, BP, and BMI play an important role in the HDL subclass metabolism disorder for patients with ACS. The HDL subclass distribution phenotype might be useful as a novel biomarker to assist in the risk stratification of patients with ACS.
Citation:Tian L, Li C, Liu Y, Chen Y, Fu M (2014) The Value and Distribution of High-Density Lipoprotein Subclass in Patients with Acute Coronary Syndrome. PLoS ONE 9(1): e85114. doi:10.1371/journal.pone.0085114
Editor:Cordula M. Stover, University of Leicester, United Kingdom
ReceivedSeptember 11, 2013;AcceptedDecember 1, 2013;PublishedJanuary 23, 2014
Copyright:ß2014 Tian et al. This is an open-access article distributed under the terms of the Creative Commons Attribution License, which permits unrestricted use, distribution, and reproduction in any medium, provided the original author and source are credited.
Funding:The work was supported by the grants from National Natural Science Foundation of China (Grant NO. 31300648). The funders had no role in study design, data collection and analysis, decision to publish, or preparation of the manuscript.
Competing Interests:The authors have declared that no competing interests exist.
* E-mail: [email protected]
Introduction
There is consistent epidemiological and clinical evidence showing that low high-density lipoprotein cholesterol (HDL-C) to be a strong independent risk factor for coronary heart disease (CHD) [1]. The literature also reported that CHD progression can be attenuated by elevating HDL-C levels [2,3]. In addition, low levels of HDL-C might responsible for a significant percentage of residual cardiovascular risk in patients with CHD [4–6]. Acute coronary syndromes (ACS) patients in Middle East had a high prevalence of low HDL-C levels [7].
The strong inverse relationship between plasma HDL-C and atherosclerotic cardiovascular disease (CVD) provides the epide-miological bases that HDL is atheroprotective [8]. HDL promotes cholesterol efflux from the arterial wall [9] and exhibits potent anti-inflammatory and anti-atherosclerosis (AS) properties [10], whether and what degree raising HDL levels provides clinical
benefit in patients with ACS, however, is currently still matter of debate [8].
It is well known that the HDL do not represent a sum of identical particles but rather are comprised from various subclasses that differ with respect to their size, density, chemical composition and other physicochemical properties. Using two-dimensional gel electrophoresis coupled with immunoblotting, HDL can be divided into large, cholesterol-rich (HDL2a and HDL2b),
small-sized (HDL3c, HDL3b, HDL3a, and preb1-HDL) and preb2-HDL
[10,11]. Epidemiological studies have shown that individual HDL subclasses are not equally atheroprotective [12], an increase content of the small-sized preb1-HDL particles and a decrease
content of the large-sized HDL2b particles were positively and
significantly associated with the risk of CHD [13,14]. Accumula-tion of small preb1-HDL may be a result of inefficient conversion
of preb1-HDL into preb2-HDL or the esterification of cholesterol.
Thus, higher levels of preb1-HDL would have a negative impact
HDL2bparticles may be important in determining the direction of
the flow of cholesterol ester (CE). In the absence of HDL2b
particles, HDL-CE is transferred to very low density lipoprotein (VLDL) and low density lipoprotein (LDL) by the action of cholesteryl ester transfer protein (CETP), resulting in an increase of CE in potentially atherogenic particles.
In ACS, vascular inflammation is a main factor affecting plaque vulnerability and prothrombotic state [15]. Under such inflam-matory conditions, the protein and phospholipids (PL) moieties of HDL are substantially altered, therefore modifying the functional characteristics of the HDL particles [16]. HDL isolated from coronary artery disease (CAD) subjects has been shown to exert proinflammatory properties in vitro relative to HDL particles isolated from control subjects [17]. Therefore, it is suggested that by triggering an inflammatory response, ACS may transform HDL from antiinflammatory into a proinflammatory molecule.
To test the hypothesis that HDL particles are remodeled in ACS, we compared the distribution of HDL subclasses particles isolated from ACS patients to those isolated from stable CAD patients and normal control subjects. It has the potential to identify HDL subclass distribution profile as novel biomarkers that correlate with clinical manifestations in ACS patients.
Methods and Subjects
Study Design
The study was planned to investigate the HDL subclasses distribution phenotype in acute coronary syndrome (ACS) patients and also analysis and compare the phenotype in ACS patients, stable coronary heart disease (CHD) patients (stable angina pectoris, SAP) patients along with normal control subjects.
Demographic and other baseline clinical and biochemical characteristics of the patients were evaluated. Protocols were reviewed and approved by the West China Hospital ethics committee; and patients provided written informed consent prior to any study-related procedure.
Subjects
235 patients with established CHD participated in this study. These patients were hospitalized in the Cardiovascular Depart-ment of the West China Hospital, Sichuan University. Diagnosis was based on clinical history and was confirmed by quantitative coronary angiography (QCA). The results of angiographic examination were regarded positive for coronary atherosclerosis only if one or more major coronary arteries(right coronary, left main coronary, left anterior descending, and circumflex) had at least 50% stenosis of the luminal area. The angiogram was reviewed by two physicians.
Exclusion criteria included: uncontrolled diabetes mellitus, diabetes mellitus requiring insulin therapy, secondary causes of hyperlipidemia, such as uncontrolled primary hypothyroidism with thyroid stimulating hormone (TSH) greater than 5.5 uIU/ml; impaired renal function (creatinine .2.0 mg/dL) or nephritic syndrome; the presence of active liver disease or hepatic dysfunction; clinically significant hematology abnormalities. Sub-jects current or recent history consumption of more than 14 alcoholic drinks per week along with use of immunosuppressive agents also excluded in the present study. The patients were concurrently taking antihypertensive medication (80% patients using calcium channel blockers; 85% patients using beta blockers; 75% patients using diuretics); 70% patients were also using other antihypertensive therapies, and the medications did not change over the course of the study.
The 158 patients in ACS subgroups including UA (ustable angina) and AMI (acute myocardial infarction) according to the American College of Cardiology (ACC)/American Heart Associ-ation (AHA) Guidelines. The diagnosis of ACS was confirmed by clinical evaluation by the cardiologist, including the signs, symptoms of cardiac ischemia, electrocardiogram (ECG) abnor-malities (ST-segment elevation myocardial infarction, STEMI and non-ST-segment elevation myocardial infarction, NSTEMI) spe-ciality cardiac enzyme (CKMB), cardiac troponic (cTn) change along with presence of CHD on coronary angiography. As comparison groups, we also examined the 77 patients with stable CHD that is stable angina pectoris(SAP) subgroups and 86 subjects normal healthy control (Normal controls) subgroups. Normal controls subgroups consisted of age-matched normal healthy subjects from West China Center of Medical Science, Sichuan University. These subjects had no CHD as recorded by coronary angiography. The waist, hip circumferences were not measured for the normal controls subjects, and some subjects blood pressure (BP) examination recorded missed.
The effect of LDL-C and HDL-C levels on the HDL subclass distribution was assessed in ACS patients.
The reference levels of the plasma lipids were defined by following guidelines from the Adult Treatment Panel III (ATP-III) of the National Cholesterol Education Program (NCEP), that is: desirable LDL-C (,130 mg/dL; 3.34 mmol/L), borderline LDL-C (130–160 mg/dL; 3.36–4.11 mmol/L), high LDL-LDL-C ($160 mg/ dL; 4.14 mmol/L), low HDL-C (,40 mg/dL; 1.03 mmol/L), middle HDL-C (40–60 mg/dL; 1.03–1.55 mmol/L), and high HDL-C ($60 mg/dL; 1.55 mmol/L).
Body mass index (BMI) was calculated as the ratio of weight (kg) to the square of height (m2). Finally, according to the recommended criterion for BMI of the Working Group on Obesity in China (WGOC) under the support of International Life Sciences focal point in China, BMI,18.5 kg/m2were defined as underweight, BMI 18.5–24 kg/m2 were defined as desirable weight, 24,BMI#28 kg/m2were defined as overweight.
Angiographic Assessment of Coronary Arteries
Quantitative coronary angiography (QCA) was performed at the cardiology department of our hospital. QCA was carried out by resident physicians using the Judkins method, specifically through arteria radialis or arteria cruralis, multiposition projec-tion. QCA was performed at baseline according to standard methods. A minimum of 3 sets of orthogonal views of the left coronary artery and 1 of the right coronary artery were obtained from each subject. Analysis of angiograms was performed with a previously validated system of cine-projection. Briefly, the reference, minimal diameter (the point of greatest narrowing), and the average luminal diameters were obtained for 10 proximal epicardial coronary artery segments. The mean minimal coronary artery diameter was calculated in each subject as the average of the minimal luminal diameter in the 10 coronary segments.
Specimens
Fasting (12 h) blood samples were collected in tubes containing 0.1% EDTA and centrifuged at 3,000 r for 20 min at 4uC to obtain plasma. Plasma samples were stored at 4uC and used within 24 h for lipid and apolipoprotein analyses. Aliquots of each plasma sample were stored at 270uC for the determination of HDL subclasses.
Plasma Lipid and Apolipoprotein Analyses
were measured for all of the subjects using automated standard-ized equipment by the Clinical Laboratory of West China Hospital, Sichuan University.
HDL Subclasses Analyses
The subclass distribution of HDL was determined with 2-dimensional (2-D) gel electrophoresis and subsequent immunode-tection as described previously [10]. In brief, 10 ul of plasma was applied to 0.7% agarose gel and electrophoresis in the first dimension. After electrophoretic separation of lipoproteins, further separation by electrophoresis was carried out along the 2–30% nondenaturing polyacrylamide gradient gel in the second dimen-sion. To determine HDL subclasses, Western blotting was conducted after 2-D gel electrophoretic, plasma proteins and molecular markers were electrophoretically transferred to poly-vinylidene (PVDF) membranes, stained with 0.1% Ponceau S, and the position of molecular standard protein bands was labeled with a pencil. They were then destained by diffusion and 5%bovine serum albumin (BSA) was used to recover the membrane, followed by a reaction with horseradish peroxidase (HRP)-labeled goat antihuman apoA-I immunoglobulin G (IgG). The relative concentration of each HDL subclass was calculated as the percentage of total plasma apoA-I according to the density of each spot. HDL particle sizes were calibrated using a standard curve that included bovine serum albumin, ferritin, and thyro-globulin (Pharmacia Uppsala, Sweden).The relative percent concentration of each HDL subclass was multiplied by the apoA-I concentration in the sample to yield the relative concentrations of each HDL subclass of apoA-I (mg/L). The intra-assay variation (N = 5) of the specific HDL subclasses was 9.4% (preb1-HDL), 9.8% (preb2-HDL), 4.9% (HDL3c), 6.2%
(HDL3b), 7.3% (HDL3a), 11.1% (HDL2a), and 7.9% (HDL2b).
Statistical Analysis
The Kolmogorov-Smirnov test was used to determine the normality of distributions of the variables. Non-Gaussian distri-bution was transformed to Gaussian distridistri-bution using the natural logarithm conversion. All values are presented as mean 6 standard deviation (SD). Significant differences between the groups were analyzed by one-way analysis of variance. Pearson correlation analysis was used to estimate the correlation between plasma lipoproteins and the changes in HDL subclass profile among ACS patients. Differences were considered statistically significant at P,0. 05. All statistical analyses were performed using the statistical package SPSS (Version 17.0, SPSS Inc).
Results
Demographic data in ACS, SAP and Normal Control Groups
Table 1 showed that the mean age, waist, hip, systolic blood pressure (SBP) were significantly higher in ACS patients versus those in SAP patients. In addition, the levels of FPG; and waist were significantly increased for women patients than those for men patients in ACS group; meanwhile, the levels of FPG; and hip were significantly decreased for women patients versus those of men patients in SAP group.
Due to the waist, hip, and blood pressure (BP) data were missed for subjects in normal control group, the current results showed that the mean age, and body mass index (BMI) were significant lower for subjects in normal control group than those for patients in ACS group. The levels of FPG were significant lower for subjects in normal control group compared with those for patients both in ACS and SAP groups.
Plasma lipids, lipoproteins, apolipoproteins
concentrations and HDL subclasses contents in ACS, SAP and Normal Control Groups
Table 2 presented that the values for plasma lipids, lipoproteins, apolipoproteins, and HDL subclasses contents of patients between in these two groups. For patients in ACS group, the concentrations of plasma TG, TC, LDL-C, apoB100; and the ratios of TG to HDL-C, TC to HDL-C, and apoB100 to apoA-I were significantly higher; in contrast, concentrations of apoA-I and HDL-C were significantly lower when compared with those for patients in SAP group.
For the distribution of HDL subclasses, small-sized preb1-HDL,
HDL3b, and HDL3a were obviously higher (P,.05. P,.05 and
P,.01, respectively); however, large-sized HDL
2a and HDL2b
were significantly lower (P,.001 andP,.001, respectively) in ACS patients versus those in SAP patients.
Women patients had atherogenic lipoproteins profile (TG, TC increased, HDL-C decreased) and higher small-sized preb1-HDL,
HDL3b, and HDL3a(P,.05,P,.05 andP,.01, respectively), but
lower large-sized HDL2a and HDL2b (P,.01 and P,.01,
respectively) than those for men patients in ACS group. Contrary to the plasma lipoproteins and HDL subclasses distribution profile change between in women and men patients with ACS group; the plasma lipoproteins and HDL subclasses distribution display opposite changes for women patients in comparison with those for men patients in SAP group.
In comparison with the subjects in normal control group, the concentrations of TG, TC, LDL-C (only in ACS), apoB-100(only in ACS), and the ratios of TG/HDL-C, TC/HDL-C, LDL-C/ HDL-C(only in ACS), and apoB-100/A-I (only in ACS) were increased markedly, however, those of HDL-C, and apoA-I (only in ACS) were reduced markedly for patients both in ACS and SAP groups. The phenotype of HDL subclasses for the patients in ACS and SAP groups along with the subjects in normal control group presented that the patients in ACS group had higher contents of preb1-HDL (P,.01), HDL3 (HDL3c, HDL3b, HDL3a) (P,.05,
P,.05, andP,.01, separately) and lower those of HDL2(HDL2a, HDL2b) (P,.01, and P,.01, separately) than the subjects in
normal control group. Comparison the HDL subclasses distribu-tion between in SAP patients and Normal control subjects, there is a decreasing obvious in HDL2b(P,.01) for patients in SAP group
and other HDL subclasses contents did not the difference significant observed between in these two groups.
Correlation coefficients between HDL subclasses and plasma lipids, apolipoproteins, other parameters in ACS patients
Correlation between HDL subclasses and lipids, apos along with other parameters in ACS patients showed that plasma TC levels were negatively correlated with large-sized HDL2a, HDL2b. Of
note, plasma TG levels were positively correlated with HDL3c; the
levels of FPG were positively associated with HDL3c, HDL3b, and
HDL3a; but inversely with HDL2aand HDL2b. Moreover, apoA-I
were positively correlated with all HDL subclasses (Table 3).
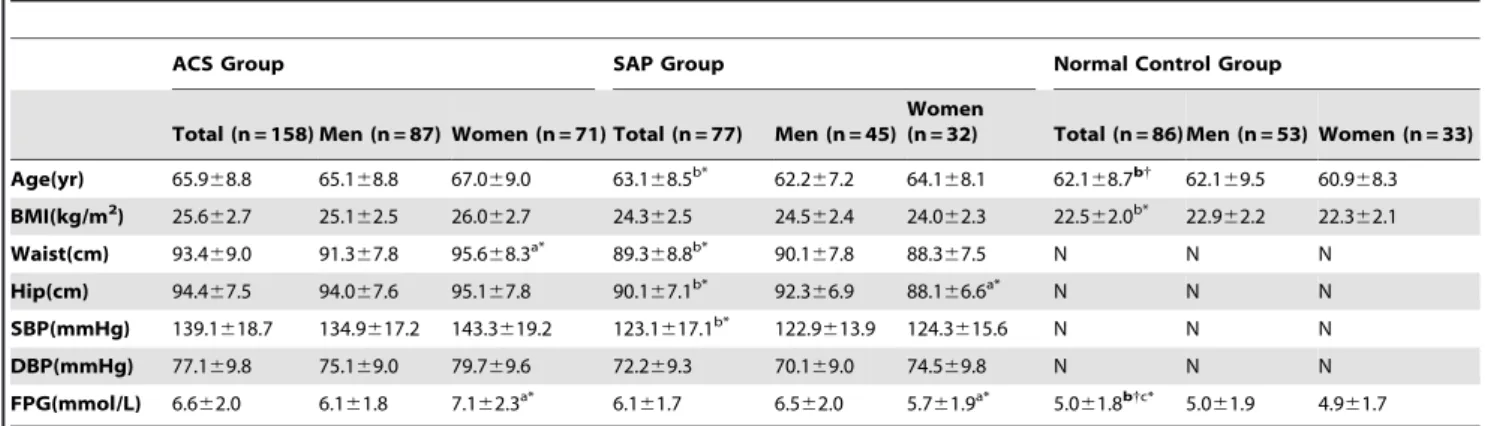
Characteristics of major HDL subclasses (Preb1-HDL, and HDL2b) distribution in ACS patients according to plasma LDL-C and HDL-C concentrations
As shown in Fig. 1(A), compared to the patients in the low HDL-C (,1.03 mml/L) subgroup, preb1-HDL contents
de-creased significantly but HDL2b contents increased significantly
Table 1.Demographic Data in ACS, SAP, and Normal Control Groups.
ACS Group SAP Group Normal Control Group
Total (n = 158) Men (n = 87) Women (n = 71) Total (n = 77) Men (n = 45) Women
(n = 32) Total (n = 86) Men (n = 53) Women (n = 33)
Age(yr) 65.968.8 65.168.8 67.069.0 63.168.5b* 62.2
67.2 64.168.1 62.168.7b{
62.169.5 60.968.3
BMI(kg/m2) 25.6
62.7 25.162.5 26.062.7 24.362.5 24.562.4 24.062.3 22.562.0b* 22.9
62.2 22.362.1
Waist(cm) 93.469.0 91.367.8 95.668.3a* 89.3
68.8b* 90.1
67.8 88.367.5 N N N
Hip(cm) 94.467.5 94.067.6 95.167.8 90.167.1b* 92.3
66.9 88.166.6a* N N N
SBP(mmHg) 139.1618.7 134.9617.2 143.3619.2 123.1617.1b* 122.9
613.9 124.3615.6 N N N
DBP(mmHg) 77.169.8 75.169.0 79.769.6 72.269.3 70.169.0 74.569.8 N N N
FPG(mmol/L) 6.662.0 6.161.8 7.162.3a* 6.1
61.7 6.562.0 5.761.9a* 5.0
61.8b{c* 5.0
61.9 4.961.7
ACS, acute coronary syndromes; SAP, stable angina pectoris; BMI, body mass index; SBP, systolic blood pressure; DBP, diastolic blood pressure; FPG, fasting plasma glucose.
Data are presented as Mean6S.D. *P,0.05,
{ P,0.01,
1 P,0.01.
aCompared with the corresponding men in the same ACS and SAP groups, respectively. bCompared with the corresponding total patients in ACS group.
cCompared with the corresponding total patients in SAP group.
doi:10.1371/journal.pone.0085114.t001
Table 2.Concentrations of Plasma Lipids, Lipoproteins, Apolipoproteins and HDL Subclasses Contents in ACS, SAP, and Normal control Groups.
ACS Group SAP Group Normal Control Group
Total (n = 158) Men (n = 87) Women
(n = 71) Total (n = 77) Men (n = 45) Women
(n = 32) Total(n = 86) Men (n = 53) Women (n = 33)
TG(mmol/L) 2.260.8 2.060.6 2.560.8a* 1.7
60.6b* 1.9
60.6 1.760.5 1.260.2b1c* 1.3
60.2 1.160.2 TC(mmol/L) 4.461.0 4.161.0 4.661.1a* 3.8
61.0b* 4.0
61.0 3.760.9 5.060.9b*c1
5.061.0 4.860.9
LDL-C(mmol/L) 3.461.0 3.361.0 3.661.0 2.860.7b* 3.1
60.9 2.460.7a* 3.0
60.7b* 3.1
60.9 2.861.0 HDL-C(mmol/L) 1.160.2 1.160.2 1.160.2 1.360.2b* 1.2
60.2 1.460.2a* 1.4
60.4b{
1.360.3 1.660.2a{
TG/HDL-C 2.160.2 1.760.3 2.560.5a{ 1.3
60.3b{ 1.5
60.3 1.160.2a* 0.8
60.3b1c{ 1.0
60.4 0.760.3a*
TC/HDL-C 3.860.5 3.360.7 4.461.0a{
2.960.4b{
3.360.6 2.660.4a{
3.360.7b*c* 3.7
60.6 2.960.4a{
LDL-C/HDL-C 3.360.4 3.260.4 3.560.5 2.160.3b1
2.660.3 1.760.2a{
2.060.4b1
2.260.4 1.760.3a*
ApoA-I(g/L) 1.160.2 1.260.2 1.060.2a{ 1.3
60.3b{ 1.2
60.2 1.460.2a{ 1.3
60.2b{ 1.2
60.2 1.360.3 ApoB-100(g/L) 0.760.2 0.660.2 0.860.2a* 0.6
60.2b* 0.7
60.2 0.560.2a* 0.6
60.2b* 0.7
60.2 0.660.2 ApoB-100/A-I 0.660.2 0.560.2 0.760.2a{
0.560.2b* 0.6
60.2 0.460.2a{
0.560.2b* 0.5
60.2 0.460.2 Preb1-HDL(mg/L) 108.8612.6 96.4610.3 121.3621.1a* 91.3
610.3b* 93.3
610.1 89.669.3 78.9616.3b{ 84.3
617.7 74.6614.3 Preb2-HDL(mg/L) 54.466.0 53.465.6 55.465.3 51.565.7 52.665.1 50.565.0 56.867.0 56.266.2 58.266.6
HDL3c(mg/L) 90.4611.4 87.6610.4 93.3613.7 84.669.4 88.8610.2 81.169.7 70.867.1b* 71.469.4 68.367.6
HDL3b(mg/L) 155.2627.1 142.9629.4 167.5630.3a* 135.3621.3b* 144.6631.8 128.2621.5a* 133.7623.8b* 143.0621.9 120.4625.4a*
HDL3a(mg/L) 286.9640.6 271.3643.3 302.3645.7a
{
247.9631.3b{
256.8646.7 240.7637.9a* 242.5
623.8b{
255.9636.1 238.1630.5a*
HDL2a(mg/L) 215.7630.9 231.1631.6 200.4627.3a{ 275.7638.1b
1
263.7645.3 287.3651.9a* 280.4
648.1b1
270..9648.3 289.1647.3a*
HDL2b(mg/L) 260.5660.6 290.5647.3 235.4631.6a{ 339.1666.6b
1
311.9661.6 357.1667.7a{
388.5663.6b1c{
376.4658.3 402.3664.4a*
ACS, acute coronary syndromes; SAP, stable angina pectoris; TG, triglyceride; TC, total cholesterol; LDL-C, low density lipoprotein cholesterol; HDL-C, high density lipoprotein cholesterol; ApoA-I, apolipoproteinA-I; ApoB-100, apolipoproteinB-100;
Data are presented as Mean6S.D. *P,0.05,
{ P,0.01,
1 P,0.001.
aCompared with the corresponding men in the same ACS and SAP groups, respectively. bCompared with the corresponding total patients in ACS group.
cCompared with the corresponding total patients in SAP group.
among in desirable LDL-C(,3.34 mmol/L), borderline LDL-C and high LDL-C groups.
Moreover, the patients in the borderline and high LDL-C groups, an elevation of preb1-HDL (high LDL-C group) and a
reduction of HDL2b were evident in the low, middle, and high
HDL-C subgroups in comparison with those for patients in corresponding HDL-C subgroup Fig. 1(B).
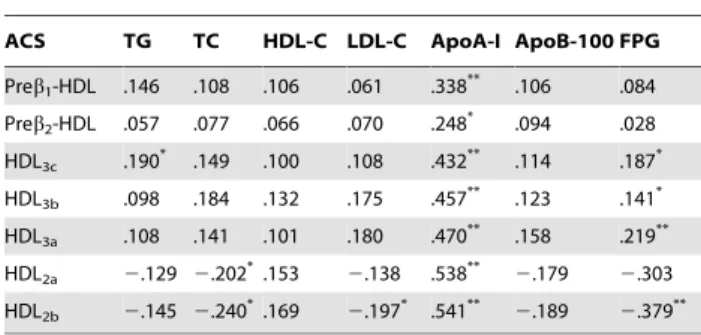
Characteristics of major HDL subclasses (Preb1-HDL, and HDL2b) distribution in ACS patients according to SBP and DBP levels
Fig. 2 presented that dichotomy the levels of SBP (140 mmHg) and DBP (90 mmHg) in ACS patients, and their corresponding contents of preb1-HDL and HDL2b. Compared with the patients
in (,140/90 mmHg group), the contents of preb1-HDL increased
significantly, however, those of HDL2bdecreased significantly for
patients in ($140/90 mmHg group)(Fig. 2).
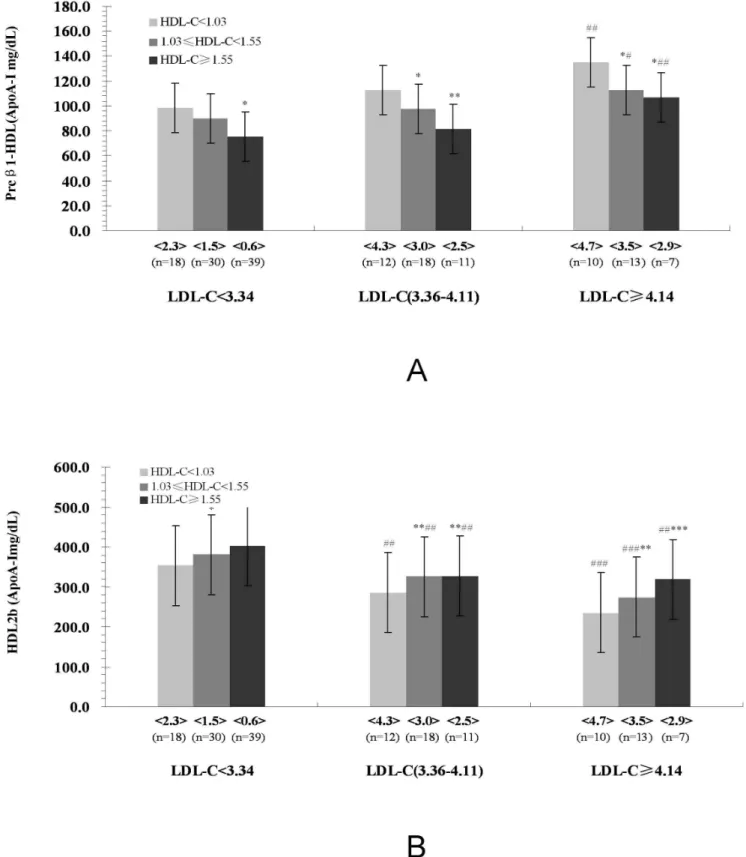
Characteristics of major HDL subclasses (Preb1-HDL, and HDL2b) distribution in ACS patients according to FPG and BMI
The FPG levels of 6.11 mmol/L and BMI 24 kg/m2were used as the cutpoints. Analyzing the relationship between the FPG levels, BMI, and the alteration of HDL subclasses showed that, in comparison with FPG,6.11 mmol/L along with BMI,24 kg/m2 patients, the patients in FPG$6.11 mmol/L along with BMI$24 kg/m2had significantly higher small-sized preb1-HDL,
but lower large-sized HDL2b(Fig. 3).
Discussion
ACS encompasses unstable angina (UAP), non-ST segment elevation myocardial infarction (NSTEMI), and ST segment elevation myocardial infarction (STEMI). Between 10% and 30% of ACS subjects experience recurrent cardiovascular (CV) events within one year, including CV death, recurrent myocardial infarction (MI), or stroke [18]. Approximately 50% of patients who present with ACS have reduced HDL-C levels [19]. Additionally, HDL-C levels at the presentation of ACS predict future risk of death or major adverse CV event [20]. In accordance with the high residual risk, new therapeutic targets and approaches
are required to treat ACS patients. The HDL becomes the potential target.
Plasma lipoproteins are implicated in the genesis of atheroscle-rosis (AS) and lipid content of AS plaques are related to their vulnerability to rupture and trigger ACS. After ACS, the chance of recurrent complications varies according to clinical, electrocar-diographic (ECC) and laboratory characteristics identified as risk predictors [21,22]. However, the simple idea of using plasma lipoproteins as risk predictors has not been sufficiently assessed in the clinical scenario. Studies have identified independent predic-tors and validated risk scores did not test plasma lipids and lipoproteins, especially plasma lipoproteins subclass distribution phenotype as potential predictors. The sole evidence is provided by Olsson et al [20], who demonstrated that HDL-C predicted coronary events in a follow-up of 16 weeks after NSTEMI. However, the predictive value of plasma HDL subclasses distribution for ACS in-hospital was not evaluated.
We therefore tested the hypothesis that HDL particles subclasses are remodeled by comparing the HDL subclasses distribution of ACS, SAP patients, and normal controls subjects. The present study found that the concentrations of plasma TG, TC, LDL-C, and apoB100; and the ratios of TG to HDL-C, TC to HDL-C along with apoB100 to apoA-I were significantly higher; in contrast, concentrations of apoA-I and HDL-C were significantly lower for patients in ACS group compared with those for patients in SAP group and subjects in normal control group.
For the distribution of HDL subclasses, the small-sized preb1
-HDL, HDL3c(only in normal control group), HDL3b, and HDL3a
contents were obviously higher; however, large-sized HDL2aand
HDL2bcontents were significantly lower for patients in ACS group
versus those for patients in SAP group and subjects in normal control group. The profile of HDL subclass distribution remod-eling in ACS patients might be involved in the increased TG, TC and LDL-C and decreased apoA-I together with HDL-C levels. Several lines of evidence suggested that enhanced CETP and hepatic lipase (HL) activities are correlated with HDL-C levels [23,24]. CETP exchanges CE of HDL2with TGs of VLDL and
LDL. The HDL-derived CE is removed from the circulation via the LDL receptor pathway. TGs in HDL are hydrolyzed by HL. The concerted action of CETP and HL converts larger HDL2into
smaller HDL3and releases lipid-free apoA-I and/or preb1-HDL.
It has been reported that the concentrations of TG are inversely associated with the lipoprotein lipase (LPL) and lecithin cholesterol acyltransferase (LCAT) activities [25,26]. LPL plays an important role in hydrolyzing TG transported in chylomicron (CM) and VLDL particles. When catabolized by LPL, CM and VLDL release TG, TC, PL, apoA-I and apoCs, subsequent binding of these products to HDL3results in formation of HDL2particles.
ApoA-I can activate the LCAT, and LCAT may catalyze unesterified cholesterol to CE and promote the conversion of preb1-HDL and HDL3 to HDL2, hence, the increased of TG
levels along with the reduction of apoA-I levels resulting in the increase contents of small-sized HDL particles and decrease contents of large-sized HDL particles.
According to the results by coronary angiography and clinical manifestations, the CHD patients usually divided into ACS groups that including UAP and AMI patients and SAP groups. The SAP is a chronic, and relative stable process, but the ACS presents acute and unstable process. Compared with the normal control group, almost all HDL subclasses contents significantly change in ACS group, but, the HDL subclasses contents did not difference except for HDL2b in SAP group. It is well known that the most
prominent role of HDL is its role in the reverse cholesterol transport (RCT) process by which excess cholesterol is transported
Table 3.Assessment of Relationship between Plasma Lipid, Lipoprotein, Apolipoprotein and HDL Subclasses Contents in ACS Patients.
ACS TG TC HDL-C LDL-C ApoA-I ApoB-100 FPG
Preb1-HDL .146 .108 .106 .061 .338** .106 .084
Preb2-HDL .057 .077 .066 .070 .248* .094 .028
HDL3c .190* .149 .100 .108 .432** .114 .187*
HDL3b .098 .184 .132 .175 .457** .123 .141*
HDL3a .108 .141 .101 .180 .470** .158 .219**
HDL2a 2.129 2.202*.153 2.138 .538** 2.179 2.303
HDL2b 2.145 2.240*.169 2.197* .541** 2.189 2.379**
ACS, acute coronary syndromes; TG, triglyceride; TC, total cholesterol; HDL-C, high density lipoprotein cholesterol; LDL-C, low density lipoprotein cholesterol; ApoA-I, apolipoproteinA-I; ApoB-100, apolipoproteinB-100; FPG, fasting plasma glucose.
*P,0.05, **P,0.01,
Figure 1. Characteristics of Major HDL Subclasses (Preb1-HDL, and HDL2b) Distribution in ACS Patients According to Plasma LDL-C and HDL-C Concentrations.Valued are expressed as means. The values in the, .denote the LDL-C/HDL-C ratio; N: number;*
P,0.05,** P,0.01,
***
P,0.001, compared with the HDL-C,1.03 mmol/L subgroup within the same LDL-C group.#
P,0.05,##
P,0.01,###
P,0.001 compared with the same HDL-C subgroup within the LDL-C,3.34 mmol/L group.
from peripheral cells to the liver metabolism. The cholesterol uptake from macrophages through ABC-transporters avoid the formation of foam cells in the AS lesion that is the first steps in the pathogenesis of AS. It has been postulated that RCT is the metabolic process that converts nascent preb1-HDL into
mature a-HDL, following the steps preb1-HDLRpreb2
-HDLRHDL3RHDL2. The distribution of HDL subclasses could
be reflecting the efficiency of and speed of RCT.
Based on our findings, we proposed that HDL subclasses distribution profile modified during ACS. In this case, the current work supported the increased contents of preb1-HDL and
impeded the formation of cholesterol-rich mature HDL2particles
in ACS patients which may predispose to the development of AS.
Many studies demonstrating that various factors changes that have been shown to confer cardiovascular protection (such as plasma lipoproteins, obesity, DM (diabetic mellitus) and hyper-tension). Data obtained in this work displayed that among the ACS patients, increased contents of small-sized preb1-HDL and
decreased contents of large-sized HDL2b with the elevation of
LDL-C, BMI, FPG, BP along with the reduction of HDL-C levels. In accordance with the current data which suggested that in clinical practice, it is benefit from combination therapy with lipid-lowering, glucose-lipid-lowering, and controlling for BP, and lose weight for ACS patients with abnormal HDL subclass distribution.
In one word, the current results implied that the profile of HDL subclasses distribution have remodeled in ACS patients. Plasma
Figure 2. Characteristics of Major HDL Subclasses (Preb1-HDL, and HDL2b) Distribution in ACS patients according to SBP and DBP Levels.In this chart, the red column stands for the contents of HDL2band the yellow column stands for those of preb1-HDL.
doi:10.1371/journal.pone.0085114.g002
Figure 3. Characteristics of Major HDL Subclasses (Preb1-HDL, and HDL2b) Distribution in ACS patients According to FPG and BMI.
In this chart, the blue column stands for the contents of HDL2band the green column stands for those of preb1-HDL.
lipoproteins, FPG, BP, and BMI play the important role in HDL subclasses metabolism disorder for patients with ACS. The phenotype of HDL subclasses distribution might be useful as a novel biomarker which can assist in risk stratification in ACS patients.
Author Contributions
Conceived and designed the experiments: LT YC MF. Performed the experiments: LT YL. Analyzed the data: CL YL. Contributed reagents/ materials/analysis tools: YC. Wrote the paper: LT. Contributed the samples: CL. Collected the data: CL. Reviewed the manuscript: MF.
References
1. Sacks FM, Expert Group on HDL cholesterol (2002) The role of high density lipoprotein (HDL) cholesterol in the prevention and treatment of coronary heart disease: expert group recommendations. Am J Cardiol 15:139–143. 2. Ballantyne CM, Herd JA, Ferlic LL, Kay Dunn J, Farmer JA, et al.(1999)
Influence of low HDL on progression of coronary artery disease and response to fluvastatin therapy. Circulation 99:736–743.
3. Rubins HB, Robins SJ, Collins D, Fye CL, Anderson JW, et al, for the Veterans Affairs High-Density Lipoprotein Cholesterol Intervention Trial Study Group (1999) Gemfibrozil for the secondary prevention of coronary heart disease in men with low levels of high density lipoprotein cholesterol. N Engl J Med 341: 410–418.
4. Baigent C, Keech A, Kearney PM, Blackwell L, Buck G, et al. (2005) Efficacy and safety of cholesterol lowering treatment: prospective meta-analysis of data from 90,056 participants in 14 randomised trials of statins. Lancet 366:1267– 1278.
5. Chapman MJ, Assmann G, Fruchart JC, Shepherd J, Sirtori C (2004) Raising high-density lipoprotein cholesterol with reduction of cardiovascular risk: the role of nicotinic acid-a position paper developed by the European Consensus Panel on HDL-C. Curr Med Res Opin 20:1253–1268.
6. Hausenloy DJ, Yellon DM (2008) Targeting residual cardiovascular risk: raising high-density lipoprotein cholesterol levels. Heart 94:706–714.
7. Al-Rasadi K, Al-Zakwani I, Zubaid M, Ali A, Bahnacy Y, et al. (2011) Prevalence, Predictors, and impact of low high-density lipoprotein cholesterol on in-hospital outcomes among acute coronary syndrome patients in the Middle East. Open Cardiovasc Med J 5:203–209.
8. Chenevard R, Hu¨rlimann D, Spidker L, Be´chir, Enseleit F, et al. (2012) Reconstituted HDL in Acute Coronary syndromes. Cardiovasc Ther 30:e51– e57.
9. von Eckardstein A, Nofer JR, Assmann G (2001) High density lipoproteins and arteriosclerosis. Role of cholesterol efflux and reverse cholesterol transport. Arterioscler Tromb Vasc Biol 21:13–27.
10. Wu XW, Fu MD, Liu BW (1999) Study on the immunodetection method of HDL subclasses in human serum. Chin J Arterioscler 7:253–255.
11. Xu YH, Fu MD (2003) Alterations of HDL subclasses in hyperlipidemia. Clin Chim Acta 332:95–102.
12. Kontush A, Chapman MJ (2006) Antiatherogenic small, dense HDL-guardian angel of the arterial wall? Nat Clin Pract Cardiovasc Med 3:144–153. 13. Asztalos BF, Cupples LA, Demissie S, Horvath KV, Cox CE, et al. (2004)
High-density lipoprotein subpopulation profile and coronary heart disease prevalence in male participants of the Framingham Offspring Study. Arterioscler Thromb Vasc Biol 24:2181–2187.
14. Cheung MC, Brown BG, Wolf AC (1991) Altered particle size distribution of apoA-I-containing HDL subpopulations in patients with coronary heart disease. J lipid Res 32:383–394.
15. Hansson GK (2005) Inflammation, atherosclerosis, and coronary artery disease, N Engl J Med 352:1685–1695.
16. Navab M, Anantharamaiah GM, Reddy ST, Van Lenten BJ, Ansell BJ, et al. (2006) Mechanisms of disease: proatherogenic HDL-an evolving field. Nat Clin Pract Endocrinol Metab 2:504–511.
17. Ansell BM, Navab M, Hama S, Kamranpour N, Fonarow G, et al. (2003) Inflammatory/anti-inflammatory properties of high-density lipoprotein distin-guish patients from control subjects better than high-density lipoprotein cholesterol levels and are favorably affected by simvastatin treatment. Circulation 108:2751–2756.
18. Yusuf S, Zhao F, Mehta SR, Chrolavicius S, Tognoni G, et al. (2001) Effects of clopidogrel in addition to aspirin in patients with acute coronary syndromes without ST-segment elevation. N Engl J Med 345:1495–1504.
19. Schwartz GG, Olsson AG, Ezekowitz MD, Ganz P, Oliver MF, et al. (2001) Effects of atorvastatin on early recurrent ischemic events in acute coronary syndromes: the MIRACL study: a randomized controlled trial. JAMA 285:1711–1718.
20. Olsson AG, Schwartz GG, Szarek M, Sasiela WJ, Ezekowitz MD, et al. (2005) High-density lipoprotein, but not low-density lipoprotein cholesterol levels influence short-term prognosis after acute coronary syndrome: results from the MIRACL trial. Eur Heart J 26:890–896.
21. Antman EM, Cohen M, Bernink PJ, McCabe CH, Horacek T, et al. (2000) The TIMI risk score for unstable angina/non-ST elevation MI:a method for prognostication and therapeutic decision making. JAMA 284:835–842. 22. Granger CB, Goldberg RJ, Dabbous O, Pieper KS, Eagle KA, et al. (2003)
Predictors of hospital mortality in the global registry of acute coronary events. Arch Intern Med 163:2345–2353.
23. Zambon A, Deeb SS, Hokanson JE, Brown BG, Brunzell JD (1998) Common variants in the promoter of the hepatic lipase gene are associated with lower levels of hepatic lipase activity, buoyant LDL, and higher HDL2 cholesterol. Arterioscler Thromb Vasc Biol 18:1723–1729.
24. Hesler CB, Swenson TL, Tall AR (1987) Purification and characterization of a human plasma cholesteryl ester transfer protein. J Biol Chem 262:2275–2282. 25. Hovingh GK, Hutten BA, Holleboom AG, Petersen W, Rol P, et al. (2005)
Compromised LCAT function is associated with increased atherosclerosis. Circulation 112:879–884.