D I A B E T E S & M E T A B O L I S M J O U R N A L
his is an Open Access article distributed under the terms of the Creative Commons At-tribution Non-Commercial License (http://creativecommons.org/licenses/by-nc/3.0/) which permits unrestricted non-commercial use, distribution, and reproduction in any medium, provided the original work is properly cited.
Impact of Serum Triglyceride and High Density
Lipoprotein Cholesterol Levels on Early-Phase Insulin
Secretion in Normoglycemic and Prediabetic Subjects
Masanori Shimodaira1,2, Tomohiro Niwa1, Koji Nakajima1, Mutsuhiro Kobayashi1, Norinao Hanyu1, Tomohiro Nakayama2
1Department of Internal Medicine, Iida Municipal Hospital, Iida,
2Division of Laboratory Medicine, Department of Pathology and Microbiology, Nihon University School of Medicine, Tokyo, Japan
Background: Increased triglycerides (TGs) and decreased high density lipoprotein cholesterol (HDL-C) levels are established as diabetic risks for nondiabetic subjects. he aim of this study was to investigate the relationship among TG, HDL-C, TG/HDL-C ratio, and early-phase insulin secretion in normoglycemic and prediabetic subjects.
Methods: We evaluated 663 Japanese subjects who underwent the 75-g oral glucose tolerance test. On the basis of these results, the subjects were divided into four groups: those with normal glucose tolerance (NGT; n=341), isolated impaired fasting glucose (i-IFG; n=211), isolated impaired glucose tolerance (i-IGT; n=71), and combined IFG and IGT (IFG+IGT; n=40). Insulin se-cretion was estimated by the insulinogenic index (IGI) (Δinsulin/Δglucose [30 to 0 minutes]) and disposition index (DI) (IGI/ homeostasis model assessment of insulin resistance).
Results: In prediabetic subjects (i-IFG, i-IGT, and IFG+IGT), linear regression analyses revealed that IGI and DI were positively correlated with HDL-C levels. Moreover, in subjects with i-IGT and (IFG+IGT), but not with i-IFG, the indices of insulin secre-tion were negatively correlated with the log-transformed TG and TG/HDL-C ratio. In both the subjects with i-IGT, multivariate linear regression analyses revealed that DI was positively correlated with HDL-C and negatively with log-transformed TG and TG/HDL-C ratio. On the other hand, in subjects with NGT, there was no association between insulin secretion and lipid proiles.
Conclusion: hese results revealed that serum TG and HDL-C levels have diferent impacts on early-phase insulin secretion on the basis of their glucose tolerance status.
Keywords: Cholesterol, HDL; Diabetes; Insulin secretion; Triglycerides
Corresponding author: Masanori Shimodaira
Department of Internal Medicine, Iida Municipal Hospital, 438 Yawata-machi, Iida 395-8502, Japan
E-mail: [email protected] Received: Sep. 19, 2013; Accepted: Nov. 1, 2013
INTRODUCTION
Impaired insulin secretion and insulin resistance are consid-ered as the primary pathophysiological factors in the develop-ment of type 2 diabetes mellitus (T2DM) [1]. T2DM is preced-ed by a long prpreced-ediabetic state, which is deinpreced-ed by an oral glu-cose tolerance test (OGTT) including isolated impaired fasting glucose (i-IFG), isolated impaired glucose tolerance (i-IGT), or their combination (IFG+IGT) [2]. In these high-risk
indi-viduals, abnormalities of β-cell function are present at early stages prior to the development of T2DM.
A speciic non-low density lipoprotein (non-LDL) dyslipid-emia known as atherogenic dyslipiddyslipid-emia, which is character-ized by increased triglyceride (TG) along with decreased high density lipoprotein cholesterol (HDL-C), is present in subjects with diabetes and prediabetes, as well as those with normal glucose tolerance (NGT). his abnormal lipid proile has been recently hypothesized to play a primary role in the develop-http://dx.doi.org/10.4093/dmj.2014.38.4.294
ment of T2DM, and dysfunction of β-cells caused by dyslipid-emia precedes the manifestation of disease [3,4].
he plasma TG/HDL-C concentration ratio is signiicantly related to a direct measure of insulin-mediated glucose dis-posal [5]. In nondiabetic Korean subjects, the TG/HDL-C ra-tio was independently associated with later development of T2DM [6]. Hermans et al. [7,8] revealed that the TG/HDL-C ratio was related to decreased insulin secretion, β-cell function loss, and poorer glycemic control in both sexes among sub-jects with T2DM. Another study reported that HDL-C levels were associated with β-cell function in prediabetic subjects [9]. On the other hand, the association between TG and TG/ HDL-C ratio, and insulin secretion in prediabetic and NGT subjects remain to be clariied.
he aim of the present study was to investigate the associa-tion between serum TG and HDL-C levels, and TG/HDL-C ratio and early-phase insulin secretion in normoglycemic and prediabetic subjects. One of the empirical indices that mea-sures β-cell function, the insulinogenic index (IGI), is a surro-gate measure of early-phase insulin secretion [1]; it calculates the difference between the postprandial insulin peak (mea-sured at 30 minutes) and basal insulin in relation to the difer-ence in glucose levels (IGI=ΔInsulin0–30/ΔGlucose0–30). The
homeostasis model assessment of insulin resistance (HOMA-IR) is used to estimate insulin sensitivity. Because the amount of insulin secreted by β-cells is strongly dependent on the pre-vailing degree of insulin sensitivity, accounting for diferences in insulin sensitivity is a critical point when evaluating β-cell function. herefore, in the present study, the disposition index (DI), which is the ratio of IGI relative to HOMA-IR (IGI/HOMA-R), was determined as this gives an adjusted measure of β-cell function that accounts for variations in insulin sensitivity [10].
METHODS
Subjects
Between January 2005 and December 2008, 746 subjects aged 35 years or older who had no known history of diabetes un-derwent a 75-g OGTT as part of a routine health examination at Iida Municipal Hospital. he 75-g OGTT was conducted af-ter an overnight fast (>12 hours). Blood samples were collect-ed at 0 minute (fasting plasma glucose; FPG), 30 minutes, 1 hour, and 2 hours postchallenge plasma glucose (2 hr-PG) fol-lowing the OGTT. he glucose tolerance status of each subject was classiied based on the criteria of the American Diabetes
Association (2011), as follows: NGT (FPG <100 mg/dL and 2 hr-PG levels <140 mg/dL), i-IFG (FPG of 100 to 125 mg/dL and 2 hr-PG levels <140 mg/dL), i-IGT (FPG ≤125 mg/dL and 2 hr-PG levels of 140 to 199 mg/dL), and (IFG+IGT; FPG of 100 to 125 mg/dL and 2 hr-PG levels of 140 to 199 mg/dL) [11].
Subjects who were newly diagnosed with diabetes (according to the following deinition: hemoglobin A1c ≥6.5%, FPG ≥126 mg/dL, or 2 hr-PG ≥200 mg/dL) were excluded [11]. Subjects who were on steroids or were taking drugs interfering with lipid metabolism, and those with IGI values of ≤0 were also excluded [12]. On the basis of the OGTT results, subjects with NGT (n=341), i-IFG (n=211), i-IGT (n=71), and IFG+IGT (n=40) were selected for the present study. Informed consent was obtained from all participants.
Biochemical measurements
Plasma glucose levels, serum total cholesterol (TC), TG, HDL-C, LDL-cholesterol (LDL-C), and serum uric acid (UA) were determined using standard methods (Hitachi 47 automatic analyzer; Hitachi, Tokyo, Japan). Serum insulin level was mea-sured by chemiluminescent enzyme immunoassay (Chemilu-mi Insulin; Kyowa Medics, Tokyo, Japan).
Familial history and lifestyle questionnaires
A questionnaire was used to obtain information about familial medical history and the subjects’ lifestyle, such as smoking habits and alcohol ingestion. Familial history of diabetes was deined as having one or more relatives (parent or sibling) with diabetes. Individuals who had smoked <100 cigarettes during their lifetime were considered nonsmokers, those who had smoked ≥100 cigarettes and were currently not smoking were considered former smokers, and those who had smoked ≥100 cigarettes and were currently smoking were considered current smokers. he following criteria were deined for alcohol con-sumption groups: drinking never or rarely (0 to 5 times/year), occasionally (1 to 5 times/month), and regularly (1 to 7 times/ week).
Calculations
ΔGlucose0–30). The DI, which is an adjusted measure of β-cell
function that accounts for variations in insulin sensitivity, was calculated as the ratio of the IGI relative to the HOMA-IR (IGI/HOMA-R) [10].
Statistical methods
Statistical analyses were performed using the SPSS version 21.0 (IBM Co., Armonk, NY, USA). One-way analysis of vari-ance was used to compare the clinical characteristics among the four groups followed by the Bonferroni post hoc test for continuous variables. he chi-square test was used to compare the categorical parameters. Normal distribution of variables was checked by Kolmogorov-Smirnov test.
Pearson correlation coeicients were calculated to evaluate the relationships between indices of insulin secretion and sev-eral clinical variables (body mass index [BMI], systolic blood pressure [SBP], diastolic blood pressure, UA, TC, TG, HDL-C, TG/HDL-C ratio, LDL-C, FPG, and fasting insulin level). he distributions of TG and TG/HDL-C ratio were skewed; hence, we conducted Pearson linear correlation using log-transformed values instead of the raw data. To assess independent relation-ships between β-cell function and the clinical variables, a mul-tiple linear regression analysis was performed. Standardized coeicients (β) were determined ater adjusting for age, BMI, SBP, UA, smoking status, and alcohol ingestion. Data were ex-pressed as mean±standard deviation. A P values of <0.05 was considered statistically signiicant.
RESULTS
he clinical and metabolic characteristics of the study popula-tion are summarized in Table 1. In brief, subjects afected by prediabetes had signiicantly higher age, BMI, blood pressure, and levels of fasting insulin, TC, TG, LDL-C, and HOMA-IR but lower HDL-C levels than NGT subjects, which was expect-ed. Glucose levels were higher in subjects with i-IFG, i-IGT, and IFG+IGT than in NGT subjects. We found a signiicant diference in insulin secretion (HOMA-β, IGI, and DI) among the four groups.
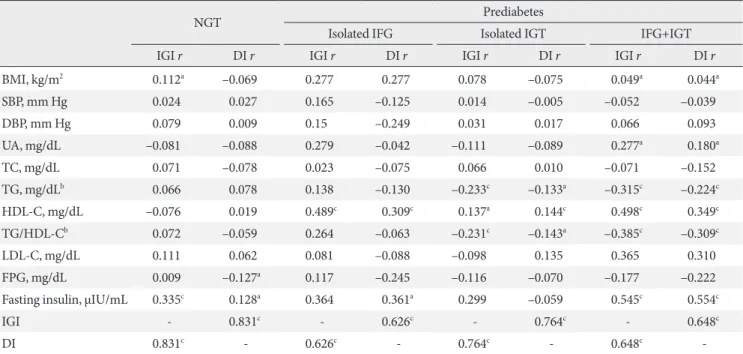
Spearman correlation analyses of subjects with i-IFG, i-IGT, and IFG+IGT demonstrated that IGI and DI were positively correlated with serum HDL-C levels. In addition, in subjects with i-IGT and IFG+IGT, but not with i-IFG, IGI, and DI were negatively correlated with transformed TG and the log-transformed TG/HDL-C ratio. On the other hand, in NGT
sub-jects, neither HDL-C and log-transformed TG, nor log-trans-formed TG/HDL-C ratio were associated with insulin secre-tion. Moreover, there were no signiicant correlations between insulin secretion and TC, and LDL-C levels among all subjects (Table 2).
As presented in Table 3, multivariate linear regression anal-yses revealed that DI was positively correlated with HDL-C in the subjects with i-IFG, i-IGT, and IFG+IGT even ater adjust-ing for potential confoundadjust-ing factors. Moreover, in those with i-IGT, DI was inversely correlated with log-transformed TG and the log-transformed TG/HDL-C ratio. However, DI was not signiicantly associated with the TG or TG/HDL-C ratio in the subjects with i-IFG and IFG+IGT.
Because the relationship between lipid proiles and insulin secretion may be explained by the disproportional distribu-tion of men and women, we examined insulin secredistribu-tion by gender. In i-IGT subjects, decreased HDL-C and increased TG and TG/HDL-C ratio were significantly correlated with de-creased DI in both men and women shown in Tables 4 and 5, respectively. However, the association between HDL-C and DI in subjects with i-IFG and IFG+IGT was not found in the analysis performed separately in men and women.
DISCUSSION
Elevated TG and decreased HDL-C levels are known to be as-sociated with the development of T2DM. These atherogenic lipid abnormalities oten precede T2DM by several years, indi-cating that altered lipoprotein metabolism is an early event in the development of β-cell dysfunction. In fact, among subjects with prediabetes, hypertriglyceridemia is demonstrated as a predictor of T2DM progression [14]. Elevated TG levels induce
β-cell apoptosis by increasing the levels of ceramide and nitric oxide [15,16]. On the other hand, HDL-C stimulates insulin secretion by interacting with ABCA1, the ATP-binding cas-sette transporter G1, or the scavenger receptor B1, and it also inhibits β-cells apoptosis [4]. herefore, subjects with Tangier disease, which is caused by an ABCA1 mutation, exhibit im-paired insulin secretion [17].
Table 1. Demographic and metabolic characteristics of study participants according to glucose tolerance status
Characteristic NGT Prediabetes P value
Isolated IFG Isolated IGT IFG+IGT
No. of patients 341 211 71 40
Men, % 55.4 69.2 76.1 77.5 <0.001
Age, yr 50.3±8.2 52.0±8.0 52.6±9.5 53.7±9.9 0.008
BMI, kg/m2 22.6±2.8 23.8±3.1 24.0±3.6 25.6±3.9 <0.001
SBP, mm Hg 119.7±18.3 122.9±17.2 121.5±16.5 131.6±17.5 <0.001
DBP, mm Hg 74.1±12.0 77.7±12.2 74.6±12.2 81.7±12.6 <0.001
eGFR, mL/min/1.73 m2 75.1±12.7 75.4±11.7 73.9±9.0 75.0±13.3 0.937
UA, mg/dL 5.2±1.3 5.6±1.4 6.0±1.1 6.2±1.3 <0.001
Lipids, mg/dL
TC 202.5±34.4 209.6±32.9 213.6±34.2 206.9±30.8 0.052
TG 103.1±64.9 143.6±111.7 169.5±105.6 160.0±93.8 <0.001
HDL-C 65.9±17.3 62.1±17.3 62.3±16.4 59.2±15.4 <0.001
LDL-C 116.8±29.7 115.9±27.5 123.8±33.7 121.7±27.4 0.606
Glucose levels, mg/dL
Fasting 92.2±4.8 105.9±5.5 95.0±3.4 109.2±7.0 <0.001
0.5 hr-PG 132.4±26.8 153.2±26.9 167.4±24.1 173.0±28.3 <0.001
1 hr-PG 121.6±33.7 145.5±37.8 178.4±45.2 190.8±46.8 <0.001
2 hr-PG 102.6±18.0 110.3±17.7 157.6±13.8 161.3±17.2 <0.001
Insulin levels, µIU/mL
Fasting 5.3±2.8 7.6±3.9 8.5±5.7 9.0±6.0 <0.001
0.5 hr-PG 46.1±31.3 49.1±34.1 57.4±36.0 47.3±35.9 0.282
HOMA-IR 1.2±0.7 1.9±1.0 2.0±1.4 2.5±1.7 <0.001
HOMA-β 65.7±36.7 63.7±34.4 75.0±34.6 70.3±47.2 <0.001
IGI 1.4±1.0 1.3±0.7 0.7±0.5 0.6±0.5 <0.001
DI 10.8±5.9 8.0±3.6 4.8±0.5 2.9±0.2 <0.001
HbA1c, % 5.0±0.3 5.1±0.3 5.3±0.4 5.3±0.3 <0.001
Familial history of diabetes, % 12.90 18.01 22.54 25.00 <0.001
Smoking status, % <0.001
Current 9.1 19.4 23.9 25.0
Former 20.8 32.7 23.9 50.0
Never 70.1 47.9 52.1 25.0
Alcohol ingestion, % <0.001
Regularly 19.9 26.5 22.5 25.0
Occasionally 36.4 33.2 31.0 35.0
Never or rarely 43.7 40.3 46.5 40.0
Values are presented as mean±standard deviation. Statistical analysis was performed using the analysis of variance and chi-square tests. P value showed diferences among four groups.
those with prediabetes, whereas its protective efects are less apparent in those with NGT. Moreover, these indices of insulin secretion did not correlate with TG or the TG/HDL-C ratio in NGT subjects. hus, our present study provides new insights into the pathophysiological diferences in lipid levels and insu-lin secretion among normoglycemic and prediabetic subjects. he evidence now suggests that subjects with IFG and i-IGT may represent different populations, with more or less overlapping subclinical characteristics and pathophysiology. Isolated IGT is associated with an increase in cardiovascular-related mortality and all-cause mortality [18]. On the other
hand, i-IFG is a risk category for diabetes, but its relationship with atherosclerosis is less clear [19]. The present study re-vealed that insulin secretion correlated with TG, HDL-C, and the TG/HDL-C ratio in both men and women subjects with i-IGT. However, such correlations were not identiied in i-IFG subjects, even though the sample size was the largest in this group among the three prediabetes subjects. Similar to the re-sults reported by Lorenzo et al. [20], in our study, TG levels were higher in i-IGT subjects compared with i-IFG subjects. Van der Zijl et al. [21] showed that lipid accumulation in the pancreas was positively associated with TG levels and
nega-Table 3. Associations of TG, HDL-C, and TG/HDL-C ratio with disposition index in total subjects
Isolated IFG Isolated IGT IFG+IGT
β P value β P value β P value
TGa –0.036 0.873 –0.249 0.004 –0.168 0.087
HDL-C 0.526 0.038 0.149 0.009 0.174 0.021
TG/HDLa –0.166 0.483 –0.252 0.005 –0.103 0.051
Standardized coeicients (β) were shown ater adjusting for age, body mass index, systolic blood pressure, uric acid, smoking status, and alco-hol ingestion.
IFG, impaired fasting glucose; IGT, impaired glucose tolerance; TG, triglyceride; HDL-C, high density lipoprotein cholesterol.
aLog-transformed.
Table 2. Peason correlation coeicients between indices of insulin secretion and demographic and metabolic variables
NGT Prediabetes
Isolated IFG Isolated IGT IFG+IGT
IGI r DI r IGI r DI r IGI r DI r IGI r DI r
BMI, kg/m2 0.112a –0.069 0.277 0.277 0.078 –0.075 0.049a 0.044a
SBP, mm Hg 0.024 0.027 0.165 –0.125 0.014 –0.005 –0.052 –0.039
DBP, mm Hg 0.079 0.009 0.15 –0.249 0.031 0.017 0.066 0.093
UA, mg/dL –0.081 –0.088 0.279 –0.042 –0.111 –0.089 0.277a 0.180a
TC, mg/dL 0.071 –0.078 0.023 –0.075 0.066 0.010 –0.071 –0.152
TG, mg/dLb 0.066 0.078 0.138 –0.130 –0.233c –0.133a –0.315c –0.224c
HDL-C, mg/dL –0.076 0.019 0.489c 0.309c 0.137a 0.144c 0.498c 0.349c
TG/HDL-Cb 0.072 –0.059 0.264 –0.063 –0.231c –0.143a –0.385c –0.309c
LDL-C, mg/dL 0.111 0.062 0.081 –0.088 –0.098 0.135 0.365 0.310
FPG, mg/dL 0.009 –0.127a 0.117 –0.245 –0.116 –0.070 –0.177 –0.222
Fasting insulin, µIU/mL 0.335c 0.128a 0.364 0.361a 0.299 –0.059 0.545c 0.554c
IGI - 0.831c - 0.626c - 0.764c - 0.648c
DI 0.831c - 0.626c - 0.764c - 0.648c
-Coeicients (r) and P values were calculated using the Pearson’s correlation model.
NGT, normal glucose tolerance; IFG, impaired fasting glucose; IGT, impaired glucose tolerance; DI, disposition index; BMI, body mass index; SBP, systolic blood pressure; DBP, diastolic blood pressure; UA, uric acid; TC, total cholesterol; TG, triglyceride; HDL-C, high density lipopro-tein cholesterol; LDL-C, low density lipoprolipopro-tein cholesterol; FPG, fasting plasma glucose; IGI, insulinogenic index.
tively with HDL-C levels. Moreover, they reported that pan-creatic fat content gradually increased with deterioration of glucose metabolism (NGT, 7.6%; IFG, 12.1%; and IGT, 22.4%), and an inverse relationship between pancreatic fat content and DI was observed [21]. In the present investigation, diferent association between lipid proiles and DI in i-IFG and i-IGT could be the result of diferences in pancreatic fat content be-tween the two groups.
He et al. [22] found that TG and the TG/HDL-C ratio were independent risk factors for T2DM, and that TG/HDL-C was a stronger risk factor of the two. Moreover, Giannini et al. [23] reported that the TG/HDL-C ratio is associated with insulin resistance and may be used along with other factors to identify subjects at increased risk of insulin resistance-driven morbidi-ty. In the present study, we investigated DI, which can be con-sidered an index of pancreatic functionality and can predict the normal β-cell response adequate for any degree of insulin resistance [24]. To the best of our knowledge, this is the irst report to reveal that this index is correlated with the TG/HDL-C ratio in both men and women with i-IGT even ater adjust-ing for the associated variables. Our results add further sup-port to the notion that the TG/HDL-C ratio may be a clinically simple and useful indicator of insulin secretion independent
of insulin sensitivity among subjects with i-IGT.
The current study had some limitations. First, the 75-g OGTT was performed as part of a health check-up rather than for any speciied research purpose, and there were no prede-termined criteria for undergoing the test. Second, the current study had a small sample size and a high prevalence of men es-pecially in subjects with IFG+IGT. Our sample size and dis-proportional distribution of gender may be insufficient to clearly conirm the association between lipid proile and insu-lin secretion in subjects with IFG+IGT. hird, and inally, we did not measure subclinical inlammatory markers (such as C-reactive protein, interleukin-6, or tumor necrosis factor-α), which may afect insulin secretion. However, the strength and consistency of the association observed using routine bio-chemical measures may have beneicial implications for clini-cal practice.
In conclusion, in a sample of prediabetic subjects, consistent associations were found between lower HDL-C and lower ear-ly-phase insulin secretion levels. Moreover, in both men and women with i-IGT, insulin secretion was negatively correlated with TG and the TG/HDL-C ratio. hese results suggest that early-phase insulin secretion is afected by HDL-C and TG in prediabetic subjects.
Table 4. Associations of TG, HDL-C, and TG/HDL-C ratio with disposition index in men subjects
Isolated IFG Isolated IGT IFG+IGT
β P value β P value β P value
TGa –0.041 0.871 –0.325 <0.001 –0.008 0.096
HDL-C 0.515 0.056 0.167 0.008 0.059 0.070
TG/HDLa –0.176 0.494 –0.308 0.002 –0.025 0.088
Standardized coeicients (β) were shown ater adjusting for age, body mass index, systolic blood pressure, uric acid, smoking status, and alco-hol ingestion.
IFG, impaired fasting glucose; IGT, impaired glucose tolerance; TG, triglyceride; HDL-C, high density lipoprotein cholesterol.
aLog-transformed.
Table 5. Associations of TG, HDL-C, and TG/HDL-C ratio with disposition index in women subjects
Isolated IFG Isolated IGT IFG+IGT
β P value β P value β P value
TGa 0.082 0.417 –0.148 0.0338 0.244 0.813
HDL-C 0.892 0.377 0.112 0.0312 –0.397 0.278
TG/HDLa 0.147 0.351 –0.100 0.0348 0.271 0.550
Standardized coeicients (β) were shown ater adjusting for age, body mass index, systolic blood pressure, uric acid, smoking status, and alco-hol ingestion.
IFG, impaired fasting glucose; IGT, impaired glucose tolerance; TG, triglyceride; HDL-C, high density lipoprotein cholesterol.
CONFLICTS OF INTEREST
No potential conlict of interest relevant to this article was re-ported.
ACKNOWLEDGMENTS
he authors thank Nobuo Shimosawa for preparing an elec-tronic database of the patients’ medical records.
REFERENCES
1. Abdul-Ghani MA, Tripathy D, DeFronzo RA. Contributions of beta-cell dysfunction and insulin resistance to the patho-genesis of impaired glucose tolerance and impaired fasting glucose. Diabetes Care 2006;29:1130-9.
2. Genuth S, Alberti KG, Bennett P, Buse J, Defronzo R, Kahn R, Kitzmiller J, Knowler WC, Lebovitz H, Lernmark A, Nathan D, Palmer J, Rizza R, Saudek C, Shaw J, Stefes M, Stern M, Tu-omilehto J, Zimmet P; Expert Committee on the Diagnosis and Classiication of Diabetes Mellitus. Follow-up report on the diagnosis of diabetes mellitus. Diabetes Care 2003;26: 3160-7.
3. Fryirs M, Barter PJ, Rye KA. Cholesterol metabolism and pan-creatic beta-cell function. Curr Opin Lipidol 2009;20:159-64. 4. von Eckardstein A, Sibler RA. Possible contributions of
lipo-proteins and cholesterol to the pathogenesis of diabetes melli-tus type 2. Curr Opin Lipidol 2011;22:26-32.
5. McLaughlin T, Reaven G, Abbasi F, Lamendola C, Saad M, Waters D, Simon J, Krauss RM. Is there a simple way to identi-fy insulin-resistant individuals at increased risk of cardiovas-cular disease? Am J Cardiol 2005;96:399-404.
6. Seo MH, Bae JC, Park SE, Rhee EJ, Park CY, Oh KW, Park SW, Kim SW, Lee WY. Association of lipid and lipoprotein proiles with future development of type 2 diabetes in nondiabetic Ko-rean subjects: a 4-year retrospective, longitudinal study. J Clin Endocrinol Metab 2011;96:E2050-4.
7. Hermans MP, Ahn SA, Rousseau MF. he atherogenic dyslip-idemia ratio [log(TG)/HDL-C] is associated with residual vas-cular risk, beta-cell function loss and microangiopathy in type 2 diabetes females. Lipids Health Dis 2012;11:132.
8. Hermans MP, Ahn SA, Rousseau MF. log(TG)/HDL-C is re-lated to both residual cardiometabolic risk and beta-cell func-tion loss in type 2 diabetes males. Cardiovasc Diabetol 2010; 9:88.
9. Bardini G, Dicembrini I, Rotella CM, Giannini S. Correlation between HDL cholesterol levels and beta-cell function in sub-jects with various degree of glucose tolerance. Acta Diabetol 2013;50:277-81.
10. Jensen CC, Cnop M, Hull RL, Fujimoto WY, Kahn SE; Ameri-can Diabetes Association GENNID Study Group. Beta-cell function is a major contributor to oral glucose tolerance in high-risk relatives of four ethnic groups in the U.S. Diabetes 2002;51:2170-8.
11. American Diabetes Association. Standards of medical care in diabetes: 2011. Diabetes Care 2011;34 Suppl 1:S11-61.
12. Oka R, Yagi K, Sakurai M, Nakamura K, Moriuchi T, Miyamo-to S, Nohara A, Kawashiri MA, Takeda Y, Yamagishi M. Insu-lin secretion and insuInsu-lin sensitivity on the oral glucose toler-ance test (OGTT) in middle-aged Japanese. Endocr J 2012;59: 55-64.
13. Matthews DR, Hosker JP, Rudenski AS, Naylor BA, Treacher DF, Turner RC. Homeostasis model assessment: insulin resis-tance and beta-cell function from fasting plasma glucose and insulin concentrations in man. Diabetologia 1985;28:412-9. 14. Rasmussen SS, Glumer C, Sandbaek A, Lauritzen T,
Borch-Johnsen K. Determinants of progression from impaired fasting glucose and impaired glucose tolerance to diabetes in a high-risk screened population: 3 year follow-up in the ADDITION study, Denmark. Diabetologia 2008;51:249-57.
15. Oyadomari S, Takeda K, Takiguchi M, Gotoh T, Matsumoto M, Wada I, Akira S, Araki E, Mori M. Nitric oxide-induced apop-tosis in pancreatic beta cells is mediated by the endoplasmic reticulum stress pathway. Proc Natl Acad Sci U S A 2001;98: 10845-50.
16. Shimabukuro M, Zhou YT, Levi M, Unger RH. Fatty acid-in-duced beta cell apoptosis: a link between obesity and diabetes. Proc Natl Acad Sci U S A 1998;95:2498-502.
17. Koseki M, Matsuyama A, Nakatani K, Inagaki M, Nakaoka H, Kawase R, Yuasa-Kawase M, Tsubakio-Yamamoto K, Masuda D, Sandoval JC, Ohama T, Nakagawa-Toyama Y, Matsuura F, Nishida M, Ishigami M, Hirano K, Sakane N, Kumon Y, Sue-hiro T, Nakamura T, Shimomura I, Yamashita S. Impaired in-sulin secretion in four Tangier disease patients with ABCA1 mutations. J Atheroscler hromb 2009;16:292-6.
18. Fuller JH, Shipley MJ, Rose G, Jarrett RJ, Keen H. Coronary-heart-disease risk and impaired glucose tolerance. he White-hall study. Lancet 1980;1:1373-6.
cardio-vascular disease, but not impaired fasting glucose. he Funa-gata Diabetes Study. Diabetes Care 1999;22:920-4.
20. Lorenzo C, Hartnett S, Hanley AJ, Rewers MJ, Wagenknecht LE, Karter AJ, Hafner SM. Impaired fasting glucose and im-paired glucose tolerance have distinct lipoprotein and apolipo-protein changes: the insulin resistance atherosclerosis study. J Clin Endocrinol Metab 2013;98:1622-30.
21. van der Zijl NJ, Goossens GH, Moors CC, van Raalte DH, Muskiet MH, Pouwels PJ, Blaak EE, Diamant M. Ectopic fat storage in the pancreas, liver, and abdominal fat depots: im-pact on beta-cell function in individuals with impaired glucose metabolism. J Clin Endocrinol Metab 2011;96:459-67.
22. He S, Wang S, Chen X, Jiang L, Peng Y, Li L, Wan L, Cui K. Higher ratio of triglyceride to high-density lipoprotein choles-terol may predispose to diabetes mellitus: 15-year prospective study in a general population. Metabolism 2012;61:30-6. 23. Giannini C, Santoro N, Caprio S, Kim G, Lartaud D, Shaw M,
Pierpont B, Weiss R. he triglyceride-to-HDL cholesterol ra-tio: association with insulin resistance in obese youths of dif-ferent ethnic backgrounds. Diabetes Care 2011;34:1869-74. 24. Bergman RN, Ader M, Huecking K, Van Citters G. Accurate