Modeling Resource Availability in Dynamic
Grid Computing
K. Abdelkader, and R. Arfa
Abstract—Peer-to-Peer network and desktop grids are cur-rently the largest distribution systems for solving data and comput intensive problems. Despite the popularity, such large-scale distributed systems are subject to churn, i.e., continuous arrival, leaving and failure of processes. Such environments define the provider characterization according to provider behavior on particular network systems. Typically, they follow a specific joint algorithm to make efficient use of existing providers and to increase the performance of the system. In this paper, using Grid Economic Simulator (GES), we model provider availability under realistic simulator of concurrent joins and unexpected departures for evaluating the performance of dynamic grid system.
Index Terms—auction market, availability, churn, dynamic grids, grid economics.
I. INTRODUCTION
T
HE exploitation of desktop grid computing in com-putational applications such as BOINC [1], [2] and SZTAKI [3], [4] for solving large-scale intensive computing applications has attracted recent research interest. Such envi-ronment is classified as volunteer grids where the providers are typically end-users public PCs located at the edge of the Internet. Recent measurements of desktop networks show that providers are connected and disconnected the system by their owners without any prior notification, which degrade the performance of such systems [5]. We believe that the proper evaluation of decentralized dynamic grid system must consider the characteristics of providers joining and departing the system at any time. This leads to determine provider availability, along with, how many jobs completed [6] on it. In this paper, the provider availability and unavailability are modeled by two kinds of provider-level characteristics. Firstly, theuptimelength distribution that indicates how long the providers stay in the grid system. That’s what we called system-based churn model as Classified in [7]. Secondly,the downtime length, that indicates the interval at which
a particular provider left the system. Despite the fact that the characterization of churn has been well addressed in literature, as open issue is still exist an effective mathematical distribution to model the network churn. Various studies, have adopted different mathematical distributions according to datasets used and their observations. Thus there is still no clear answer on how to model the characterization of the churn. Some studies have suggested thatuptimelengths can be modeled using either exponential [8], [9] or Pareto [8], [10] distributions. We adopted both distributions to model churn in our simulation study. Typically, when we modeled
Manuscript received March 14, 2014; revised March 25, 2014. K. Abdelkader and R. Arfa are with the Department of Computer Sciences, Higher Institute of Comprehensive Vocations-Ghadames, Anahda street 1, Ghadames, Libya e-mail: (Abdelkader.Khalid@gmail.com, Ra-marfa@gmail.com).
the uptime length using Pareto distribution, we accordingly
modeled the providerdowntimeusing a random period with a uniform distribution. Whilst, when theuptimelength follows an exponential distribution, the provider downtime is also modeled as an exponential distribution.Also, it is significant from the perspective of the grid user, to consider the number of jobs failing and succeeding without resubmission being required [6]. The simulation results obtained show that the churn in the exponential distribution is more intensive than using Pareto distribution.
II. AN OVERVIEW OF DYNAMIC GRID SYSTEMS
This section presents an overview of a dynamic grid sys-tem, that particularly focus on resource management. In other words we present the resource brokering and scheduling systems for computational grids. It is important to charac-terize how Dynamic Grid Participants (DGPs) interact to collaborate and coordinate resource management activities. Since DGPs are topologically distributed, and have different strategies, objectives, and supply and demand functions. In addition, they are owned by different administrative domains. In this case we deem that the providers in dynamic grids are well managed, and well connected to the Internet. Con-trolled administration of these providers gives the ability to provide a variety quality of service (QoS). However, such controlled administration of providers gives rise to the matter of provider behavior (outside world) in terms of provider availability.
III. SIMULATION MODEL
TABLE I: Workload and resource notations.
Symbole Meaning
nu Number of resource consumers
np Number of resource providers
nnp Number of non-participated providers
µi CP U speed
ci CP U cost
rm Resource of nodem
ui Theith consumer in the grid
pm Themthprovider in the grid
Ji,j ithjob fromjthconsumer
bi,j Delegated budget toJi,j
li,j Job length forJi,j
T(Ji,j,m, rm) Time required forJi,j,m at resourcem B(Ji,j,m, rm) Cost required forJi,j,mat resourcem
receive this request. In other words, the broker plays a complex role of a wide range of tasks between resource provider and the consumer. Significantly, the broker is also needed to gather information about the status of the CPU usage over the dynamic grid. Because when a job failure happen, the broker in this case will send a report to the grid-bank to render appropriate bill that has already prepaid by the account number of ui to account number pm. That enables the consumer to resubmit the failed job. In table I, we exhibit the resource notations that are utilized in this paper.
IV. PRICING OF RESOURCES
In this section we describe how the grid resources are priced in the dynamic grids. Typically we adopt the auctions market for resource pricing. In contrast to the previous work [12], where the motivation was focused on price stability using commodity market, the auction market has been engi-neered to be more realistic, in which the marketplaces are geographically distributed worldwide. Therefore, a limited number of consumers can bid on which the auctions are opened. In the other ward, the open market is exposed to limited number of bidders. Each consumer is allowed to particpate in one open auction using a uniform random number generator at every time step.
Every consumer, ui has to show how much he is willing to paybi for resourcermthat is ready offered in the auction, and the required processing time for his job numberJi,j. The resource rm of provider pm includes all information about theCP U, such as theCP Uspeed. In this work we limit the rmto contain theCP U speedrm= (µi). When the auction ends, the auctioneer charges the winner ci per time step of the jobJi,j for resource usage. The Ji,j consists of the job length,li,j, and the budgetB(Ji,j,m, rm). The required time for the Ji,j to execute on rm and the associated cost are computed using the equations (1) and (2) respectively.
T(Ji,j, rm) =li,j
µi (1)
B(Ji,j, rm) =cm.T(Ji,j, rm) (2)
V. MARKETPLACE AND DYNAMIC GRID
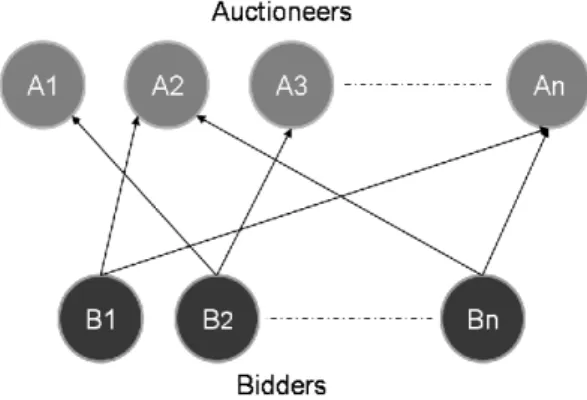
Dynamic grid GES applies market-based economy prin-ciples for resource allocation and application scheduling. In particular we adopt the auction market model, as shown in
figure 1. The auction is a first-price sealed-bid auction with no reserve price, with the high bidder wins the transaction. In this model, every provider represents an auctioneer for selling its available resources. The consumers who represent buyers can directly bid at the auctioneer for the auctioned resources. Each bidder typically, has his own valuationv to bid according to the standard equilibrium bid function from the first-price auction. The bidder with the highest value then wins the auction and pays his bid. The grid-bank, basically, plays a big role in the market because of its benefits to insure a level of agreement among market participants i.e., grid consumers and providers. In principle, the grid-bank can be utilized to establish the credibility of the participants in such grid system. In such case, it is significant that there is certain level of confidence in the marketing to process of determining trustworthiness. So the grid-bank represents a reputation management system that brings confidence, trust, and sales, which are ultimately reflected in revenue growth and profitability.
Fig. 1: The decentralised sealed-bid auctions.
VI. SIMULATIONRESULTS
In this section, we present a simulation model of resource availability for evaluating the performance of dynamic grid systems. The model parameters are listed in table II.
TABLE II: Simulation parameters.
parameters Value
simulation steps 1000s
Number of grid users {1800,25000}
Number of providers {180,2500}
Number of non-participated provider 0
Job duration in time steps {2,3,· · ·,8}
Nr. of jobs per user at injection step {1,2,· · ·,150}
Initial budget 50000
Allowance Group Factor {1,1.3,1.6,1.9}
Budget amount replenished 50.000
Number ofCP U sper provider 1
A. Modeling resource availability
Resource availability and unavailability in GES is mod-eled by two kinds of provider-level characterization. Firstly,
the uptime length distribution, which is one of the most
Each provider in the grid is an object with two fields:
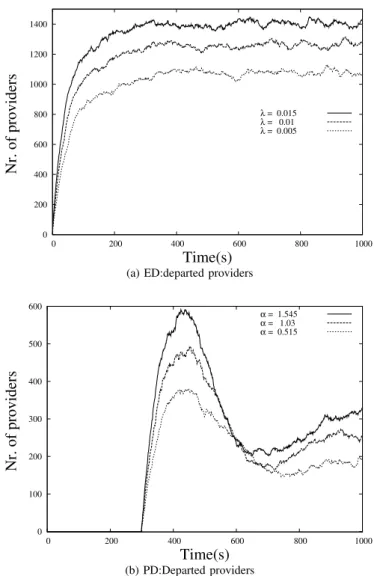
arrivalTimelearns this provider’s arrival time to the market (i.e., the statinguptimeinterval), and departTime memorizes its departure time (i.e., the startingdowntime interval). The first action of each arrival event schedules the next departure event in a random number of time steps, generated from exponential distribution ”ED” with rate λ (i.e., mean = 1/λ). Then, the normal service can be submitted. In other word, the provider is ready to open a new auction and call interested buyers. On the other hand, when the Departure event occurs, the provider is removed from the current list of participated providers, and schedules the arrivals time step in a random-variate generator using Paretodistribution with shape parameter rate αand location parameter β. Here, we should say that the provider is prone to failure, in case of the resource was not free during the departure event. As a conse-quence, the provider must compensate the consumer for the job failure. For the analysis of the departed providers under exponential distribution ”ED”scenario we change the value of the scale parameter λ = {0.005,0.01,0.015} for each simulation respectively. For Pareto distribution ”PD” scenario we change the scale paremeterα={0.515,1.03,1.545}for each simulation as well. Figure 2 exhibit the effect of scale parameters upon the departed providers. We can see that there is a significant difference among different scale values. The overall trend is that the number of departed providers increases as the scale values (λandα) increase as indicated in figures (2a) and (2b) respectively. We also notice that the number of departed provider is fairly modest asλget smaller. The impact of churn on the job failure is apparent as shown in the graph 3. It indicates the number of jobs that need to be resubmitted because of failure at least once or more. The difference between the different scale values cases is as one would expect: smaller scale values means shorter uptimes and leads to more jobs resubmissions.
B. Measurement of Availability
Some point in time, real systems became unavailable because of desks fails, providers crash, network partition, software miscalculated, administrators misconfigure or users misuse. Consequently, the principle challenge in designing high available systems is to tolerate each failure as it oc-curs and recover from its effects [13]. This is expected as dynamic resources become unavailable. In previous work, however, we defined the resource unavailability for providers in which the resource usage must complete all the tasks being processed before leaving the system (graceful leaves). Where the provider is unable to sell its available resources. Once all resources become free, then the provider can leave the system. The length of waiting intervals are determined and ascribed to several factors. For instance, tasks characteristics (”the duration of tasks, since these tasks are long running”) and the size of resources owned by the provider. These intervals we call it”Gaps”, and do not corresponds to actual provider unavailability, but rather are due to the delay of provider for departure the system. In fact, another sort of Gapsoccurs exclusively in between the termination of a task and the beginning of a new task on the same provider. We characterize this to the reluctance of the provider’s strategy to sell resources due to the market behavior and budgetary
0 200 400 600 800 1000 1200 1400
0 200 400 600 800 1000
Nr. of providers
Time(s)
λ = 0.015 λ = 0.01 λ = 0.005
(a) ED:departed providers
0 100 200 300 400 500 600
0 200 400 600 800 1000
Nr. of providers
Time(s)
α = 1.545 α = 1.03 α = 0.515
(b) PD:Departed providers
Fig. 2: The number of departed providers for exponential and Pareto distributions scenarios.
60 80 100 120 140 160 180
0 200 400 600 800 1000
Nr. of providers
Time(s)
ED: Participated providers PD: Participated providers
0 500000 1e+06 1.5e+06 2e+06 2.5e+06 3e+06
0 200 400 600 800 1000
Revenue
Time(s)
ED:Providers revenue PD:Providers revenue
0 20 40 60 80 100
0 100 200 300 400 500
CPU share %
Time(s)
ED:Consumers group1 ED:Consumers group2 ED:Consumers group3 ED:Consumers group4
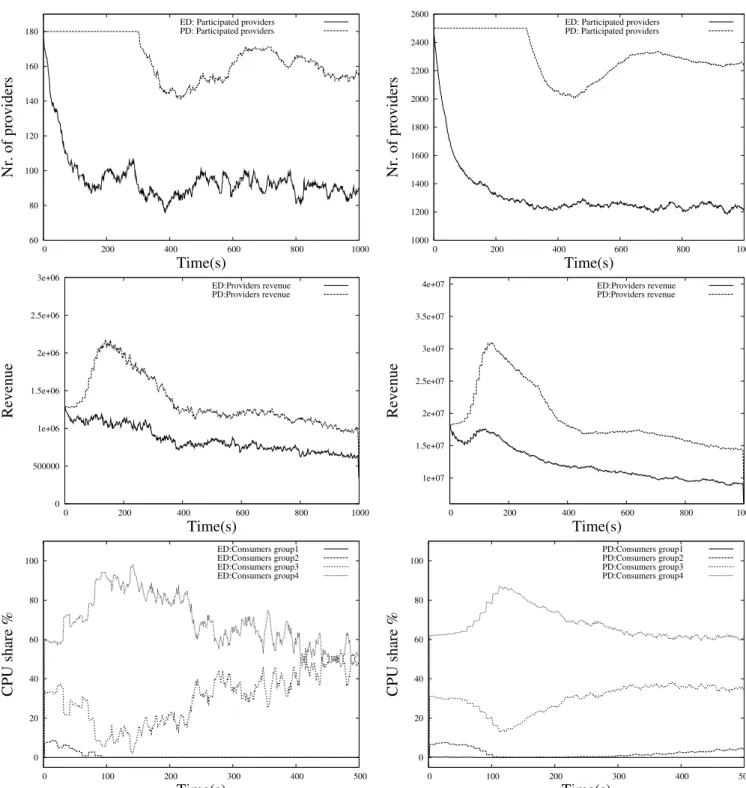
Fig. 4: The participated providers in the grid system, providers’revenues earned and CPU shares per budget group each simulation step for PlantLab traced datasets.
constraints. As the basis of our study, we characterize the availability of the large dynamic grid over discrete time step. Actually, we consider two kinds of availability: (I) participants availability, a binary value that indicates whether a provider is reachable, corresponds to the definition of availability in [13], [14], [15]; and (II) resource availability, the number of resources that can exploited by a dynamic grid application, which is not corresponds to the definition in [16], [17], [18]. Of course provider unavailability implies resource unavailability. Accordingly, we measure the size pool of participated providers each time-step.
1000 1200 1400 1600 1800 2000 2200 2400 2600
0 200 400 600 800 1000
Nr. of providers
Time(s)
ED: Participated providers PD: Participated providers
1e+07 1.5e+07 2e+07 2.5e+07 3e+07 3.5e+07 4e+07
0 200 400 600 800 1000
Revenue
Time(s)
ED:Providers revenue PD:Providers revenue
0 20 40 60 80 100
0 100 200 300 400 500
CPU share %
Time(s)
PD:Consumers group1 PD:Consumers group2 PD:Consumers group3 PD:Consumers group4
Fig. 5: The participated providers in the grid system, providers’revenues earned and CPU shares per budget group every simulation step for Maredian traced datasets.
distribution time between0.1∗meanand1.9∗mean, where the mean = 100s, and rejoin the system. In the second approach, theuptimeanddowntimelengths for each provider are exponentially characterized. When a provider reaches the end of uptimelength it leaves the system and calculates the beginning of the following uptimelength. In this approach, the scale parameter is obtained by:
λ= 1
mean
In order to discriminate between both datasets, we capture the number of participated providers and the failed jobs. this corresponds to observation, where at least 80% of total population of providers in the system ramins at any time using Pareto distribution. While on average roughly
52% of available providers that following the exponential distribution. This indicates that the churn in the latter is more intensive than the former.
In figures 4 and 5 we show participated providers, providers’ revenue and CPU shares each step of (180) Plan-etLab and (2500) Meridian providers respectively. One can observe how providers’ CPU shares are affected where the consumer group with higher allowance group factor or higher budget share can only purchase the available resources. As the job queues of those group shrink, the other consumers group are then able to allocate resources. With respect to Pareto distribution the graphs show better performance as the providers remain longer in the system.
VII. CONCLUSION
We presented two types of churn models (i.e. Exponential and Pareto distributions) in dynamic computational grids for analyzing resource availability and performance.
In the context of the Grid Economic simulator framework we have developed resource allocation scheme based on first-price-sealed-bid auctions.
We analyse experiments in a number of scenarios and arrive at conclusions firstly that the uptime intervals of providers in Pareto distribution have longer uptimes com-prered to Exponential distribution. Secondly, the job failures due to churn in such grids are inevitable. There is a need to allevite the impact of these job failures on the quality of service provided by such grids.
VIII. FUTURE WORK
There are numbers of research issues remaining open for future work. Reducing job failure due to unexpected behav-ior of providers in such environments is a key issue, and needs to be investigated. One can also model and evaluate other quality of service measures such as the reliability and performance.
REFERENCES
[1] D. P. Anderson, “A system for public-resource computing and storage,” in Proc. of the 5th IEEE/ACM International Workshop on Grid Computing, 2004, pp. 4–10. [Online]. Available: http://boinc.berkeley.edu/grid-paper-04.pdf
[2] ——, “BOINC: A system for public-resource computing and storage,” inProceedings of the Fifth IEEE/ACM International Workshop on Grid Computing. IEEE Computer Society, 2004, pp. 4–10.
[3] P. Kacsuk, N. Podhorszki, and T. Kiss, “Scalable desktop grid system,” Institute on System Architecture, CoreGRID - Network of Excellence, Tech. Rep. CoreGrid TR-0006, May 2005.
[4] K. Peter, M. A. Csaba, K. Jozsef, B. Zoltn, G. Gabor, V. Gbor, and K. Adm, “Sztaki desktop grid: A hierarchical desktop grid system,” inProceedings of the Cracow Grid Workshop 2006, Cracow (Poland), 2007.
[5] D. Stutzbach and R. Rejaie, “Understanding churn in peer-to-peer networks,” in IMC ’06: Proceedings of the 6th ACM SIGCOMM conference on Internet measurement. New York, NY, USA: ACM, 2006, pp. 189–202.
[6] ——, “Characterizing churn in peer-to-peer networks,” Univ. of Ore-gon, Tech. Rep. CIS-TR-2005-03, May 2005.
[7] S. Y. Ko, I. Hoque, and I. Gupta, “Using tractable and realistic churn models to analyze quiescence behavior of distributed protocols,” in
SRDS ’08: Proceedings of the 2008 Symposium on Reliable Distributed Systems. Washington, DC, USA: IEEE Computer Society, 2008, pp. 259–268.
[8] J. Ledlie, P. Gardner, and M. Seltzer, “Network coordinates in the wild,” inIn Proceeding of USENIX NSDI07, 2007, pp. 299–311. [On-line]. Available: http://www.usenix.org/events/nsdi07/tech/ledlie.html [9] S. Rhea, D. Geels, T. Roscoe, and J. Kubiatowicz, “Handling churn
in a dht,” inProceedings of the 2004 USENIX Conference, 2004. [10] B. Gueye and G. Leduc, “Resolving the noxious effect of churn on
internet coordinate systems,” inIWSOS, 2009, pp. 162–173. [11] G. Stuer, K. Vanmechelen, and J. Broeckhove, “A commodity market
algorithm for pricing substitutable grid resources,”Future Generation Computer Systems, vol. 23, no. 5, pp. 688–701, 2007.
[12] K. Abdelkader and J. Broeckhove, “Pricing computational resources in a dynamic grid,”International Journal of Grid and Utility Computing (IJGUC), vol. 1, pp. 205 – 215, 2009.
[13] R. Bhagwan, S. Savage, and G. M. Voelker, “Understanding avail-ability,” in Proceedings of the 2nd International Workshop on Peer-to-Peer Systems (IPTPS ’03), February 2003, pp. 256–267. [Online]. Available: http://citeseer.ist.psu.edu/bhagwan03understanding.html [14] W. Bolosky, J. Douceur, D. Ely, and M. Theimer, “Feasibility of
a serverless distributed file system deployed on an existing set of desktop pcs,” in SIGMETRICS ’00: Proceedings of the 2000 ACM SIGMETRICS international conference on Measurement and modeling of computer systems. New York, NY, USA: ACM, 2000, pp. 34–43. [15] J. Chu, K. Labonte, and B. N. Levine, “Availability and locality measurements of peer-to-peer file systems,” in In Proceedings of ITCom: Scalability and Traffic Control in IP Networks, 2002. [16] R. H. Arpaci, A. C. Dusseau, A. M. Vahdat, L. T. Liu, T. E. Anderson,
and D. A. Patterson, “The interaction of parallel and sequential workloads on a network of workstations,” SIGMETRICS Perform. Eval. Rev., vol. 23, no. 1, pp. 267–278, 1995.
[17] R. Wolski, N. T. Spring, and J. Hayes, “The network
weather service: a distributed resource performance forecasting service for metacomputing,” Future Generation Computer Systems, vol. 15, no. 5–6, pp. 757–768, 1999. [Online]. Available: citeseer.ist.psu.edu/wolski98network.html
[18] W. Rich, S. Neil, and H. Jim, “Predicting the cpu availability of time-shared unix systems on the computational grid,” in HPDC ’99: Proceedings of the 8th IEEE International Symposium on High Performance Distributed Computing. Washington, DC, USA: IEEE Computer Society, 1999, p. 12.
[19] PlanetLab: An open platform for developing, deploying, and accessing planetary-scale services, 2002, http://www.planet-lab.org/. [Online]. Available: http://www.planet-lab.org/