Patient Experience Shows Little Relationship
with Hospital Quality Management
Strategies
Oliver Groene1,12*, Onyebuchi A. Arah2, Niek S. Klazinga3, Cordula Wagner4,5, Paul D. Bartels6, Solvejg Kristensen6, Florence Saillour7, Andrew Thompson8, Caroline A. Thompson9, Holger Pfaff10, Maral DerSarkissian2, Rosa Sunol11,12
1Department of Health Services Research and Policy, London School of Hygiene and Tropical Medicine, London, United Kingdom,2Department of Epidemiology, The Fielding School of Public Health, University of California, Los Angeles (UCLA), Los Angeles, California, United States of America,3Academic Medical Center, University of Amsterdam, Amsterdam, the Netherlands,4Netherlands Institute for Health Services Research, Utrecht, the Netherlands,5Department of Public and Occupational Health, VU University Medical Center, Amsterdam, the Netherlands,6Danish Clinical Registries, Aarhus, Denmark, and Department of Clinical Medicine, Aalborg University, Aalborg, Denmark,7Unité Méthodes Evaluation en Santé, Centre Hospitalier Universitaire de Bordeaux, Bordeaux, France,8School of Social and Political Science, University of Edinburgh, Edinburgh, United Kingdom,9Palo Alto Medical Foundation Research Institute (PAMFRI), Palo Alto, California, United States of America,10Institute of Medical Sociology, Health Services Research and Rehabilitation Science, University of Cologne, Cologne, Germany,11 Avedis Donabedian Research Institute (FAD), Universitat Autonoma de Barcelona, Barcelona, Spain,12Red de investigación en servicios de salud en enfermedades crónicas REDISSEC, Barcelona, Spain
Abstract
Objectives
Patient-reported experience measures are increasingly being used to routinely monitor the quality of care. With the increasing attention on such measures, hospital managers seek ways to systematically improve patient experience across hospital departments, in particu-lar where outcomes are used for public reporting or reimbursement. However, it is currently unclear whether hospitals with more mature quality management systems or stronger focus on patient involvement and centered care strategies perform better on reported experience. We assessed the effect of such strategies on a range of patient-reported experience measures.
Materials and Methods
We employed a cross-sectional, multi-level study design randomly recruiting hospitals from the Czech Republic, France, Germany, Poland, Portugal, Spain, and Turkey between May 2011 and January 2012. Each hospital contributed patient level data for four conditions/ pathways: acute myocardial infarction, stroke, hip fracture and deliveries. The outcome vari-ables in this study were a set of patient-reported experience measures including a generic 6-item measure of patient experience (NORPEQ), a 3-item measure of patient-perceived discharge preparation (Health Care Transition Measure) and two single item measures of
OPEN ACCESS
Citation:Groene O, Arah OA, Klazinga NS, Wagner C, Bartels PD, Kristensen S, et al. (2015) Patient Experience Shows Little Relationship with Hospital Quality Management Strategies. PLoS ONE 10(7): e0131805. doi:10.1371/journal.pone.0131805
Editor:Delphine Sophie Courvoisier, University of Geneva, SWITZERLAND
Received:March 19, 2015
Accepted:June 7, 2015
Published:July 7, 2015
Copyright:© 2015 Groene et al. This is an open access article distributed under the terms of the
Creative Commons Attribution License, which permits unrestricted use, distribution, and reproduction in any medium, provided the original author and source are credited.
Data Availability Statement:The minimum data underlying the tables has been made publicly available in full under:http://dx.doi.org/10.6084/m9. figshare.1422011. Additional data and full multi-level data bases for this study are maintained by the DUQuE Consortium. All data will be fully released into the public domain 5 years after the end of the study. In the meantime, additional data will be provided following data access requests to the DUQUE consortium (contact atwww.duque.eu).
perceived involvement in care and hospital recommendation. Predictor variables included three hospital management strategies: maturity of the hospital quality management system, patient involvement in quality management functions and patient-centered care strategies. We used directed acyclic graphs to detail and guide the modeling of the complex relation-ships between predictor variables and outcome variables, and fitted multivariable linear mixed models with random intercept by hospital, and adjusted for fixed effects at the country level, hospital level and patient level.
Results
Overall, 74 hospitals and 276 hospital departments contributed data on 6,536 patients to this study (acute myocardial infarction n = 1,379, hip fracture n = 1,503, deliveries n = 2,088, stroke n = 1,566). Patients admitted for hip fracture and stroke had the lowest scores across the four patient-reported experience measures throughout. Patients admitted after acute myocardial infarction reported highest scores on patient experience and hospital recom-mendation; women after delivery reported highest scores for patient involvement and health care transition. We found no substantial associations between hospital-wide quality man-agement strategies, patient involvement in quality manman-agement, or patient-centered care strategies with any of the patient-reported experience measures.
Conclusion
This is the largest study so far to assess the complex relationship between quality manage-ment strategies and patient experience with care. Our findings suggest absence of and wide variations in the institutionalization of strategies to engage patients in quality manage-ment, or implement strategies to improve patient-centeredness of care. Seemingly counter-intuitive inverse associations could be capturing a scenario where hospitals with poorer quality management were beginning to improve their patient experience. The former sug-gests that patient-centered care is not yet sufficiently integrated in quality management, while the latter warrants a nuanced assessment of the motivation and impact of involving patients in the design and assessment of services.
Introduction
Patient-centered care is increasingly considered as an integral component of quality of care [1–
3]. It is often defined as“health care that establishes a partnership among practitioners, patients, and their families (when appropriate) to ensure that decisions respect patients’wants, needs, and preferences and that patients have the education and support they need to make decisions and participate in their own care”[4]. Patient-centered care denotes a complex con-struct and embraces many different principles and activities, such as affording patients dignity, compassion and respect, offering coordinated care, support or treatment, offering personalized care, support or treatment and supporting patients to recognize and develop their own strengths and abilities to enable them to live an independent and fulfilling life [5–7]. While an important goal in itself, patient-centered care is also a means to an end as it is consistently related with other desirable outcomes, such as clinical effectiveness and patient safety [8,9]. The focus on patient centered care is not entirely new and numerous contributions to the
grant agreement number 241822. The funders had no role in study design, data collection and analysis, decision to publish, or preparation of the manuscript. Funding to pay the Open Access publication charges for this article was provided under grant agreement no. 241822.
literature have stressed the need to improve patient-centered care to ensure dignity, trust, involvement in decision-making, and improved outcomes [10–13]. Yet, patient-centeredness has traditionally received less attention than other dimensions of health care quality.
The level of patient-centeredness is usually assessed using patient-reported experience mea-sures (PREMs) and these meamea-sures are increasingly being used to routinely monitor the quality of care. For example, efforts are underway in England’s National Health Service (NHS) to introduce a national reporting system for PREMS, similar to the Patient-reported Outcomes (PROMS) initiative that already collects and publicly reports on patient level data for four elec-tive surgical procedures [14,15]. In the United States (US), standardized, national data using the Hospital Consumer Assessment of Healthcare Providers and Systems (HCAHPS) survey has been collected and publicly reported over several years [16]. More recently, reimbursement as part of the Value-Based Purchasing Scheme links a portion of a hospital’s payment from the Centers for Medicare and Medicaid Services (CMS) to a set of quality measures, including the HCAPHS score [17,18], reinforcing the focus on patient-centered care.
Although a patient-centered approach is widely advocated, hospital performance on PREMs varies substantially. There is evidence that patients frequently do not receive important information on their condition and options for self-management, and that there is insufficient involvement of patients in developing quality goals [19,20]. Moreover, surveys frequently report patients’dissatisfaction with the way services are organized in the hospital, the lack of time for consultations, and difficulties in understanding what doctors tell them [21,22]. This has implications beyond improving the humanity of care and affects other quality of care out-comes, such as adherence to medication, increased utilization of health services, occurrence of infections, or unnecessary readmissions after a hospitalization [9].
With the increasing attention given to PREMs, hospital management needs to understand ways of improving patient-centeredness of their organizations. It is currently unclear whether hospitals with more mature quality management systems or stronger focus on patient involve-ment and patient-centered care strategies perform better on PREMs [23,24]. The objective of this research is to assess these complex relationships.
Methods
Study design, setting and population
This study was conducted as part of the“Deepening our understanding of quality improve-ment in Europe (DUQuE)”project, which was funded by the European Union’s (EU) 7th Research Framework Programme [25]. The overall aim of the project was to study the relation-ship between organizational quality improvement systems and organizational culture, profes-sional involvement and patient empowerment at hospital and departmental level, and the impact of these constructs on the quality of care delivered, measured in terms of clinical effec-tiveness, patient safety and patient experience.
both compliance with process of care measures and outcomes of care (complications, mortal-ity) that would allow for analysis of associations between these measured constructs.
We employed a cross-sectional, multi-level study design in which patient-level measure-ments are nested in hospital departmeasure-ments, which are in turn nested in hospitals in 7 EU coun-tries. Selected countries had to have a sufficient number of hospitals to fulfil sampling criteria, represent varied approaches to financing and organizing health care, have research staff with experience in conducting comprehensive field tests and represent the geographical reach of the EU. Turkey was included because of the status of its EU candidacy at the start of the project. The countries invited to participate in the field test were the Czech Republic, England, France, Germany, Poland, Portugal, Spain and Turkey.
Outcomes, predictors and covariates
The outcome variables in this study are a set of PREMs collected at patient level. We developed a questionnaire that included a generic 6-item measure of patient experience (The Nordic Patient Experience Questionnaire) [27] and a 3-item measure of patient-perceived discharge preparation (Health Care Transition Measure) [28], supported by two single item measures on perceived involvement in care [19] and hospital recommendation [16]. All four measures were assessed for each group of patients (AMI, Stroke, hip fracture, deliveries).
Predictor variables include three measures: First, a measure of the maturity of the hospital quality management system assessed by a questionnaire administered to the hospital quality manager. Second, a measure of departmental strategies for the involvement of patients or their representatives in quality management functions assessed by a questionnaire administered to the head of the department. Third, a measure of the implementation of patient-centered care strategies, assessed by an external visit to the department. These measures build on previously validated tools (Table 1), [29–31].
Covariates including in the statistical analysis include country, hospital teaching status (teaching vs non-teaching), hospital size (<200, 200–500, 501–100, or>1000 beds), hospital ownership (public vs not public) and (at patient level) patient age, gender, level of health liter-acy (single item Health Literliter-acy Screener), and education level (no education, primary educa-tion, secondary educaeduca-tion, further education beyond school, or university level education). Further details on outcome and predictor variables are presented inTable 1.
Data collection
General acute care hospitals (public or private, teaching or non-teaching) with a minimum hospital size of 130 beds were considered for inclusion into the study. Hospitals were required to have a sufficient volume of care to ensure recruitment of 30 patients per condition over a 4-month period (a sample frame of a minimum of 90 patients). Hospitals were randomly selected in the participating countries between May 2011 and January 2012. Each hospital con-tributed patient level data from four conditions/pathways: acute myocardial infarction (AMI), stroke, hip fracture and deliveries.
were not included partly due to delays in obtaining ethical approval and also extensive diffi-culty recruiting hospitals. Similarly, it proved difficult to recruit hospitals in Germany to the study and only 4 hospitals from this country were included in the analysis. Data was collected using a bespoke IT platform. The overall response rate for the different questionnaires was between 75 and 100% for the assessed measures. Detailed sample size calculations and infor-mation on response rates have been reported previously [25,26].
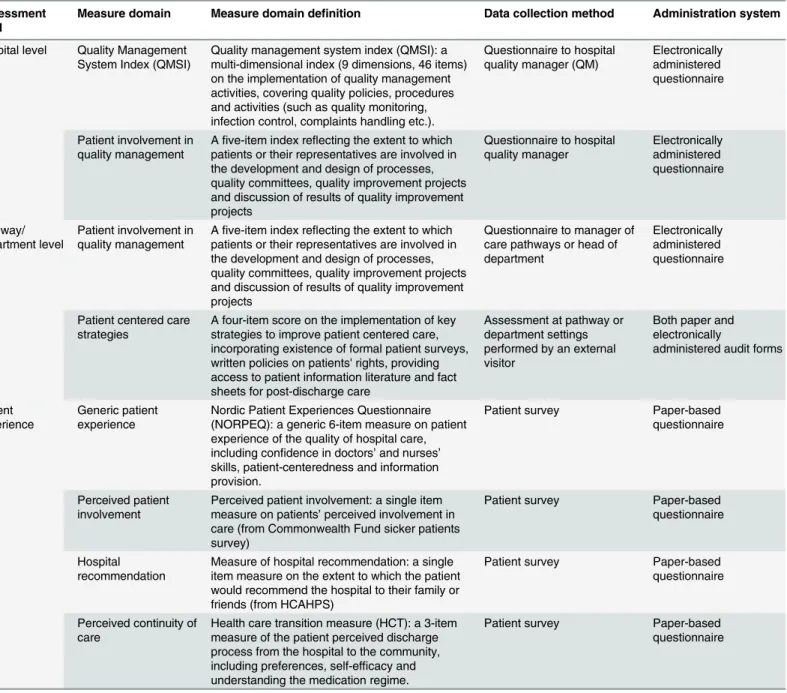
Table 1. Constructs, measure domains and data collection methods used in this study.
Assessment level
Measure domain Measure domain definition Data collection method Administration system
Hospital level Quality Management System Index (QMSI)
Quality management system index (QMSI): a multi-dimensional index (9 dimensions, 46 items) on the implementation of quality management activities, covering quality policies, procedures and activities (such as quality monitoring, infection control, complaints handling etc.).
Questionnaire to hospital quality manager (QM)
Electronically administered questionnaire
Patient involvement in quality management
Afive-item index reflecting the extent to which patients or their representatives are involved in the development and design of processes, quality committees, quality improvement projects and discussion of results of quality improvement projects
Questionnaire to hospital quality manager Electronically administered questionnaire Pathway/ department level
Patient involvement in quality management
Afive-item index reflecting the extent to which patients or their representatives are involved in the development and design of processes, quality committees, quality improvement projects and discussion of results of quality improvement projects
Questionnaire to manager of care pathways or head of department
Electronically administered questionnaire
Patient centered care strategies
A four-item score on the implementation of key strategies to improve patient centered care, incorporating existence of formal patient surveys, written policies on patients' rights, providing access to patient information literature and fact sheets for post-discharge care
Assessment at pathway or department settings performed by an external visitor
Both paper and electronically
administered audit forms
Patient experience
Generic patient experience
Nordic Patient Experiences Questionnaire (NORPEQ): a generic 6-item measure on patient experience of the quality of hospital care, including confidence in doctors’and nurses’
skills, patient-centeredness and information provision.
Patient survey Paper-based questionnaire
Perceived patient involvement
Perceived patient involvement: a single item measure on patients’perceived involvement in care (from Commonwealth Fund sicker patients survey)
Patient survey Paper-based questionnaire
Hospital recommendation
Measure of hospital recommendation: a single item measure on the extent to which the patient would recommend the hospital to their family or friends (from HCAHPS)
Patient survey Paper-based questionnaire
Perceived continuity of care
Health care transition measure (HCT): a 3-item measure of the patient perceived discharge process from the hospital to the community, including preferences, self-efficacy and understanding the medication regime.
Patient survey Paper-based questionnaire
Hypotheses and analytical strategy
We hypothesized that higher PREM scores are achieved in hospitals (i) with more mature qual-ity management systems, (ii) that involve patients in qualqual-ity management functions and (iii) that implement key patient-centered care strategies.
We used directed acyclic graphs (DAGs) to depict our knowledge and assumptions about the (plausible) interrelationships between the predictor and outcome variables. The edges in the DAG encode relations between predictors, outcomes and covariates and are governed by formal rules that can be used to guide the choice of covariates for confounding control [32,33] (Fig 1).
According to our directed acyclic graph (Fig 1), in order (i) to estimate the effect of quality management systems on any PREM we adjusted for country as well as hospital-level and patient-level confounders; (ii) to estimate the effect of patient involvement in quality manage-ment on any PREM we adjusted for country, hospital-level and patient-level confounders, and quality management system index; and (iii) to estimate the effect of patient centered care strat-egies on any PREM we adjusted for country, hospital-level and patient-level confounders, qual-ity management system index, and departmental-level patient involvement in QM. We estimated multivariable linear mixed models using PROC MIXED, with random intercept by hospital, and additionally adjusted for country, and fixed effects at the hospital level, and patient level in accordance with the DAG. All analyses were conducted using SAS version 9.3 (SAS Institute, Cary, NC, USA).
Fig 1. Directed acyclic graph of the relations between predictor and outcome variables.Note: A dashed bi-directed arrow represents the presence of an unmeasured common cause of the variables at the arrowhead. A variable at the tail of an arrow is considered a cause or a parent of the variable at the arrowhead. Alternatively, the arrow between any two variables can be read, in a non-causal way, as representing the flow of statistical information or the presence of statistical dependence between the two variables.
Ethical and confidentiality
DUQuE fulfilled the requirements for research projects as described in the 7th framework of EU DG Research. Ethics approval was granted by the Department of Health of the Government of Catalonia, Spain. Data collection in each country complied with confidentiality require-ments according to national legislation or standards of practice of that country. All data was anonymous and codes were used for hospitals and countries.
Minimum data supporting the data tables have been published in the public domain under
http://dx.doi.org/10.6084/m9.figshare.1422011.
Results
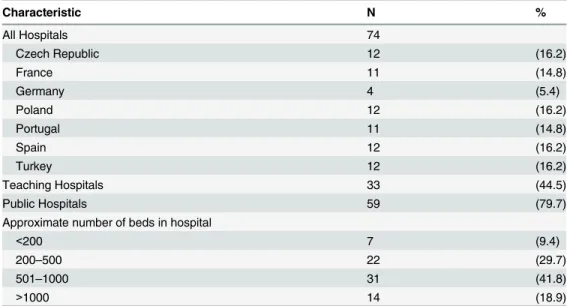
Overall, 276 departments from 74 hospitals contributed patient-level data to be included in this study. The majority were public hospitals (79.7%) and about half (44.5%) were teaching hospitals. Larger hospitals with more than 500 beds accounted for more than half of the hospi-tals in the sample (Table 2).
6536 patients contributed sufficient data to the patient survey with an overall response rate of 75% [26]. The age and gender distribution is typical for the four conditions. Educational level is low for patients with hip fracture and stroke, reflecting the proportion of very old women in the study affected by these conditions. This is consistent with the values of the sin-gle-item health literacy screener, suggesting that hip fracture and stroke patients in the study have a low level of health literacy (Table 3).
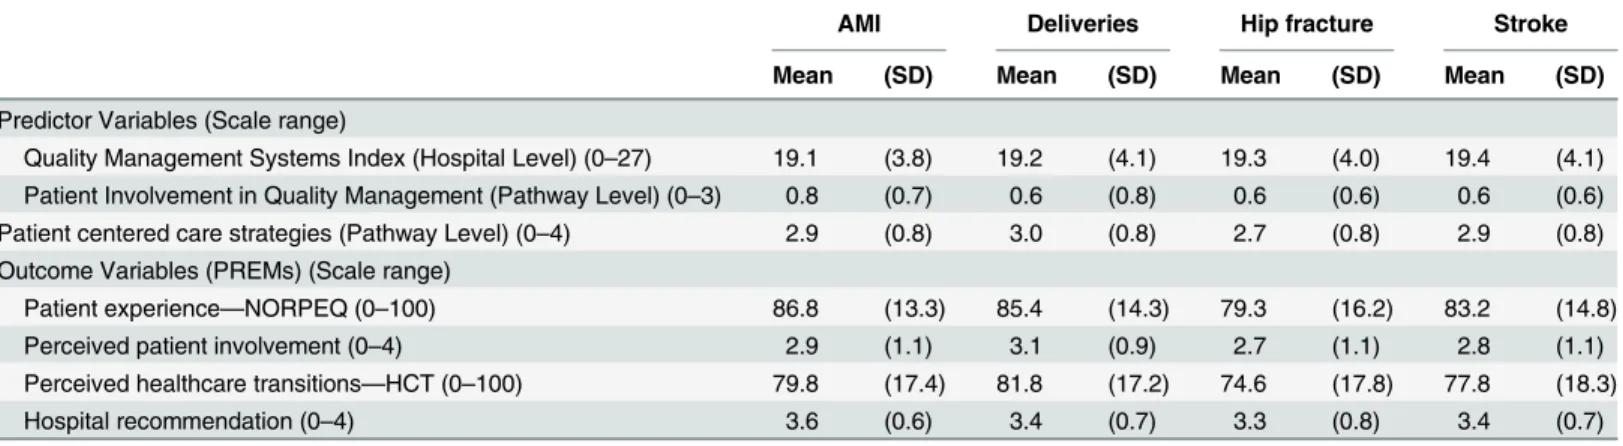
InTable 4we describe descriptive statistics for predictor and outcome variables. The overall mean score of the Quality Management Systems Index is 19 on a scale from 0–27 suggesting a substantial number of quality activities being implemented throughout the hospitals; however, also indicating future developmental potential. Minor differences observed here in the scores across pathways are the result of sampling with some hospitals not contribut-ing data for all departments.
The index score on the involvement of patient and their patient representative in quality management overall is low. It is slightly higher for acute myocardial infarction, but the current
Table 2. Characteristics of Hospitals participating in study.
Characteristic N %
All Hospitals 74
Czech Republic 12 (16.2)
France 11 (14.8)
Germany 4 (5.4)
Poland 12 (16.2)
Portugal 11 (14.8)
Spain 12 (16.2)
Turkey 12 (16.2)
Teaching Hospitals 33 (44.5)
Public Hospitals 59 (79.7)
Approximate number of beds in hospital
<200 7 (9.4)
200–500 22 (29.7)
501–1000 31 (41.8)
>1000 14 (18.9)
levels of patient involvement are as expected, given this issue has only recently gained promi-nence in research and practice.
The score for the implementation of patient centered care strategies reflects a high level of implementation. However, given that it is based on only basic strategies to improve patient-cen-tered care (such as implementing a policy or assessing patient views as opposed to demonstrating active engagement of patients), it also reflects further developmental potential amongst the par-ticipating hospitals. The average score is highest for deliveries and lowest for hip fracture.
The NORPEQ score is lowest for hip fracture and stroke and highest for AMI and deliveries, possibly reflecting the positive effect of treatment (or in the case of deliveries, the delivery of a Table 3. Characteristics of patient survey respondents.
Characteristics Acute Myocardial
Infarction
Deliveries Hip Fracture Stroke
Total number of respondents, N (%) 1379 (21.0) 2088 (31.9) 1503 (22.9) 1566 (23.9)
Gender, N (%)
Female 377 (27.3) 2057 (98.5) 1008 (67.0) 688 (43.9)
Male 952 (69.0) NA NA 427 (28.4) 830 (53.0)
Missing 50 (3.6) 31 (1.4) 68 (4.5) 48 (3.0)
Education level, N (%)
No education 122 (8.8) 52 (2.4) 268 (17.8) 225 (14.3)
Primary education 431 (31.2) 218 (10.4) 656 (43.6) 590 (37.6)
Secondary education 507 (36.7) 859 (41.1) 364 (24.2) 476 (30.3)
Beyond school 177 (12.8) 449 (21.5) 102 (6.7) 136 (8.6)
University 102 (7.3) 469 (22.4) 61 (4.0) 104 (6.6)
Missing 40 (2.9) 41 (1.9) 52 (3.4) 35 (2.2)
Age (years), Mean (SD) 63.1 (12.9) 29.3 (5.8) 76.0 (13.2) 68.1 (13.1)
Current health state1
Very good 208 (15.0) 764 (36.5) 126 (8.3) 147 (9.3)
Good 685 (49.6) 1088 (52.1) 632 (42.0) 680 (43.4)
Fair 401 (29.0) 207 (9.9) 599 (39.8) 609 (38.8)
Poor or very poor 57 (4.1) 11 (0.5) 122 (8.1) 117 (7.4)
Health literacy1 1.45 (1.7) 0.86 (1.4) 1.97 (1.7) 1.81 (1.7)
1On a scale from 0
–4, 0 meaning“none at all”and 4 meaning“to a very large extent”, how much help do you need when you read instructions, pamphlets or other written material from your doctor or pharmacy?
doi:10.1371/journal.pone.0131805.t003
Table 4. Descriptive statistics for predictor and outcome variables.
AMI Deliveries Hip fracture Stroke
Mean (SD) Mean (SD) Mean (SD) Mean (SD)
Predictor Variables (Scale range)
Quality Management Systems Index (Hospital Level) (0–27) 19.1 (3.8) 19.2 (4.1) 19.3 (4.0) 19.4 (4.1) Patient Involvement in Quality Management (Pathway Level) (0–3) 0.8 (0.7) 0.6 (0.8) 0.6 (0.6) 0.6 (0.6) Patient centered care strategies (Pathway Level) (0–4) 2.9 (0.8) 3.0 (0.8) 2.7 (0.8) 2.9 (0.8) Outcome Variables (PREMs) (Scale range)
Patient experience—NORPEQ (0–100) 86.8 (13.3) 85.4 (14.3) 79.3 (16.2) 83.2 (14.8)
Perceived patient involvement (0–4) 2.9 (1.1) 3.1 (0.9) 2.7 (1.1) 2.8 (1.1)
Perceived healthcare transitions—HCT (0–100) 79.8 (17.4) 81.8 (17.2) 74.6 (17.8) 77.8 (18.3)
Hospital recommendation (0–4) 3.6 (0.6) 3.4 (0.7) 3.3 (0.8) 3.4 (0.7)
healthy baby) in the latter. The perceived involvement of patients in their care process is high-est for deliveries and similar for AMI, hip fracture and stroke, possibly reflecting the effect of the age-group, but also the clinical condition. This is similar for perceived health care transi-tions, yet here the scores for hip fracture are the lowest across the four conditions. The scores reflecting patient’s recommendation of the hospital is very high with a mean value of 3.6 on a scale from 0–4, and highest amongst patients in the AMI pathway.
Table 5reports the results of the associational analysis between predictors and PREMs.
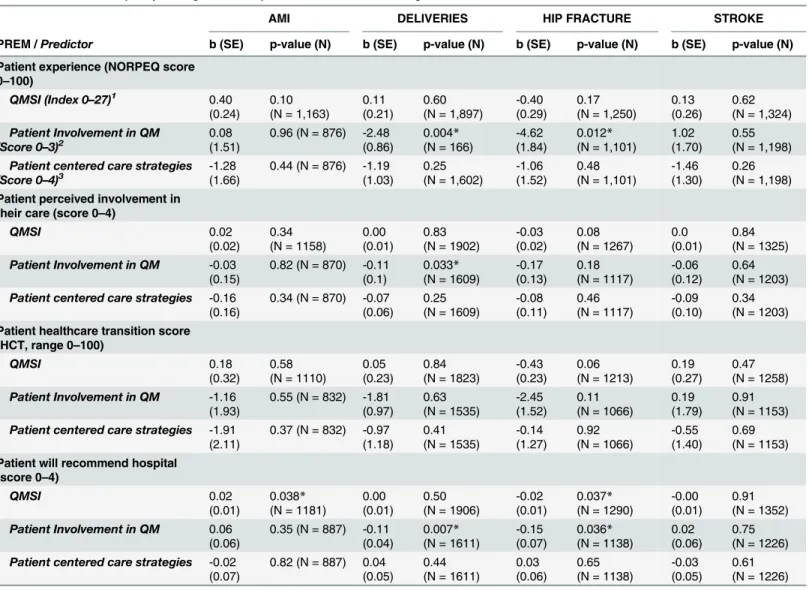
Table 5. Associations between patient-reported experience measures and predictor variables quality management systems index, patient per-ceived involvement in quality management and patient-centered care strategies.
AMI DELIVERIES HIP FRACTURE STROKE
PREM /Predictor b (SE) p-value (N) b (SE) p-value (N) b (SE) p-value (N) b (SE) p-value (N)
Patient experience (NORPEQ score 0–100)
QMSI (Index 0–27)1 0.40
(0.24)
0.10 (N = 1,163)
0.11 (0.21)
0.60 (N = 1,897)
-0.40 (0.29)
0.17 (N = 1,250)
0.13 (0.26)
0.62 (N = 1,324)
Patient Involvement in QM (Score 0–3)2
0.08 (1.51)
0.96 (N = 876) -2.48 (0.86)
0.004*
(N = 166)
-4.62 (1.84)
0.012*
(N = 1,101)
1.02 (1.70)
0.55 (N = 1,198)
Patient centered care strategies (Score 0–4)3
-1.28 (1.66)
0.44 (N = 876) -1.19 (1.03)
0.25 (N = 1,602)
-1.06 (1.52)
0.48 (N = 1,101)
-1.46 (1.30)
0.26 (N = 1,198)
Patient perceived involvement in their care (score 0–4)
QMSI 0.02
(0.02)
0.34 (N = 1158)
0.00 (0.01)
0.83 (N = 1902)
-0.03 (0.02)
0.08 (N = 1267)
0.0 (0.01)
0.84 (N = 1325)
Patient Involvement in QM -0.03 (0.15)
0.82 (N = 870) -0.11 (0.1)
0.033*
(N = 1609)
-0.17 (0.13)
0.18 (N = 1117)
-0.06 (0.12)
0.64 (N = 1203)
Patient centered care strategies -0.16 (0.16)
0.34 (N = 870) -0.07 (0.06)
0.25 (N = 1609)
-0.08 (0.11)
0.46 (N = 1117)
-0.09 (0.10)
0.34 (N = 1203)
Patient healthcare transition score (HCT, range 0–100)
QMSI 0.18
(0.32)
0.58 (N = 1110)
0.05 (0.23)
0.84 (N = 1823)
-0.43 (0.23)
0.06 (N = 1213)
0.19 (0.27)
0.47 (N = 1258)
Patient Involvement in QM -1.16 (1.93)
0.55 (N = 832) -1.81 (0.97)
0.63 (N = 1535)
-2.45 (1.52)
0.11 (N = 1066)
0.19 (1.79)
0.91 (N = 1153)
Patient centered care strategies -1.91 (2.11)
0.37 (N = 832) -0.97 (1.18)
0.41 (N = 1535)
-0.14 (1.27)
0.92 (N = 1066)
-0.55 (1.40)
0.69 (N = 1153)
Patient will recommend hospital (score 0–4)
QMSI 0.02
(0.01)
0.038*
(N = 1181)
0.00 (0.01)
0.50 (N = 1906)
-0.02 (0.01)
0.037*
(N = 1290)
-0.00 (0.01)
0.91 (N = 1352)
Patient Involvement in QM 0.06 (0.06)
0.35 (N = 887) -0.11 (0.04)
0.007*
(N = 1611)
-0.15 (0.07)
0.036*
(N = 1138)
0.02 (0.06)
0.75 (N = 1226)
Patient centered care strategies -0.02 (0.07)
0.82 (N = 887) 0.04 (0.05)
0.44 (N = 1611)
0.03 (0.06)
0.65 (N = 1138)
-0.03 (0.05)
0.61 (N = 1226)
1
Multivariable linear mixed model, with random intercept by hospital, additionally adjusted for country, andfixed effects at the hospital level (number of beds, teaching status, and ownership) and patient level (gender, education, health literacy, and age).
2
Multivariable linear mixed model, with random intercept by hospital, additionally adjusted for country, andfixed effects at the hospital level (number of beds, teaching status, ownership, and QMSI), and patient level (gender, education, health literacy, and age).
3Multivariable linear mixed model, with random intercept by hospital, additionally adjusted for country, and
fixed effects at the hospital level (number of beds, teaching status, ownership, and QMSI), patient level (gender, education, health literacy, and age), and department level patient involvement
*significant at p<0.05 level.
Relationships between hospital and pathway level predictors (Quality Management Systems Index, Score on Patient Involvement in Quality Management and Implementation of Patient-Centered Care Strategies) and the four outcome measures (NORPEQ Patient Experience Mea-sure, Patient Perceived Involvement in Care, Health Care Transition, and Hospital Recommen-dation) are presented for each of the four pathways.
Only two of the analyses reported are statistically significant at the p<0.05 levelandhave a substantive b-value. Both analyses relate to the effect of Patient Involvement in Quality Man-agement on the NORPEQ Patient Experience measure for the deliveries (b = -2.48, p = 0.004) and hip fracture pathway (b = -4.62, p = 0.012).
Four significant associations are also observed for the relationship between predictor vari-able and the score on patient recommendation of the hospital; however, their corresponding b value is likely too low to be considered important.
Discussion
This is the largest study so far to assess the complex relationship between hospital quality man-agement systems, strategies of patient involvement and patient-centeredness in conjunction with a range of patient reported outcome measures.
Our association analysis found only a few statistically significant relationships between pre-dictor variables and PREMs. Only two of the statistical models yielded substantive effect sizes (on the effect of patient involvement in quality management and NORPEQ score for the deliv-eries and hip fracture pathway); however, suggesting an inverse relationship between predictor and outcome variables. Four significant associations are also observed for the relationship between predictor variable and the score on patient recommendation of the hospital; but their corresponding b value is likely too low to be considered important. The majority of models fit-ted were either statistically non-significant or exhibifit-ted an effect size of no clinical or practical significance. Overall, hospital strategies and PREMs appear to be unrelated in our study.
Various plausible explanations of these unexpected results exist. First, it is possible that strategies to improve patient-centeredness are addressed in other areas of hospital administra-tion, for example patient complaint programs, which are unconnected to the hospitals’quality management systems and were not assessed in this study [34]. In this case our measurement strategy may be insufficient to capture all activities with a potential impact on patient-centered-ness. However, it is plausible to assume that such programs typically deal only with selected groups of patients whereas our focus was on assessing whether hospital-wide governing sys-tems exist that that aim to improve patient-centeredness for all patients.
Secondly, PREMs might simply not (or only marginally) be affected by the range of policies, procedures and strategies that we assessed and be more responsive to a direct experience of professional-patient communication. Direct personal interactions of patients with physicians or nurses are more powerful predictors of patient experience [35–36]. This observation has been also been demonstrated in the research on health care accreditation which so far failed to detect a relationship between hospitals’accreditation status and patient satisfaction [37]. Yet, this reinforces our research question as to whether such communication processes can be sup-ported or facilitated by hospital wide management systems. Assessment of additional con-structs may be required to test this relationship (for example, are personal interactions of physicians and nurses with patients more patient-centered in organizations that promote such a patient-centered approach through their vision, policies and performance targets), but these were beyond the scope of our study.
that mainly address clinical components and resource use, and on the other an interrelated set of assumptions, expectations and expressions), which are only‘loosely coupled’[38]. Accord-ing to Orton and Weick, a‘loose coupling’between a management policy and procedures in a clinical department provide the advantage of flexible organization, reaction to local (patients’) needs and local problem solving. On the other hand, in loosely coupled systems systematic changes are more difficult to implement, inhibiting an organization’s strategic development [39,40]. More fundamentally, loose coupling may reflect a situation where hospitals created a
‘facade’of quality management strategies to attract recognition, funding, patients and status, while not successfully pursing their implementation. In addition, management policies and procedures might be implemented in different ways and supported by different management styles. In a related study that used the same dataset, we assessed the relationships between orga-nizational culture, orgaorga-nizational structure and quality management. Of the participating hos-pitals, 33% had a clan culture as their dominant culture type, 26% an open and developmental culture type, 16% a hierarchical culture type and 25% a rational culture type. Our findings sug-gest that the type of organizational culture was not associated with the development of quality management in hospitals [41].
Regarding the impact of patient involvement in quality management on PREMs the results are not so surprising. Engaging patients in quality management functions, as opposed to involving them in their own care, is a novel approach in health service delivery [42]. The seem-ingly counterintuitive inverse associations could be capturing a scenario where hospitals with poorer quality management were beginning to improve their patient experience. Our previous research suggests that this might be the case and calls for a more nuanced assessment of the motivation and impact of involving patients in the design and assessment of services [31,43].
If our findings were corroborated in further research they would be of high significance for clinical practice and quality management. It is well established that higher levels of patient experience are associated with treatment adherence, better use of preventive services, health care utilization, readmissions and other outcomes [4,8–9]. Based on this research evidence, achieving high levels of patient experience has become a cornerstone of hospital performance and has implication for the reimbursement and regulation of hospital services [44,45].
Quality management systems have largely evolved to address clinical effectiveness and patient safety—with varying degrees of success [46–49]. Whilst it is known that hospitals employ a wide range of strategies that potentially impact patient experience, the lack of organi-zational infrastructure (inadequacies of data and reporting mechanisms, unclear accountabili-ties for monitoring, implementation and improvement, lack of clinical integration and support) may mean that not all patients benefit from such strategies and that not all strategies are subject to scrutiny, such as clinical indicator programs [50]. In order to facilitate organiza-tion-wide learning and the application of quality improvement techniques those systems that have a positive impact on PREMs should be embedded in the overall quality management sys-tem [45,51]. Only then will a critical appraisal of possible deficiencies and achievements regarding patient-centered care be possible, similarly to hospitals’efforts to embrace patient-safety strategies as part of their organizations’quality management system in the last decade [52,53].
acute, emergency or medical health care services, or considering the effect of patient age or socio-economic background). Our DAG guided analysis aimed to adjust for these factors (and the country effect) in order to estimate the associations between our predictor and outcome variables.
This study has a number of limitations that need to be highlighted. First, we used a cross-sectional study design which ultimately does not conclusively establish causality. We dealt with this issue by using directed acyclic graphs that guided the development of our statistical models in terms of confounding control, incorporating theory and knowledge derived from previous research findings. This approach made it possible to adjust for hospital and country character-istics in ways that allowed us to address competing explanations and plausible (non-) causal associations, while minimizing sources of bias. A second limitation is related to the sampling strategy. Although sampling was conducted randomly, a generalization to participating coun-tries and hospitals is limited because of a possible self-selection of hospitals participating in the project. Our assessment of PREMs resonates with the literature, but the NORPEQ and HCT scores derived from our sample are slightly higher than those reported in previous research [54]. However, these higher scores should not affect the associational analysis.
Conclusion
This is the largest studies so far to assess the complex relationship between quality manage-ment strategies and patient experience with care. Our findings suggest absence and/or wide variations in the institutionalization of quality management systems, strategies to engage patients in quality management or strategies to improve patient-centeredness of care in hospi-tals. Selected seemingly counterintuitive inverse associations could be capturing a scenario where hospitals with poorer quality management were beginning to improve their patient experience. Hospitals should devise organizational strategies to ensure high performance on patient experience measures similar to the achievements on clinical performance measures, whilst ensuring that these additional efforts are not to the detriment of health professionals’
interactions with patients.
Acknowledgments
We thank the country coordinators for enabling the data collection and all respondents for their effort and time to fill out the questionnaires.
H and Kutryba B (Polish Society for Quality Promotion in Health Care-TPJ, POLAND); Escoval A and Lívio A (Portuguese Association for Hospital Development-APDH, PORTU-GAL) and Eiras M, Franca M and Leite I (Portuguese Society for Quality in Health Care-SPQS, PORTUGAL); Almeman F, Kus H and Ozturk K (Turkish Society for Quality Improvement in Healthcare-SKID, TURKEY); Mannion R (University of Birmingham, UK); Arah OA, DerSar-kissian M, Thompson CA and Wang A (University of California, Los Angeles-UCLA, USA); Thompson A (University of Edinburgh, UK)
Author Contributions
Conceived and designed the experiments: OG OAA NSK CW PDB SK FS AT CAT HP MD RS. Performed the experiments: OG OAA NSK CW PDB SK FS AT CAT HP MD RS. Analyzed the data: OAA CAT MD OG. Wrote the paper: OG OAA NSK CW PDB SK FS AT CAT HP MD RS.
References
1. Institute of Medicine. Crossing the quality chasm: a new health system for the 21st century. Washing-ton, DC: IOM, 2001.
2. Department of Health. High quality care for all: NHS next stage review final report. London: DH, 2008.
3. The Health Foundation. Person-centred care made simple. What everyone should know about person-centred care, The Health Foundation, London, 2014
4. Institute of Medicine. Envisioning the National Health Care Quality Report. Washington DC: National Academies Press, 2001
5. Balint E. The possibilities of patient-centred medicine. J R Coll Gen Pract 1969; 17: 269–276. PMID: 5770926
6. Engel GL. The need for a new medical model: a challenge for biomedicine. Science 1977; 196: 129–
136. PMID:847460
7. Lewin SA, Skea ZC, Entwistle VA, Zwarenstein M, Dick J. Interventions for providers to promote a patient-centred approach in clinical consultations (review). Cochrane Database of Systematic Reviews 2001 (4: ).
8. Black N, Jenkinson C. Measuring patients' experiences and outcomes. BMJ 2009; 339: b2495 doi:10. 1136/bmj.b2495PMID:19574317
9. Doyle C, Lennox L, Bell D. A systematic review of evidence on the links between patient experience and clinical safety and effectiveness. BMJ Open 2013; 3:e001570 doi:10.1136/bmjopen-2012-001570 PMID:23293244
10. Roter D, Larson S. The Roter interaction analysis system (RIAS): utility and flexibility for analysis of medical interactions. Patient Educ Couns 2002; 46: 243–251. PMID:11932123
11. Gerteis M, Edgman-Levitan S, Daley J, Delbanco TL. Through the Patient's Eyes: Understanding and Promoting Patient-Centred Care. San Francisco: Jossey Bass Publishers, 1993.
12. Coulter A, Jenkinson C. European patients' views on the responsiveness of health systems and health-care providers. Eur J Public Health 2005; 15: 355–360. PMID:15975955
13. Balik B, Conway J, Zipperer L, Watson J. Achieving an Exceptional Patient and Family Experience of Inpatient Hospital Care. IHI Innovation Series white paper. Cambridge, Massachusetts: Institute for Healthcare Improvement, 2011.
14. Black N. Patient reported outcome measures could help transform healthcare. BMJ 2013; 346: f167. doi:10.1136/bmj.f167PMID:23358487
15. Greaves F, Laverty AA, Millett C. Friends and family test results only moderately associated with con-ventional measures of hospital quality. BMJ 2013; 347: f4986. doi:10.1136/bmj.f4986PMID: 23963549
16. Westbrook KW, Babakus E, Grant CC. Measuring patient-perceived hospital service quality: validity and managerial usefulness of HCAHPS scales. Health Mark Q. 2014; 31:97–114. doi:10.1080/ 07359683.2014.907114PMID:24878401
18. Centre for Medicare & Medicaid Services. Hospital Value-Based Purchasing Program. Frequently asked questions. Last Updated March 9, 2012. http://www.cms.gov/Medicare/Quality-Initiatives- Patient-Assessment-Instruments/hospital-value-based-purchasing/Downloads/FY-2013-Program-Frequently-Asked-Questions-about-Hospital-VBP-3-9-12.pdf[accessed 19th March 2015]
19. Schoen C, Osborn R, Huynh PT, Doty M, Zapert K, Peugh J et al. Taking the pulse of health care sys-tems: experiences of patients with health problems in six countries. Health Affairs 2005. Suppl Web Exclusives:W5-25.
20. Coulter A, Jenkinson C. European patients' views on the responsiveness of health systems and health-care providers. Eur J Public Health 2005; 15: 355–360. PMID:15975955
21. Rudd RE, Groene OR, Navarro-Rubio MD. On health literacy and health outcomes: background, impact, and future directions. Rev Calid Asist. 2013; 28:188–92. doi:10.1016/j.cali.2013.03.003PMID: 23684050
22. McCarthy DM, Waite KR, Curtis LM, Engel KG, Baker DW, Wolf MS. What did the doctor say? Health literacy and recall of medical instructions. Med Care 2012; 50: 277–82. doi:10.1097/MLR.
0b013e318241e8e1PMID:22411440
23. Rozenblum R, Lisby M, Hockey PM, Levtzion-Korach O, Salzberg CA, Efrati N et al. The patient satis-faction chasm: the gap between hospital management and frontline clinicians. BMJ Qual Saf. 2013; 22: 242–50. doi:10.1136/bmjqs-2012-001045PMID:23178858
24. Taylor A, Groene O. Experiences of European hospital managers regarding patient centred care: a qualitative study. Journal Health Management and Organization 2015; 29 [in press]
25. Groene O, Klazinga N, Wagner C, Arah OA, Thompson A, Bruneau C et al. Investigating organizational quality improvement systems, patient empowerment, organizational culture, professional involvement and the quality of care in European hospitals: the 'Deepening our Understanding of Quality Improve-ment in Europe (DUQuE)' project. BMC Health Serv Res 2010; 24: 10:281.
26. Secanell M, Groene O, Arah OA, Lopez MA, Kutryba B, Pfaff H et al. Deepening our understanding of quality improvement in Europe (DUQuE): overview of a study of hospital quality management in seven countries. Int J Qual Health Care 2014; 26(Suppl 1):5–15. doi:10.1093/intqhc/mzu025PMID: 24671120
27. Oltedal S, Garratt A, Bjertnæs O, Bjørnsdottìr M, Freil M, Sachs M. The NORPEQ patient experiences
questionnaire: Data quality, internal consistency and validity following a Norwegian inpatient survey. Scand J Public Health 2007; 35; 540 PMID:17852989
28. Coleman EA, Mahoney E, Parry C. Assessing the Quality of Preparation for Post-Hospital Care from the Patient's Perspective: The Care Transitions Measure. Medical Care. 2005; 43: 246–255 PMID: 15725981
29. Wagner C, Groene O, Thompson CA, Klazinga NS, Dersarkissian M, Arah OA et al. Development and validation of an index to assess hospital quality management systems. Int J Qual Health Care. 2014; 26 Suppl 1:16–26. doi:10.1093/intqhc/mzu021PMID:24618212
30. Groene O, Lombarts MJ, Klazinga N, Alonso J, Thompson A, Suñol R. Is patient-centredness in
Euro-pean hospitals related to existing quality improvement strategies? Analysis of a cross-sectional survey (MARQuIS study). Qual Saf Health Care. 2009 Feb; 18 Suppl 1:i44–50. doi:10.1136/qshc.2008. 029397PMID:19188461
31. Groene O, Sunol R, Klazinga NS, Wang A, Dersarkissian M, Thompson CA et al. Involvement of patients or their representatives in quality management functions in EU hospitals: implementation and impact on patient-centred care strategies. Int J Qual Health Care. 2014; 26 Suppl 1:81–91. doi:10. 1093/intqhc/mzu022PMID:24615596
32. Pearl J. Causal diagrams for empirical research (with discussion). Biometrika 1995; 82: 669–710.
33. Pearl J. Causality: Models, Reasoning and Inference. 2nd Edition. Cambridge: Cambridge University Press, 2009.
34. Reader TW, Gillespie A, Roberts J. Patient complaints in healthcare systems: a systematic review and coding taxonomy. BMJ Qual Saf. 2014; 23: 678–89 doi:10.1136/bmjqs-2013-002437PMID: 24876289
35. De Vries AM, de Roten Y, Meystre C, Passchier J, Despland JN, Stiefel F. Clinician characteristics, communication, and patient outcome in oncology: a systematic review. Psychooncology. 2014; 23: 375–81. doi:10.1002/pon.3445PMID:24243790
36. Edwards A, Elwyn G, Hood K, Robling M, Atwell C, Holmes-Rovner M et al. The development of COM-RADE—a patient-based outcome measure to evaluate the effectiveness of risk communication and treatment decision making in consultations. Patient Educ Couns. 2003; 50: 311–22. PMID:12900105 37. Greenfield D, Braithwaite J. Health sector accreditation research: a systematic review. Int J Quality
38. Orton JD, Weick KE. Loosely Coupled Systems: A Reconceptualization. The Academy of Management Review 1990; 15: 203–223.
39. Weick KE, Quinn RE. Organizational change and development. Annu Rev Psychol. 1999; 50:361–86. PMID:15012461
40. Berwick DW. What‘Patient-Centered’Should Mean: Confessions Of An Extremist. Health Aff 2009 28: w555–w565,doi:10.1377/hlthaff.28.4.w555
41. Wagner C, Mannion R, Hammer A, Groene O, Arah OA, Dersarkissian M. The associations between organizational culture, organizational structure and quality management in European hospitals. Int J Qual Health Care 2014; 26 Suppl 1:74–80. doi:10.1093/intqhc/mzu027PMID:24671119
42. Renedo A, Marston CA, Spyridonidis D, Barlow J. Patient and Public Involvement in Healthcare Quality Improvement: How organizations can help patients and professionals to collaborate. Public Manage-ment Review 2014; 17: 1–18.
43. Groene O. Patient centredness and quality improvement efforts in hospitals: rationale, measurement, implementation. Int J Qual Health Care. 2011; 23: 531–7. doi:10.1093/intqhc/mzr058PMID: 21862449
44. McClelland LE, Vogus TJ. Compassion practices and HCAHPS: does rewarding and supporting work-place compassion influence patient perceptions? Health Serv Res 2014; 49:1670–83. doi:10.1111/ 1475-6773.12186PMID:24837713
45. NICE Guidance CG 138. Patient experience in adult NHS services: improving the experience of care for people using adult NHS services. 2012http://www.nice.org.uk/guidance/cg138
46. Weiner BJ, Alexander JA, Baker LC, Shortell SM, Becker M. Quality improvement implementation and hospital performance on patient safety indicators. Med Care Res Rev. 2006; 63: 29–57. PMID: 16686072
47. Weiner BJ, Alexander JA, Shortell SM, Baker LC, Becker M, Geppert JJ. Quality improvement imple-mentation and hospital performance on quality indicators. Health Serv Res 2006; 41: 307–34. PMID: 16584451
48. Suñol R, Vallejo P, Thompson A, Lombarts MJ, Shaw CD, Klazinga N. Impact of quality strategies on
hospital outputs. Qual Saf Health Care. 2009; 18 Suppl 1:i62–8. doi:10.1136/qshc.2008.029439PMID: 19188464
49. Groene O. Does quality improvement face a legitimacy crisis? Poor quality studies, small effects. J Health Serv Res Policy. 2011; 16: 131–2. doi:10.1258/jhsrp.2011.011022PMID:21719476 50. Alexander JA, Weiner BJ, Shortell SM, Baker LC, Becker MP. The role of organizational infrastructure
in implementation of hospitals' quality improvement. Hosp Top. 2006; 84:11–20.
51. Coulter A, Locock L, Ziebland S, Calabrese J. Collecting data on patient experience is not enough: they must be used to improve care. BMJ. 2014; 348:g2225. doi:10.1136/bmj.g2225PMID:24671966 52. Arah OA, Klazinga NS. How safe is the safety paradigm? Qual Saf Health Care. 2004; 13: 226–32.
PMID:15175496