i
SPATIOTEMPORAL FLOOD HAZARD AND FLOOD
RISK ASSESSMENT USING REMOTE SENSING
TECHNIQUES
Case study: Khartoum State, Sudan
ii
SPATIOTEMPORAL FLOOD HAZARD AND FLOOD RISK
ASSESSMENT USING REMOTE SENSING TECHNIQUES IN
KHARTOUM STATE, SUDAN
Dissertation supervised by PhD, Ana Cristina Marinho da Costa
PhD, Filiberto Pla Banon PhD, Marco Octávio Trindade Painho
iii DECLARATION OF ORIGINALITY
I declare that the work described in this document is my own and not
from someone else. All the assistance I have received from other people
is duly acknowledged and all the sources (published or not published)
are referenced.
This work has not been previously evaluated or submitted to NOVA
Information Management School or elsewhere.
Lisbon, February 14
th, 2020
Abeer Awad Abdulmagied Khairy
iv ACKNOWLEDGMENTS
O Allah, our Lord, to thee be the praise in all the heavens, and in all the earth, and in all that it pleases Thee to create afterwards. O thou Who art worthy of praise and glory, most worthy of what a servant says, and we are all thy servants, no one can withhold what Thou givest or give what Thou withholdest. It is only through the guidance of Allah that this work has been accomplished, and to Him all the praise is due.
Thereafter, I would like to express my sincere appreciation to my supervisors, whom, without their continuous support and encouragement I wouldn’t have been able to accomplish this work. I am grateful for and honored by all the energy and time you have put through this work, for your insightful observations and comments that helped me improve on my work. I would like to thank the European Commission for facilitating the Erasmus Mundus Joint Master Program and thus allowing me to benefit from this unique opportunity. I also want to extend my gratitude to the staff and faculty members of NOVA Information Management School IMS for providing me with endless support throughout the course of the thesis work.
I would like to thank my friend Brendan O'Hanrahan, for his encouragement and help in getting extra information, and Abdallah Almokashfi and Ghazi Elrayah for their support.
I am humbled by the amount of emotional and physical support that my small and extended family have given me to carry through and complete this work. Forever I will be in gratitude for my sisters, my husband Ahmed, and my in-laws, who, through their words of advice and support gave me the strength to push forward.
Finally, I dedicate this work to my daughter, my mother, and my late father, all that I am and all that I do is due to you and for you, you are my forte.
v
Spatiotemporal flood hazard and flood risk assessment using
remote sensing techniques
Case study: Khartoum State, Sudan
ABSTRACT
The state of Khartoum being the most populated state in Sudan, faces the consequences of floods recurrence almost annually during rainy season. Policy makers and on ground NGOs need to tackle the hazard of floods in an effective and efficient manner. Recent research demonstrated the capabilities and potentials of remote sensing in flood hazard and risk mapping. This study aims to map flood hazard and assess the risk of floods in state of Khartoum, Sudan. In order to identify the flood hazard in state counties, an inundation indicator is used, namely the relative frequency of inundation (RFI).
Flood events that occurred from 1988 to 2018 were mapped using Landsat satellite images, and maximum flood extent was then delineated. RFI was obtained using maximum flood extent maps and served as the flood hazard map. We developed a Land Cover Land Use (LCLU) map using Landsat 8 to identify affected urban and croplands areas in the state of Khartoum. RFI values was used along with LCLU map to assess state counties, and to assess the vulnerability of public facilities (health and educational facilities) using zonal statistics. It was demonstrated that, in terms of average RFI values for LCLU classes per county, croplands had the highest flood hazard, and Urban areas carried a relatively moderate flood hazard. The results of this study indicate that croplands on the riverbanks are the most inundated areas in the state of Khartoum, and the most urbanized counties have the highest flood hazard.
vi
KEYWORDS
Flood Hazard Mapping Flood Risk Assessment Remote Sensing
vii
ACRONYMS
AHP – Analytical Hierarchy Process
CCD – Cold Cloud Duration
IDW – Inverse Distance Weighting
LCLU – Land Cover Land Use
MCA – Multi-Criteria Analysis methods
NDBI – Normalized Difference Built-up Index
NDVI – Normalized Difference Vegetation Index
NDWI – Normalized Difference Water Index
OSM – Open Street Maps
RFI – Relative Frequency of Inundation
SAR – Synthetic Aperture Radar
UNDRR – United Nation Office for Disaster Risk Reduction
UNITAR – United Nation Institute for Training and Research
UNOSAT – UNITAR’s Operational Satellite Application Programme
UNOCHA – United Nation’s Office for Coordination of Humanitarian Affairs
USGS - United States Geological Survey
VHR – Very High Resolution
viii INDEX OF THE TEXT
ACKNOWLEDGMENTS ... IV ABSTRACT ... V KEYWORDS ... VI ACRONYMS ... VII 1. INTRODUCTION ... 1 1.1. MOTIVATION ... 1 1.2. AIM AND OBJECTIVES ... 1 1.3. THESIS OUTLINE ... 2 2. LITERATURE REVIEW ... 3
2.1. FLOOD RISK ASSESSMENT USING REMOTELY SENSED DATA ... 3
2.2. FLOOD RISK ASSESSMENT IN SUDAN ... 5
3. METHODS ... 6
3.1. STUDY AREA ... 8
3.2. DATA ... 9
3.2.1. Remotely Sensed Data ... 9
3.2.1. Auxiliary Data ... 11
3.3. MAPPING FLOOD EXTENT ... 11
3.4. MAPPING MAXIMUM FLOOD EXTENT ... 12
3.5. RELATIVE FREQUENCY OF INUNDATION ... 13
3.6. FLOOD RISK ASSESSMENT ... 14
3.6.1. LCLU Map... 14
3.6.2. Zonal Statistics ... 15
4. RESULTS AND DISCUSSION ... 17
4.1. FLOOD EXTENT MAPS ... 17
4.1.1. Scan-Line Corrector (SLC) problem ... 17
4.2. MAXIMUM FLOOD EXTENT MAPS ... 18
4.3. RELATIVE FREQUENCY OF INUNDATION MAP ... 20
4.4. FLOOD RISK ASSESSMENT ... 21
4.4.1. LCLU Map... 21
4.4.2. Zonal Statistics ... 24
4.5. HUMANITARIAN MAPPING RESPONSE FOR AUGUST 2013 AND JULY 2016FLOOD EVENTS 25 5. CONCLUSION ... 30
5.1. LIMITATIONS... 31
5.2. RECOMMENDATIONS ... 31
REFERENCES ... 32
ANNEX 1: SPECTRAL SPECIFICATIONS FOR LANDSAT IMAGES ... 36
ANNEX 2: MAXIMUM FLOOD EXTENT MAP FOR 1991 ... 38
ix
ANNEX 4: MAXIMUM FLOOD EXTENT FOR 1993 ... 40
ANNEX 5: MAXIMUM FLOOD EXTENT FOR 1994 ... 41
ANNEX 6: MAXIMUM FLOOD EXTENT FOR 1996 ... 42
ANNEX 7: MAXIMUM FLOOD EXTENT FOR 1997 ... 43
ANNEX 8: MAXIMUM FLOOD EXTENT FOR 1998 ... 44
ANNEX 9: MAXIMUM FLOOD EXTENT FOR 1999 ... 45
ANNEX 10: MAXIMUM FLOOD EXTENT FOR 2001 ... 46
ANNEX 11: MAXIMUM FLOOD EXTENT FOR 2003 ... 47
ANNEX 12: MAXIMUM FLOOD EXTENT FOR 2005 ... 48
ANNEX 13: MAXIMUM FLOOD EXTENT FOR 2006 ... 49
ANNEX 14: MAXIMUM FLOOD EXTENT FOR 2007 ... 50
ANNEX 15: MAXIMUM FLOOD EXTENT FOR 2009 ... 51
ANNEX 16: MAXIMUM FLOOD EXTENT FOR 2013 ... 52
ANNEX 17: MAXIMUM FLOOD EXTENT FOR 2016 ... 53
ANNEX 18: MAXIMUM FLOOD EXTENT FOR 2017 ... 54
ANNEX 19: MAXIMUM FLOOD EXTENT FOR JUNE 2018 ... 55
ANNEX 20: MAXIMUM FLOOD EXTENT FOR AUGUST - SEPTEMBER 2018 ... 56
ANNEX 21: MAXIMUM FLOOD EXTENT FOR NOVEMBER 2018 ... 57
ANNEX 22: ERROR MATRIX AND UNCERTAINTY AND CONFIDENCE ANALYSIS FOR LCLU MAP ... 58
ANNEX 23: NDWI FOR 15/09/2016 LANDSAT IMAGE ... 59
ANNEX 24: RFI ZONAL STATISTICS FOR KHARTOUM STATE COUNTIES ... 60
ANNEX 25: RFI DESCRIPTIVE STATISTICS FOR HEALTH AND EDUCATIONAL FACILITIES IN KHARTOUM STATE ... 62
x INDEX OF TABLES
Table 1: Remotely Sensed Images specifications ... 9
Table 2: Classes and the corresponding values ... 12
Table 3: Change matrix for 1988 flood event ... 19
Table 1: Landsat 4 - 5 (TM) bands specifications (Source: U.S. Geological Survey)... 36
Table 2: Landsat 7 (ETM+) bands specifications (Source: U.S. Geological Survey) ... 36
Table 3: Landsat 8 (OLI - TIRS) bands specifications (Source: U.S. Geological Survey) ... 37
Table 1: Change matrix for 1991 flood event ... 38
Table 1: Change matrix for 1992 flood event ... 39
Table 1: Change matrix for 1993 flood event ... 40
Table 1: Change matrix for 1994 flood event ... 41
Table 1: Change matrix for 1996 flood event ... 42
Table 1: Change matrix for 1997 flood event ... 43
Table 1: Change matrix for 1998 flood event ... 44
Table 1: Change matrix for 1999 flood event ... 45
Table 1: Change matrix for 2001 flood event ... 46
Table 1: Change matrix for 2003 flood event ... 47
Table 1: Change matrix for 2005 flood event ... 48
Table 1: Change matrix for 2006 flood event ... 49
Table 1: Change matrix for 2007 flood event ... 50
Table 1: Change matrix for 2009 flood event ... 51
Table 1: Change matrix for 2013 flood event ... 52
Table 1: Change matrix for 2016 flood event ... 53
Table 1: Change matrix for 2017 flood event ... 54
Table 1: Change matrix for June 2018 flood event ... 55
Table 1: Change matrix for August 2018 flood event ... 56
Table 1: Change matrix for November 2018 flood event ... 57
Table 1: Accuracy assessment results for LCLU Map ... 58
xi INDEX OF FIGURES
Figure 1: Methodology Flow Chart ... 7 Figure 2: Study Area ... 8 Figure 3: RFI Mapping Process ... 14 Figure 4: An example of an image acquired from Landsat 7 on October 06, 2006 (left), and the SLC
misclassification problem in classified flood extent map (right) ... 18 Figure 5: Maximum Flood Extent Map for 1988 ... 19 Figure 6: Khartoum State Flood Hazard Map using the relative frequency of inundation (RFI)
derived from Landsat images acquired from 1988 to 2018 ... 21 Figure 7: Khartoum State LCLU Map ... 22 Figure 8: Urban Structure in Aljazeera Eslang, Karrari County (source: Google Earth®) ... 23 Figure 9: Khartoum County road network (Open Street Maps OSM) combined with LCLU map.... 23 Figure 10: Sharg Alneel and Jebel Awlyia counties road network (Open Street Maps OSM)
combined with LCLU map ... 24 Figure 11: UNOSAT Flood Extent for 2013 flood event using images from Formosat 2, Radarsat 2,
and MODIS Terra ... 26 Figure 12: UNOSAT Flood Extent for 2013 flood event with overlaying barren area ... 27 Figure 13: UNOSAT Flood Extent for 2013 flood and MODIS Terra with the maximum flood extent
for august 2013 by Landsat 7, Landsat 8. ... 27 Figure 14: UNOSAT Flood Extent map on 11 August 2016 using TerraSAR-X satellite image ... 28 Figure 15: UNOSAT Flood Extent map on 15 August 2016 using SPOT-7 satellite image ... 29
1
1. INTRODUCTION
Floods come as the most frequent natural disaster in the current century. In 2018, more than 38% of the global natural disasters were accredited to floods, causing 24% of total deaths, affecting 34.2 million people, and costing 19.7 billion US$ in economic losses (CRED & UNISDR, 2018). The United Nations Office for Disaster Risk Reduction (UNDRR), defines risk as the function of hazard, exposure and vulnerability (UNDRR, 2019). By following this equation, proper flood risk assessment requires identifying flood hazard, exposed elements, and their degree of vulnerability (Kron, 2005). Sudan have followed a recurring pattern of flooding since the early nineteenths and twentieth centuries (Davies & Walsh, 1997). Khartoum state is the most populated state in Sudan, the home of the capital city of Sudan, Khartoum city. Recent extreme flood events such as in 2013, has left 78 casualties, and 499,980 people were affected, most of them in Khartoum state (UNOCHA, 2013). The availability of data for areas with flood hazard will help policy makers, NGOs and grass-root initiatives to take effective and efficient measures in risk assessment and risk reduction.
1.1. Motivation
The motivation behind this research, to find alternative sources for flood hazard mapping, and to be able to assess flood risk independently from ground data, which might not be available in near real time, and in which case satellite images can be of great help. The scope time of this research is 30 years, from 1988 to 2018, in the state of Khartoum, Sudan. The use of time series satellite images provides an insight to flood pattern in an area with very limited ground data to produce maps to visualize the flood extent, which is essential to rapid response to disasters.
1.2. Aim and Objectives
This research aims to assess flood hazard and risk in the state of Khartoum, Sudan, by analysing satellite images for a period of thirty years, to identify flood prone areas. This aim will be achieved through the following objectives:
2 • Classify images to create flood extent maps.
• Create maximum flood extent maps per flood event from flood extent maps. • Calculate the relative frequency of inundation (RFI) indicator from
maximum flood extent maps and create flood hazard map.
• Assess flood risk using flood hazard map over (urban areas, croplands, educational facilities, and health facilities).
In order to achieve the above-mentioned objectives, Landsat satellite images will be classified to produce flood extent maps, these images will then be integrated per flood event to create maximum flood extent maps. Relative Frequency of Inundation (RFI) will be calculated from the maximum flood extent maps, then flood hazard map will be created from this indicator. The flood hazard map will be further analysed over urban areas, cropland areas, educational facilities, and health facilities.
1.3. Thesis Outline
The thesis is structured as follows. This chapter addresses thesis introduction, its relevance, motivation, aim and objectives. The second chapter is dedicated to the reviewed literature on flood risk assessment using remotely sensed data and flood risk assessment in Africa in general and Sudan in particular. The methods used for mapping flood hazard and flood risk assessment are discussed in Chapter 3. Results and discussions are presented in Chapter 4. And finally reached conclusions are given along with, limitations, and recommendations in Chapter 5. The thesis then finishes with bibliographic references and Annexes.
3
2. Literature Review
The recurrence of floods in a certain location usually indicates a flood hazard, and that is usually recognized by flood modelling. Different flood modelling methods which discussed with elaboration by (Teng et al., 2017) require intensive data about the flood area that are associated with ground observation, such as cross sections, water levels and discharge, rainfall data, and elevation and terrain data. The output is a flood map for a certain scenario depending on the model inputs. These models are used along with exposed elements, and their vulnerability to calculate possible loss of life and economic losses (Jonkman et al., 2008).
Multi-Criteria Analysis methods (MCA) are used widely in research, for decision making process in flood hazard mapping and risk assessment. Where some research rely on the use of hydraulic modelling, to produce flood hazard maps and risk assessment maps (Apel et al., 2009)(Masood & Takeuchi, 2012)(Alaghmand et al., 2010), and some use MCA to validate produced maps (Franci et al., 2016; Papaioannou et al., 2015).
2.1. Flood risk assessment using remotely sensed data
The use of satellite images in mapping rivers and their extent, as well as its use in flood monitoring and integration with hydrodynamic models for flood mapping have been reviewed extensively by (Marcus & Fonstad, 2008), and (Schumann et al., 2009). Marcus & Fonstad review the use of optical remote sensing, using air-borne and satellites to map rivers at sub-meter resolutions, they discuss the applications of river mapping, remote sensing methods, and obstacles rising from high resolution mapping, whereas Schumman et. al review recent literature on the progress in different techniques for flood mapping using remotely sensed data, techniques such as flood extent extraction and water stage modelling, where SAR images are used for their abilities to detect floods regardless of cloud cover and day time, along with the use of high-resolution topographic data. They then review research that strongly suggest that integrating remotely sensed data with hydraulic models improve flood modelling significantly, by using remote sensing data for model evaluation and calibration.
4 More studies on different range of remotely sensed data have emerged, such as the use of Very High Resolution (VHR) images; (Franci et al., 2016) used GeoEye-1 satellite imagery, along with and MCA process called Analytical Hierarchy Process (AHP) to produce a flood hazard map, in which elements like slope, distance to channels, drainage texture, geology, and land cover were weighed and used as the criteria for a proposed hazard index.
(Cai et al., 2017; Kumar & Acharya, 2016; Skakun et al., 2014) (Cai et al., 2017; Kumar & Acharya, 2016; Skakun et al., 2014) used multitemporal satellite images of medium resolution. (Kumar & Acharya, 2016) used Landsat images and Digital Elevation Model (DEM) for the 2014 flood events in Kashmir Valley to derive a flood hazard and risk assessment maps, where Normalized Difference Vegetation Index (NDVI) was used to represent vulnerability in land use to further identify hazard and assess the risk on standing crops.
In their work for flood hazard mapping in Namibia, (Skakun et al., 2014) studied flood hazard for the Katima Mulilo region between 1989 and 2012, they used Landsat satellite images for the extraction of flood extent maps and created a flood hazard map. They further produced a flood risk assessment map, calibrating the hazard map and a risk assessment report as well as road network and dwelling units.
The flood risk assessment carried by (Cai et al., 2017) in the Barotse floodplain, Zambia, used the same framework laid out by (Skakun et al., 2014) for mapping maximum flood for 25 years of Landsat images. They created four distinct classes in oppose to a binary map. For validation and risk assessment, survey data from residents to assess personal livelihood and household damage, in addition to rainfall and river gauge data were used.
Other research looked into the use of remotely sensed data such as precipitation and flood extent maps along with topographic data as the input for hydrologic flood models, for model calibration and evaluation (Khan et al., 2011).
The use of Synthetic Aperture Radar (SAR) images for flood monitoring has grown in popularity due to the capabilities of SAR images for flood delineation
5 independently of cloud cover (Marcus & Fonstad, 2008; Pulvirenti et al., 2011; Scarpino et al., 2018; Schumann et al., 2009), and the availability of SAR images thanks to Sentinel mission (Poursanidis & Chrysoulakis, 2017).
2.2. Flood Risk Assessment in Sudan
Within the African continent, Sudan is considered to be a flood-prone country (Li et al., 2016). As a country associated with floods, it also exhibits a pattern of extreme flash floods, following a recurring pattern since the early nineteenths and twentieth centuries (Davies & Walsh, 1997). In their study, (Sutcliffe et al., 1989; Walsh et al., 1994) had also indicated that extreme flood damage was not only caused by the Nile flood in Greater Khartoum area (the main three cities in Khartoum State; Khartoum, Khartoum North – also referred to as Bahri, and Omdurman), but also due to the heavy rain storms that lasted for 4-5 consecutive days causing a runoff, and the ephemeral watercourses throughout the area. One of the earliest analysis of the floods impact over Sudan was carried out by (Sutcliffe et al., 1989) for the 1988 flood event, where Meteosat Cold Cloud Duration (CCD) measurements were used along with aerial photography. Recent studies conducted on flood hazard mapping in Sudan included geo-statistical data analysis using Inverse Distance Weighting (IDW) method for rainfall in situ-stations, as well as quantitative interviews to calculate a social vulnerability index for Khartoum State for 2013 – 2014 floods (Mahmood et al., 2017), also the opinions of experts on the same flood events through a qualitative approach (Horn & Elagib, 2018) which suggested a flood management framework, that included flood risk mapping as a part of data resource enhancement. The shortage in flood hazard mapping and flood risk assessment in Sudan, is the motive behind this research.
Even though rapid flood mapping has been carried over the last decade by the United Nation Institute for Training and Research (UNITAR) program, UNITAR’s Operational Satellite Applications Program (UNOSAT) in a semi real-time analysis (Sudan maps | UNITAR, n.d.), Khartoum state stills suffers from the consequences of flash floods.
6
3. Methods
Figure 1 illustrates the methodology that was followed during this study. In the flow chart flood events are mapped using Landsat 5, Landsat 7, and Landsat 8 images. Within the flood event, per each Landsat image, a flood extent map was produced using image classification, and finally all flood extent maps are used to calculate the maximum flood extent map per flood event. In this study the timeline for mapping floods starts from 1988 until 2018, spanning 30 years. The maximum flood extent maps are then used to produce the flood hazard map using Relative Frequency of Inundation RFI Index. For flood risk assessment a Land Cover Land Use (LCLU) map is produced, the flood hazard map is analyzed using the LCLU map as well as health facilities and educational facilities data from Open Street Maps (OSM). The following sections details all the steps of the methodology.
7 Figure 1: Methodology Flow Chart
8
3.1. Study Area
Sudan is a country located in the northeastern part of the African continent. The country is bordered by Egypt, Libya, Central African Republic, Chad, South Sudan, Ethiopia, Eritrea, and the Red Sea.
Khartoum state is the most populated state of the 18 states of Sudan, although the smallest in term of area. Its capital is Khartoum city, which is also the national capital of Sudan. Khartoum is situated between 31˚E and 35˚E longitude and 15˚N and 17˚N latitude. Khartoum state counts for 17% of the total population of Sudan, Figure 2 shows the boundary of the state in addition to the state counties. The state consists of 7 counties: • Khartoum • Jebel Awliya • Umdurman • Oumbada • Karrari • Bahri • Sharg Alneel
9 The Nile river, the world’s longest river is formed in the city of Khartoum, by the joining of the Blue Nile that originate from Tana Lake in Ethiopia, and the White Nile that originate from Victoria lake in Uganda. The state has an arid climate, with a rainy season from July to September. Khartoum has a history of recurrent flooding, pluvial and fluvial (Davies & Walsh, 1997), and extremely vulnerable due to its high population.
3.2. Data
3.2.1. Remotely Sensed Data
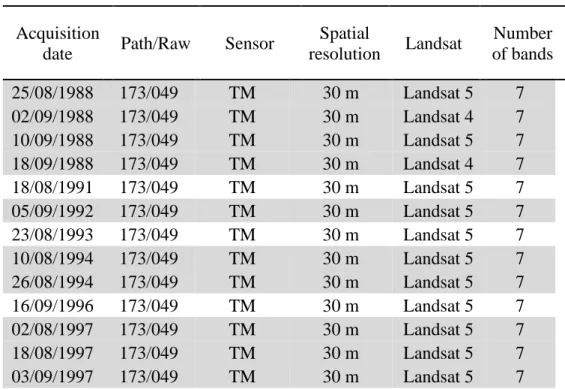
For this research 70 remotely sensed images acquired Landsat different missions were freely obtained for the period 1988 – 2018 and downloaded from the United States Geological Survey (USGS) EarthExplorer website https://www.earthexplorer.usgs.gov, details about spectral band specifications for each Landsat sensor used are available in Annex 1. The images were selected based on the Dartmouth Flood Observatory’s Active Archive of Large Floods (Brakenridge, n.d.). A total of 21 flood events were recorded. When acquiring the, images for the flood event on October 1997 were not available on the EarthExplorer archive. Table 1 shows more details about acquired images.
Table 1: Remotely Sensed Images specifications
Acquisition
date Path/Raw Sensor
Spatial resolution Landsat Number of bands 25/08/1988 173/049 TM 30 m Landsat 5 7 02/09/1988 173/049 TM 30 m Landsat 4 7 10/09/1988 173/049 TM 30 m Landsat 5 7 18/09/1988 173/049 TM 30 m Landsat 4 7 18/08/1991 173/049 TM 30 m Landsat 5 7 05/09/1992 173/049 TM 30 m Landsat 5 7 23/08/1993 173/049 TM 30 m Landsat 5 7 10/08/1994 173/049 TM 30 m Landsat 5 7 26/08/1994 173/049 TM 30 m Landsat 5 7 16/09/1996 173/049 TM 30 m Landsat 5 7 02/08/1997 173/049 TM 30 m Landsat 5 7 18/08/1997 173/049 TM 30 m Landsat 5 7 03/09/1997 173/049 TM 30 m Landsat 5 7
10 19/09/1997 173/049 TM 30 m Landsat 5 7 05/10/1997 173/049 TM 30 m Landsat 5 7 21/10/1997 173/049 TM 30 m Landsat 5 7 06/09/1998 173/049 TM 30 m Landsat 5 7 22/09/1998 173/049 TM 30 m Landsat 5 7 08/08/1999 173/049 TM 30 m Landsat 5 7 24/08/1999 173/049 TM 30 m Landsat 5 7 09/09/1999 173/049 TM 30 m Landsat 5 7 13/08/2001 173/049 TM 30 m Landsat 5 7 29/08/2001 173/049 TM 30 m Landsat 5 7 14/09/2001 173/049 TM 30 m Landsat 5 7 11/08/2003 173/049 ETM+ 30 m Landsat 7 8 17/09/2005 173/049 ETM+ 30 m Landsat 7 8 19/08/2006 173/049 ETM+ 30 m Landsat 7 8 04/09/2006 173/049 ETM+ 30 m Landsat 7 8 20/09/2006 173/049 ETM+ 30 m Landsat 7 8 06/10/2006 173/049 ETM+ 30 m Landsat 7 8 07/09/2007 173/049 ETM+ 30 m Landsat 7 8 23/09/2007 173/049 ETM+ 30 m Landsat 7 8 09/10/2007 173/049 ETM+ 30 m Landsat 7 8 27/08/2009 173/049 ETM+ 30 m Landsat 7 8 12/09/2009 173/049 ETM+ 30 m Landsat 7 8 06/08/2013 173/049 ETM+ 30 m Landsat 7 8 07/09/2013 173/049 ETM+ 30 m Landsat 7 8 05/07/2016 173/049 OLI_TIRS 30 m Landsat 8 11 13/07/2016 173/049 ETM+ 30 m Landsat 7 8 21/07/2016 173/049 OLI_TIRS 30 m Landsat 8 11 29/07/2016 173/049 ETM+ 30 m Landsat 7 8 06/08/2016 173/049 OLI_TIRS 30 m Landsat 8 11 14/08/2016 173/049 ETM+ 30 m Landsat 7 8 22/08/2016 173/049 OLI_TIRS 30 m Landsat 8 11 30/08/2016 173/049 ETM+ 30 m Landsat 7 8 07/09/2016 173/049 OLI_TIRS 30 m Landsat 8 11 15/09/2016 173/049 ETM+ 30 m Landsat 7 8 23/09/2016 173/049 OLI_TIRS 30 m Landsat 8 11 25/08/2017 173/049 OLI_TIRS 30 m Landsat 8 11 02/09/2017 173/049 ETM+ 30 m Landsat 7 8 10/09/2017 173/049 OLI_TIRS 30 m Landsat 8 11 18/09/2017 173/049 ETM+ 30 m Landsat 7 8 26/09/2017 173/049 OLI_TIRS 30 m Landsat 8 11 17/06/2018 173/049 ETM+ 30 m Landsat 7 8 25/06/2018 173/049 OLI_TIRS 30 m Landsat 8 11
11 03/07/2018 173/049 ETM+ 30 m Landsat 7 8 11/07/2018 173/049 OLI_TIRS 30 m Landsat 8 11 19/07/2018 173/049 ETM+ 30 m Landsat 7 8 27/07/2018 173/049 OLI_TIRS 30 m Landsat 8 11 04/08/2018 173/049 ETM+ 30 m Landsat 7 8 20/08/2018 173/049 ETM+ 30 m Landsat 7 8 12/08/2018 173/049 OLI_TIRS 30 m Landsat 8 11 28/08/2018 173/049 OLI_TIRS 30 m Landsat 8 11 05/09/2018 173/049 ETM+ 30 m Landsat 7 8 13/09/2018 173/049 OLI_TIRS 30 m Landsat 8 11 21/09/2018 173/049 ETM+ 30 m Landsat 7 8 29/09/2018 173/049 OLI_TIRS 30 m Landsat 8 11 08/11/2018 173/049 ETM+ 30 m Landsat 7 8 16/11/2018 173/049 OLI_TIRS 30 m Landsat 8 11 24/11/2018 173/049 ETM+ 30 m Landsat 7 8 3.2.1. Auxiliary Data
Health facilities and educational facilities across the country were available by OSM through United Nations Office for the Coordination of Humanitarian Affairs
(UNOCHA)’s humanitarian response online portal
https://www.humanitarianresponse.info.
OSM provides freely available crowdsourced spatial data, these data though may not be comprehensive, yet are regularly updated.
3.3. Mapping Flood Extent
In order to produce flood extent maps Landsat images were classified to the three categories suggested by (Skakun et al., 2014); water for the three Nile rivers and flooded areas, no water for all dry lands, and no data for areas covered with clouds, cloud shadows or missing data. The values corresponding to each class is illustrated in Table 2, this information is imperative to understanding further work. Since images were not cloud free, training samples had to be collected per image for the three classes.
Afterwards, the Train Support Vector Machine Classifier tool was trained using Landsat image and training samples shapefile. The output is a Classifier Definition file. After that the classifier definition file is used as an input in addition
12 to the Landsat image for the Classify Raster tool, which output is a classified image, that is the flood extent map. The tools are within the Segmentation and Classification toolbox in the Spatial Analyst Tools in ArcMap 10.6.
Table 2: Classes and the corresponding values Class Name Value
Water 0
No Water 1
No Data 2
3.4. Mapping Maximum Flood Extent
After obtaining a map of flood extent for all the acquired images, a maximum flood extent map is produced for every flood event, in which flood extent maps within the flood event are used. Every pixel on the map is assigned one of the three classes mentioned above. A pixel is assigned water if at least the same pixel was assigned water in one of the flood extent maps, it is assigned no water if the same pixel was assigned as no water in all the flood extent maps, and finally it is assigned no data if it was in all the flood extent maps were assigned no water or no data.
In order to calculate the maximum flood extent for each flood event, Raster Calculator tool in the Map Algebra toolbox was used. A simple multiplication of all flood extent maps was performed to obtain an intermediate map with water class, no water class and other classes of values multiples of the number 2. The maximum flood extent map is finally produced after assigning all other classes to the no data class value 2, by using Reclassify tool in the Reclass toolbox. Both the Map Algebra toolbox and Reclass toolbox are in the Spatial Analyst Tools in ArcMap 10.6.
13
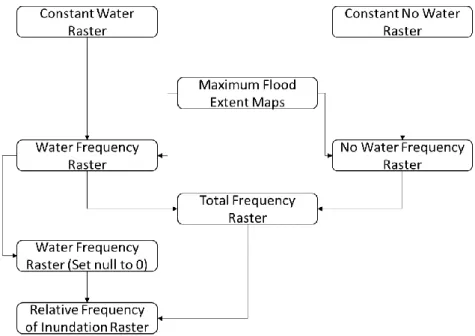
3.5. Relative Frequency of Inundation
In statistics, the frequency of an event is the number of times this event has occurred in a dataset, and relative frequency is the ratio of the frequency of an event occurring in a dataset to the number of all events occurring in the same dataset. From this we can induce that the frequency of inundation is to be calculated per pixel from the maximum flood extent maps produced for all flood events. The frequency of inundation equals the number of times a pixel was classified as water.
In order to calculate the relative frequency of inundation, the frequency of inundation per pixel is the number of times it was classified as water divided by the total number of times the pixel was classified as water and no water. To calculate RFI value first a constant raster named Water constant raster with 0 value was created, another constant raster was created, named No Water constant raster and its value was 1, these two raster files were created using Create Constant Raster tool in the Raster Creation Toolbox. After that the tool Equal To Frequency in the Local toolbox was used to calculate the Water Frequency Raster and No Water Frequency Raster, in each turn one of the constant raster files was used in addition to all maximum flood extent maps. A total frequency raster was created using the Raster Calculator tool by adding the water and no water frequency raster files to each other. In order to calculate the RFI value any pixel in the water frequency file equal to 0 was set to null using the Set Null tool in the Conditional Toolbox. Lastly, in order to obtain the RFI map the Raster Calculator tool was used one more time to divide the water frequency raster by the total frequency raster, all the tools used reside in the Spatial Analyst Tools in ArcMap 10.6. The process is illustrated in Figure 3.
14 Figure 3: RFI Mapping Process
3.6. Flood Risk Assessment
3.6.1. LCLU MapSince there were no LULC maps of the study region readily available, we produced one as described below. The LULC map of Africa disclosed
by FAO
(http://www.fao.org/geonetwork/srv/en/main.search?title=land%20cover;
retrieved 10 January 2020) is very coarse. (Salman et al., 2008) published a LULC map of greater Khartoum-Sudan, but its digital version is not available, and the authors did not answer to the request to share it in due time.
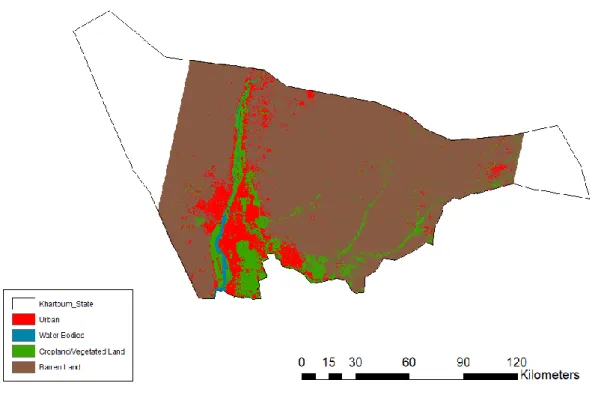
The Khartoum state LCLU map was produced to identify flood prone areas, to be used later along with the flood hazard map produced from the RFI index. The LCLU classes were inspired from (Broxton et al., 2014)’s LCLU Map of Africa. The three main classes were Water Bodies, Urban, Cropland and Vegetation, in addition to these classes, the remaining un-urbanized areas that are far from the rivers’ banks were classified as Barren Land.
In this step a Landsat 8 image from 28/12/2016 was acquired and clipped into the study area extent. In order to obtain high accuracy for classification the
15 Normalized Difference Built-up Index (NDBI) was calculated and combined with the original image. NDBI is used to detect urbanization of land cover (Zha et al., 2003). NDBI is calculated by subtracting the Near Infrared (NIR) band from the Short-Wave Infrared (SWIR) band divided by the sum of the two bands, illustrated in the formula below:
NDBI = (SWIR – NIR) / (SWIR + NIR)
After that, training samples were collected and then the Support Vector Machine classifier was trained using these samples along with the clipped image. Finally, the image was classified and the LCLU map produced.
3.6.1.1. LCLU Inundation
To properly analyze the flood extent in relation to the pre-flood status, a change matrix is produced for all maximum flood extent maps, where LCLU map is used as the pre-flood reference for the study area. This is done using the Combine tool in Spatial Analyst Toolbox in ArcMap 10.6 to create a change map, from which flood percentage per class is calculated.
The output of the tool is a new raster containing all the combination possibilities that occurred from combining a maximum flood extent map with the LCLU map. The number of pixels changed to maximum flood extent map from LCLU class is laid out in the raster’s attributes table, which serves the base for the change matrix. The change is calculated from dividing the changed pixels per maximum flood extent class by the total number of pixels per LCLU class.
3.6.2. Zonal Statistics
The LCLU and RFI maps were clipped into the seven counties of the state. Zonal statistics analysis was performed per county for all four classes. The use of zonal statistics for each class in each county provides a better understanding since counties like Bahri and Sharg Alneel are mostly barren, for which a specific measurement of RFI values for urban and cropland and vegetation classes are needed for accurate assessment.
16 In addition to analyzing inundation for urban and cropland and vegetations areas, health facilities (hospitals, clinics, health centers, and pharmacies) and educational facilities (nurseries, kindergartens, elementary schools, high schools, colleges, and universities) were analyzed. OSM point shape files for health facilities and educational facilities were the source data in this analysis. OSM files were clipped for the study area’s boundary then used as an input for zonal statistics along with RFI map. For each point the average RFI value was used.
17
4. Results and Discussion
In this chapter, results obtained from following the methods described in chapter 3 are illustrated in the sections below. A discussion of the humanitarian response mapping is demonstrated in the final section of this chapter.
4.1. Flood Extent Maps
Out of the 70 acquired images, 67 images were processed, the remaining 3 images were excluded because they were covered with more than 75% cloud. 70% of the classified images’ cloud cover was less than 15% and the maximum cloud cover recorded was 71%, which was found acceptable to work with.
4.1.1. Scan-Line Corrector (SLC) problem
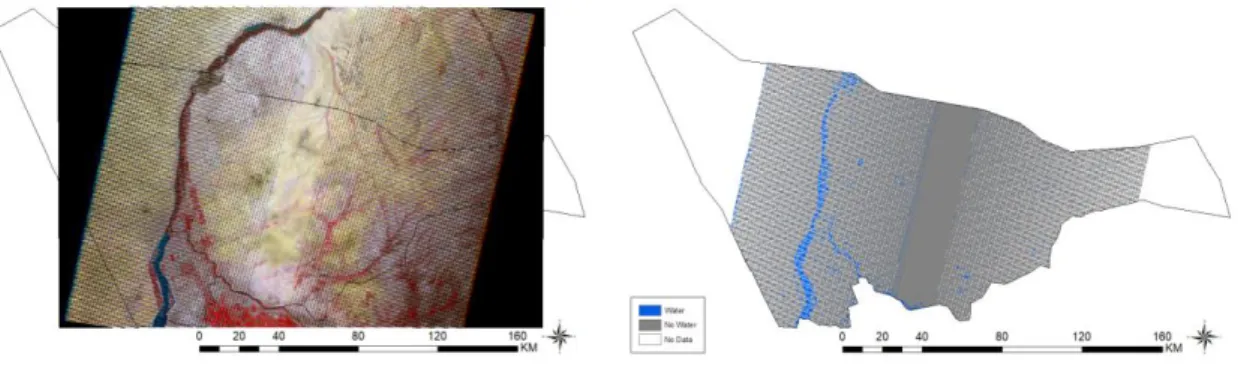
All images acquired from Landsat 7 ETM+ after May 31, 2003 suffered from data gap due to the permanent fail of the Scan-Line Corrector (SLC). Due to this problem some of the flood extent maps suffered from a false water classification, this issue can be noticed in Figure 4, in an image acquired on October 06, 2006 and corresponding flood extent map. The scan lines pixels exhibit similar characteristics to water class features, hence when collected as No data in training samples, these pixels affected the final classified map, and water was misclassified as No data. We solved this problem by not including such pixels in the training samples as not to confuse the classifier, and as a result some classified images ended up with false positive values for water class. Several authors (Chen et al., 2011; Maxwell et al., 2007; Pringle et al., 2009; Zhang et al., 2007) have investigated methods for filling the SLC gap, in spite of their ability to restore the missing scan lines, these methods are predictive methods based on the surrounding pixels, and in this case, it was concluded that such approaches can’t be used for flood delineation purposes.
18 Figure 4: An example of an image acquired from Landsat 7 on October 06, 2006 (left), and the SLC misclassification problem in classified flood extent map (right)
4.2. Maximum Flood Extent Maps
21 maximum flood extent maps were created from the flood extent maps, beginning with the 1988 flood event, this flood event stands as a reference for one of the major floods in Khartoum state (Davies & Walsh, 1997; Mahmood et al., 2017). Figure 5 illustrate the maximum flood extent map for the year 1988. It can be viewed that most of the flooded land is in Jebel Awliya county, followed by Umdurman, Bahri, Sharg Alneel counties, and finally Khartoum county. The least flooded counties were Karrari and Oumbada. The remaining maps are shown from Annex 2 to Annex 21.
19 Figure 5: Maximum Flood Extent Map for 1988
Table 3 illustrates the flood extent for 1988 flood event. Croplands and vegetated areas were the most inundated area, after which comes urban area with 6.68% inundation value. We must put in mind that this value is in relation to LCLU map of 2016, and that urban growth from 1988 to 2016 was not put into calculation, hence the inundation ratio is underestimated.
Table 3: Change matrix for 1988 flood event
1988
Water No Water No Data
L C L U Urban 6.68% 56.27% 37.05% Water Bodies 98.35% 1.07% 0.6% Cropland/Vegetation 21.38% 41.33% 37.29% Barren 0.25% 80.13% 19.62%
The change matrix was also calculated to all remaining maximum flood extent maps and can be seen under each map in the appendices. The highest inundation for urban area was recorded in June 2018 flood event with 28.36%, exceeded by
20 Cropland and vegetation, also for the same year with 48.55%. The mean inundation percentage value for urban area is 7.85% and for cropland and vegetation area is 20.12%. It is fair to say that Cropland and vegetation areas suffer the most from inundation and the reason behind it is that most croplands are on the banks of the three Nile rivers. Because the pre-flood reference map is from 2016 it is fair to say that inundation ratio for the 90’s is underestimated due to the urban growth the state has witnessed (Schumacher et al., 2009).
Maximum flood extent maps for the years 2016, 2017 and all three flood events of 2018 - from Annex 17 through Annex 21 - exhibit an increase in the water pixels due to the SLC-off anomaly. To overcome this misclassification problem two approaches were attempted. The first approach was to increase the training samples of the misclassified pixels as No Data, this approach led to misclassifying water bodies as No Data. The second approach was to calculate the Normalized Difference Water Index (NDWI), which was developed by (Gao, 1996) to delineate open water. The index was to be combined with the actual image bands to enhance classification results. NDWI can be obtained using the formula below:
NDWI = (NIR – SWIR) / (NIR + SWIR)
Annex 23 shows the calculated NDWI for Landsat 7 image on 15/09/2016. In this image the misclassified pixels exhibit the same NDWI values as the water bodies, so it was clear that this approach will lead to the same classification results.
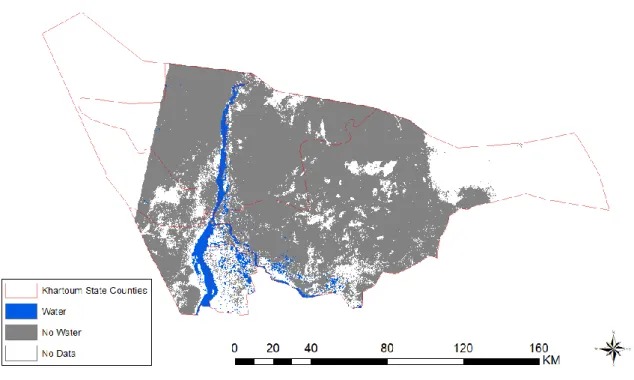
4.3. Relative Frequency of Inundation Map
The RFI is used here to indicate flood hazard based on past flood events, this indicator is not a prediction for future flood events but can be used for planning and risk assessment purposes. The indicator is used in Figure 6 below for the Khartoum State Flood Hazard Map. Areas close to the rivers’ banks have the highest values of RFI, in addition to natural catchment areas in Sharg Alneel county.
21 Figure 6: Khartoum State Flood Hazard Map using the relative frequency of inundation (RFI) derived from Landsat images acquired from 1988 to 2018
This map, along with the LCLU map for the state, and point features of health facilities and educational facilities, are used to assess the degree of hazard in areas of Khartoum state in sections below. The significance of this map relies on its use as a base for further intensive flood risk assessment for the state.
4.4. Flood Risk Assessment
4.4.1. LCLU MapIn this step the LCLU map and the flood hazard map are used to assess the risk of floods on Khartoum State. The LCLU map is shown in Figure 7. To assess the accuracy of the map, Google Earth® was used as the ground truth. The overall accuracy of the map is 84.2%.
22 Figure 7: Khartoum State LCLU Map
Detailed accuracy assessment results are shown in Annex 22. The nature of the state’s arid climate and urban structure that can be seen in Figure 8, as well as the moderate resolution (30 m) of Landsat images, led to confusion between Urban, Cropland/Vegetation, and Barren Land classes. But when compared to Open Street Maps OSM data as shown in Figure 9 and Figure 10, the boundaries of urban areas of state counties in relation to the road network data were satisfactory.
23 Figure 8: Urban Structure in Aljazeera Eslang, Karrari County (source: Google Earth®)
24 Figure 10: Sharg Alneel and Jebel Awlyia counties road network (Open Street Maps OSM) combined with LCLU map
4.4.2. Zonal Statistics
The results of the zonal statistics for each county is shown in Annex 24, in which the LCLU map was used for zoning. With regards to RFI values for Urban areas, Umdurman averaged 0.23 ± 0.24 as the highest average between all seven counties, Khartoum and Jebel averaged 0.21 ± 0.16 and 0.21 ± 0.15 respectively. Ombadah had the lowest average of 0.12 ± 0.06. In areas of cropland and vegetations, Umdurman averaged the highest between counties with 0.66 ± 0.32, coming after that, Karrari and Khartoum with 0.64 ± 0.27 and 0.52 ± 0.35 respectively. The lowest RFI average for croplands and vegetations area was also in Sharg Alneel with 0.23 ± 0.17. Ombadah county ranked a lower RFI for croplands and vegetations area but was not considered because croplands and vegetation represent only 1% of county area.
Since the results of zonal statistics for health and educational facilities were per point, the average RFI value for each facility was the used to derive descriptive statistics. Out of 715 health facilities in the state of Khartoum, a total of 511 health
25 facilities had RFI value associated with them, averaging 0.19 ± 0.09. As for the educational facilities, out of 216 facilities, a total of 165 facilities with RFI average value 0.18 ± 0.09 were analyzed. Detailed results are shown in Annex 25.
4.5. Humanitarian Mapping Response for August 2013 and July
2016 Flood Events
In August 2013, heavy rains took on several states of Sudan leading to flash floods, along with Nile river flooding. The crisis led to the death of 45 people and over 70 injured. The severe damages in infrastructure has affected around 150,000 people across the country. Khartoum state, being the most populated state in Sudan, was the most affected, with more than 84,000 people affected by the floods, according to reports by the World Health Organization (WHO) (https://www.who.int/hac/crises/sdn/sudanfloods2013sitrep2.pdf ; retrieved 24
January 2020) and UNOCHA
(https://disasterscharter.org/documents/10180/13939/OCHASudanFlashUpdateFloo ds4.pdf/afd50da8-cdac-4d22-a906-073e87e47876?version=1.0; retrieved 24 January 2020).
In response to a request by UNITAR/UNOSAT on behalf of UNDP office in Sudan, the International Charter Space and Major Disasters was activated to provide satellite imagery, in order to assess in relief work. The charter is a collaboration between 17 space agencies and space research institutes. In addition to the charter members, 19 other entities contribute to the charter in terms of disaster monitoring, satellite image provision, and image analysis and maps production.
Along with the charter, the Dartmouth Flood Observatory also contributed in delineating the flood event through the analysis of MODIS Terra satellite images.
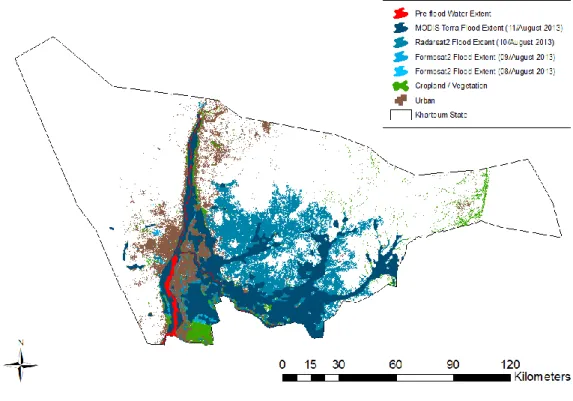
Figure 11 illustrates work done by UNOSAT through the charter and the observatory. It can be clear that when compared to the maximum flood extent map produced using Landsat 7/Landsat 8 for the same flood event in Annex 16, the flood extent in urban and croplands and vegetations areas is exceedingly larger than what was captured through the Landsat images. This is due to the nature of the
26 different satellites used in the two maps, since Formosat 2 and Radarsat 2 both produce SAR images that are cloud free. In addition, the images were within days of the flood event. Landsat images used in this study were over 30 days apart, hence they were not able to properly detect the maximum flood extent of this event.
Figure 11: UNOSAT Flood Extent for 2013 flood event using images from Formosat 2, Radarsat 2, and MODIS Terra
As can be seen in the figure above, although Sharg Alneel and Bahri counties are most inundated counties, yet most of these areas are barren. When overlaying barren area on top of the flood extent, the affect with regards urban and cropland and vegetation areas, which is illustrated in Figure 12 below. . The maximum flood extent map obtained by Landsat images are overlaid the charter and Dartmouth Flood observatory flood extent in Figure 13 below.
27 Figure 12: UNOSAT Flood Extent for 2013 flood event with overlaying barren area
Figure 13: UNOSAT Flood Extent for 2013 flood and MODIS Terra with the maximum flood extent for august 2013 by Landsat 7, Landsat 8.
28 In 2016 an early rain season started in June with heavy rains affecting 80,000 people nationwide, causing floods in 13 out of 18 states. During these floods Khartoum state was not the most affected area, hence there was no extensive mapping for floods for the state. The charter was not activated for the state until the 9th of August. Images were analyzed by UNOSAT focused on the flood extent on the banks of the White Nile and Blue Nile rivers. Satellite images used for mapping were TerraSAR-X of 3 m resolution, and SPOT-7 of 1.5 m resolution. Both maps are illustrated in Figure 14 and Figure 15 below. The maximum flood extent map for 2016 is based on 11 images collected between July 5th and September 23rd. Hence, it captures almost the whole event, although its spatial resolution is coarser. Because of the extent of the images, a state wise comparison with the maximum flood extent map for 2016 (Annex 17) is not possible.
29 Figure 15: UNOSAT Flood Extent map on 15 August 2016 using SPOT-7 satellite image
UNITAR has an online portal for their flood analysis products under the following URL http://floods.unosat.org/geoportal/. The portal is a valuable source of geospatial information, with one downside of the exclusion of original images, due to copyrights, which does not allow for analysis growth for research purposes.
30
5. Conclusion
This study aimed at mapping flood hazard and assessing flood risk using multi-temporal satellite imagery. Using images from Landsat 4,5,7 and 8, and through specific objectives this study was able to identify areas - on county level - that are exposed to floods in Khartoum state, Sudan. Areas were analyzed based on their use, and were and classified to urban, cropland and vegetation, barren, and water bodies using a LCLU map that was produced as a part of the study.
Flood hazard was identified using the relative frequency of inundation RFI. By mapping the RFI indicator, this study went a step forward in flood risk assessment for the state of Khartoum, Sudan. A step that was suggested by (Horn & Elagib, 2018) in their flood management framework for the capital city Khartoum. This map can also be used as the hazard factor when calculating flood risk.
Using zonal statistics, it was found that the greatest hazard was associated with croplands, due to their proximity to riverbanks, ranking Umdurman and Karrari with the highest RFI values. As for urban areas, Jebel Awlyia and Khartoum counties, the most urbanized counties had the highest RFI values. When hazard degree was investigated for public facilities such as health and educational facilities, these facilities were found to be within the urban areas hazard level. Health and educational facilities flood hazard averaged 0.19 and 0.18 consecutively, which was calculated for 511 health facilities and 216 educational facilities with no RFI zero value.
The absence of a Land Cover Land Use LCLU map with a moderate resolution for Khartoum state has led to additional contribution of this study. A LCLU map was produced with an overall accuracy of 84%, where the state was classified to as urban, croplands and vegetation, barren, and water bodies. This map was an essential component in detecting urban and cropland areas with high exposure to floods.
The availability of satellite images with moderate spatial resolution to delineate maximum flood extent was an essential component of the study. The quality of acquired images, be it the time of acquisition with regards to the flood event or the
31 cloud cover percentage, both elements contributed significantly to the quality of end results.
When compared, 2013 flood maximum flood extent map and flood delineation made by UNOSAT and Dartmouth Flood Observatory, it was seen that the extent of flooding was exceedingly larger than the one analyzed by this study. This was due to several reasons; the satellite images used in delineation by UNOSAT were not affected by cloud cover, temporal resolution of the images was within days of the flood event, as well as for the observatory images.
5.1. Limitations
Due to the nature of floods, and the fact that Landsat images are obtained every 16 days, it was not always possible to accurately delineate maximum flood extent. Moreover, sometimes there would only be one image available per flood event, and in other cases cloud cover would be over 75%. Hence there is a need for freely accessible archive SAR images with high temporal resolution to obtain properly delineate flood events. The lack of available ground data associated with natural events like floods resulted in the lack of accuracy assessment for flood extent mapping, except for visual interpretation.
5.2. Recommendations
Future work built on the findings of this study can include flood risk assessment for future flood events, with the help of the RFI flood hazard map. Another step can be taken by integrating data from ground weather stations and river gauges, in order to validate satellite data, as well as filling the gap of missing data due to cloud cover and temporal resolution, and to interpolate the extent of flash floods.
Additional studies on infrastructural vulnerability will help in understanding the risks associated with floods for mitigation and increase the state resilience.
32
Bibliographic References
Alaghmand, S., Abdullah, R. bin, Abustan, I., & Vosoogh, B. (2010). GIS-based river flood hazard mapping in urban area (a case study in Kayu Ara river basin, Malaysia). International
Journal of Engineering and Technology, 2(6), 488–500.
Apel, H., Aronica, G. T., Kreibich, H., & Thieken, A. H. (2009). Flood risk analyses—How detailed do we need to be? Natural Hazards, 49(1), 79–98. https://doi.org/10.1007/s11069-008-9277-8
Brakenridge, G. R. (n.d.). Global Active Archive of Large Flood Events. Dartmouth Flood Observatory, University of Colorado. Retrieved 16 October 2019, from
http://floodobservatory.colorado.edu/Archives/index.html
Broxton, P. D., Zeng, X., Sulla-Menashe, D., & Troch, P. A. (2014). A Global Land Cover
Climatology Using MODIS Data. Journal of Applied Meteorology and Climatology, 53(6), 1593–1605. https://doi.org/10.1175/JAMC-D-13-0270.1
Cai, X., Haile, A. T., Magidi, J., Mapedza, E., & Nhamo, L. (2017). Living with floods – Household perception and satellite observations in the Barotse floodplain, Zambia. Physics and
Chemistry of the Earth, Parts A/B/C, 100, 278–286.
https://doi.org/10.1016/j.pce.2016.10.011
Chen, J., Zhu, X., Vogelmann, J. E., Gao, F., & Jin, S. (2011). A simple and effective method for filling gaps in Landsat ETM+ SLC-off images. Remote Sensing of Environment, 115(4), 1053–1064. https://doi.org/10.1016/j.rse.2010.12.010
CRED, & UNISDR. (2018). 2018 Review of Disaster Events | Centre for Research on the
Epidemiology of Disasters. https://www.cred.be/2018-review-disaster-events
Davies, H. R. J., & Walsh, R. P. D. (1997). Historical Changes in the Flood Hazard at Khartoum, Sudan: Lessons and Warnings for the Future. Singapore Journal of Tropical Geography,
18(2), 123–140. https://doi.org/10.1111/1467-9493.00012
Franci, F., Bitelli, G., Mandanici, E., Hadjimitsis, D., & Agapiou, A. (2016). Satellite remote sensing and GIS-based multi-criteria analysis for flood hazard mapping. Natural Hazards,
33
Gao, B. (1996). NDWI—A normalized difference water index for remote sensing of vegetation liquid water from space. Remote Sensing of Environment, 58(3), 257–266.
https://doi.org/10.1016/S0034-4257(96)00067-3
Horn, F., & Elagib, N. A. (2018). Building socio-hydrological resilient cities against flash floods: Key challenges and a practical plan for arid regions. Journal of Hydrology, 564, 125–132. https://doi.org/10.1016/j.jhydrol.2018.07.001
Jonkman, S. N., Vrijling, J. K., & Vrouwenvelder, A. C. W. M. (2008). Methods for the estimation of loss of life due to floods: A literature review and a proposal for a new method. Natural
Hazards, 46(3), 353–389. https://doi.org/10.1007/s11069-008-9227-5
Khan, S. I., Hong, Y., Wang, J., Yilmaz, K. K., Gourley, J. J., Adler, R. F., Brakenridge, G. R., Policelli, F., Habib, S., & Irwin, D. (2011). Satellite Remote Sensing and Hydrologic Modeling for Flood Inundation Mapping in Lake Victoria Basin: Implications for
Hydrologic Prediction in Ungauged Basins. IEEE Transactions on Geoscience and Remote
Sensing, 49(1), 85–95. https://doi.org/10.1109/TGRS.2010.2057513
Kron, W. (2005). Flood Risk = Hazard • Values • Vulnerability. Water International, 30(1), 58–68. https://doi.org/10.1080/02508060508691837
Kumar, R., & Acharya, P. (2016). Flood hazard and risk assessment of 2014 floods in Kashmir Valley: A space-based multisensor approach. Natural Hazards, 84(1), 437–464. https://doi.org/10.1007/s11069-016-2428-4
Li, C., Chai, Y., Yang, L., & Li, H. (2016). Spatio-temporal distribution of flood disasters and analysis of influencing factors in Africa. Natural Hazards, 82(1), 721–731.
https://doi.org/10.1007/s11069-016-2181-8
Mahmood, M. I., Elagib, N. A., Horn, F., & Saad, S. A. G. (2017). Lessons learned from Khartoum flash flood impacts: An integrated assessment. Science of The Total Environment, 601–602, 1031–1045. https://doi.org/10.1016/j.scitotenv.2017.05.260
Marcus, W. A., & Fonstad, M. A. (2008). Optical remote mapping of rivers at sub-meter resolutions and watershed extents. Earth Surface Processes and Landforms, 33(1), 4–24.
34
Masood, M., & Takeuchi, K. (2012). Assessment of flood hazard, vulnerability and risk of mid-eastern Dhaka using DEM and 1D hydrodynamic model. Natural Hazards, 61(2), 757–770. https://doi.org/10.1007/s11069-011-0060-x
Maxwell, S. K., Schmidt, G. L., & Storey, J. C. (2007). A multi‐scale segmentation approach to filling gaps in Landsat ETM+ SLC‐off images. International Journal of Remote Sensing,
28(23), 5339–5356. https://doi.org/10.1080/01431160601034902
Papaioannou, G., Vasiliades, L., & Loukas, A. (2015). Multi-Criteria Analysis Framework for Potential Flood Prone Areas Mapping. Water Resources Management, 29(2), 399–418. https://doi.org/10.1007/s11269-014-0817-6
Poursanidis, D., & Chrysoulakis, N. (2017). Remote Sensing, natural hazards and the contribution of ESA Sentinels missions. Remote Sensing Applications: Society and Environment, 6, 25–38. https://doi.org/10.1016/j.rsase.2017.02.001
Pringle, M. J., Schmidt, M., & Muir, J. S. (2009). Geostatistical interpolation of SLC-off Landsat ETM+ images. ISPRS Journal of Photogrammetry and Remote Sensing, 64(6), 654–664. https://doi.org/10.1016/j.isprsjprs.2009.06.001
Pulvirenti, L., Chini, M., Pierdicca, N., Guerriero, L., & Ferrazzoli, P. (2011). Flood monitoring using multi-temporal COSMO-SkyMed data: Image segmentation and signature interpretation. Remote Sensing of Environment, 115(4), 990–1002.
https://doi.org/10.1016/j.rse.2010.12.002
Salman, A. A., Ali, A. E., & Mattar, H. E. (2008). MAPPING LAND-USE/LAND-COVER OF
KHARTOUM USING FUZZY CLASSIFICATION. 13, 17.
Scarpino, S., Albano, R., Cantisani, A., Mancusi, L., Sole, A., & Milillo, G. (2018). Multitemporal SAR Data and 2D Hydrodynamic Model Flood Scenario Dynamics Assessment. ISPRS
International Journal of Geo-Information, 7(3), 105. https://doi.org/10.3390/ijgi7030105
Schumacher, J., Luedeling, E., Gebauer, J., Saied, A., El-Siddig, K., & Buerkert, A. (2009). Spatial expansion and water requirements of urban agriculture in Khartoum, Sudan. Journal of
35
Schumann, G., Bates, P. D., Horritt, M. S., Matgen, P., & Pappenberger, F. (2009). Progress in integration of remote sensing-derived flood extent and stage data and hydraulic models.
Reviews of Geophysics, 47(3). https://doi.org/10.1029/2008RG000274
Skakun, S., Kussul, N., Shelestov, A., & Kussul, O. (2014). Flood Hazard and Flood Risk Assessment Using a Time Series of Satellite Images: A Case Study in Namibia. Risk
Analysis, 34(8), 1521–1537. https://doi.org/10.1111/risa.12156
Sudan maps | UNITAR. (n.d.). Retrieved 1 October 2019, from https://unitar.org/maps/countries/96
Sutcliffe, J. V., Dugdale, G., & Milford, J. R. (1989). The Sudan floods of 1988. Hydrological
Sciences Journal, 34(3), 355–364. https://doi.org/10.1080/02626668909491339
Teng, J., Jakeman, A. J., Vaze, J., Croke, B. F. W., Dutta, D., & Kim, S. (2017). Flood inundation modelling: A review of methods, recent advances and uncertainty analysis. Environmental
Modelling & Software, 90, 201–216. https://doi.org/10.1016/j.envsoft.2017.01.006
UNDRR. (2019). Report 2019 | GAR. https://gar.undrr.org/report-2019
UNOCHA, (United Nations Office for the Coordination of Humanitarian Affairs). (2013, September 15). Sudan: Flash update, issue no. 9.
https://reliefweb.int/sites/reliefweb.int/files/resources/OCHA%20Sudan%20flash%20updat e%239.pdf
Walsh, R. P. D., Davies, H. R. J., & Musa, S. B. (1994). Flood Frequency and Impacts at Khartoum since the Early Nineteenth Century. The Geographical Journal, 160(3), 266.
https://doi.org/10.2307/3059609
Zha, Y., Gao, J., & Ni, S. (2003). Use of normalized difference built-up index in automatically mapping urban areas from TM imagery. International Journal of Remote Sensing, 24(3), 583–594. https://doi.org/10.1080/01431160304987
Zhang, C., Li, W., & Travis, D. (2007). Gaps‐fill of SLC‐off Landsat ETM+ satellite image using a geostatistical approach. International Journal of Remote Sensing, 28(22), 5103–5122. https://doi.org/10.1080/01431160701250416
36
Annex 1: Spectral Specifications for Landsat Images
Table 1: Landsat 4 - 5 (TM) bands specifications (Source: U.S. Geological Survey)
Bands Wavelength (µm) Resolution (m)
Band 1 0.45 – 0.52 30 Band 2 0.52 – 0.60 30 Band 3 0.63 – 0.69 30 Band 4 0.76 – 0.90 30 Band 5 1.55 – 1.75 30 Band 6 10.40 – 12.50 120 (30) Band 7 2.08 -2.35 30
Table 2: Landsat 7 (ETM+) bands specifications (Source: U.S. Geological Survey)
Bands Wavelength (µm) Resolution (m)
Band 1 0.45 – 0.52 30 Band 2 0.52 – 0.60 30 Band 3 0.63 – 0.69 30 Band 4 0.77 – 0.90 30 Band 5 1.55 – 1.75 30 Band 6 10.40 – 12.50 60 (30) Band 7 Band 8 2.09 – 2.35 0.52 – 0.90 30 15
37 Table 3: Landsat 8 (OLI - TIRS) bands specifications (Source: U.S. Geological Survey)
Bands Wavelength (µm) Resolution (m)
Band 1 - Coastal aerosol 0.43 – 0.45 30
Band 2 – Blue 0.45 – 0.51 30
Band 3 – Green 0.53 – 0.59 30
Band 4 – Red 0.64 – 0.67 30
Band 5 – Near Infrared (NIR) 0.85 – 0.88 30
Band 6 – SWIR 1 1.57 – 1.65 30
Band 7 – SWIR 2 Band 8 - Panchromatic
Band 9 - Cirrus
Band 10 – Thermal Infrared (TIRS) 1 Band 11 – Thermal Infrared (TIRS) 2
2.11 – 2.29 0.50 – 0.68 1.36 – 1.38 10.6 – 11.19 11.50 – 12.51 30 15 30 100 100
38
Annex 2: Maximum Flood Extent Map for 1991
Table 1: Change matrix for 1991 flood event
1991 Water No Water L C L U Urban 0.96% 99.04% Water Bodies 95.05% 4.95% Cropland/Vegetation 10.00% 90.00% Barren 0.35% 99.65%
39
Annex 3: Maximum Flood Extent for 1992
Table 1: Change matrix for 1992 flood event
1992
Water No Water No Data
L C L U Urban 1.60% 67.31% 31.09% Water Bodies 82.15% 5.77% 12.1% Cropland/Vegetation 12.02% 71.61% 16.38% Barren 0.54% 63.19% 36.27%
40
Annex 4: Maximum Flood Extent for 1993
Table 1: Change matrix for 1993 flood event
1993
Water No Water No Data
L C L U Urban 1.24% 54.36% 44.40% Water Bodies 94.71% 1.40% 3.9% Cropland/Vegetation 9.29% 34.74% 55.98% Barren 0.86% 83.95% 15.19%
41
Annex 5: Maximum Flood Extent for 1994
Table 1: Change matrix for 1994 flood event
1994
Water No Water No Data
L C L U Urban 4.01% 17.84% 78.15% Water Bodies 72.26% 0.19% 27.6% Cropland/Vegetation 12.75% 3.66% 83.59% Barren 1.05% 19.65% 79.30%
42
Annex 6: Maximum Flood Extent for 1996
Table 1: Change matrix for 1996 flood event
1996
Water No Water No Data
L C L U Urban 2.29% 94.17% 3.55% Water Bodies 95.50% 4.36% 0.1% Cropland/Vegetation 9.08% 90.49% 0.44% Barren 0.13% 99.26% 0.61%
43
Annex 7: Maximum Flood Extent for 1997
Table 1: Change matrix for 1997 flood event
1997
Water No Water No Data
L C L U Urban 1.23% 7.95% 90.83% Water Bodies 95.13% 0.26% 4.6% Cropland/Vegetation 7.49% 5.01% 87.50% Barren 3.88% 17.58% 78.55%
44
Annex 8: Maximum Flood Extent for 1998
Table 1: Change matrix for 1998 flood event
1998
Water No Water No Data
L C L U Urban 7.07% 34.03% 58.89% Water Bodies 98.78% 0.57% 0.7% Cropland/Vegetation 36.83% 35.17% 28.00% Barren 2.05% 58.54% 39.42%
45
Annex 9: Maximum Flood Extent for 1999
Table 1: Change matrix for 1999 flood event
1999
Water No Water No Data
L C L U Urban 13.83% 6.13% 80.05% Water Bodies 90.46% 0.16% 9.4% Cropland/Vegetation 32.25% 7.61% 60.14% Barren 10.40% 16.89% 72.71%
46
Annex 10: Maximum Flood Extent for 2001
Table 1: Change matrix for 2001 flood event
2001
Water No Water No Data
L C L U Urban 1.40% 96.11% 2.49% Water Bodies 97.60% 1.25% 1.1% Cropland/Vegetation 10.44% 69.13% 20.43% Barren 0.03% 92.73% 7.23%
47
Annex 11: Maximum Flood Extent for 2003
Table 1: Change matrix for 2003 flood event
2003
Water No Water No Data
L C L U Urban 5.49% 66.77% 27.74% Water Bodies 71.67% 1.85% 26.5% Cropland/Vegetation 15.56% 59.00% 25.43% Barren 1.90% 71.15% 26.96%
48
Annex 12: Maximum Flood Extent for 2005
Table 1: Change matrix for 2005 flood event
2005
Water No Water No Data
L C L U Urban 2.22% 66.38% 31.40% Water Bodies 73.70% 3.03% 23.3% Cropland/Vegetation 6.33% 67.70% 25.97% Barren 0.80% 69.86% 29.33%
49
Annex 13: Maximum Flood Extent for 2006
Table 1: Change matrix for 2006 flood event
2006
Water No Water No Data
L C L U Urban 13.31% 34.42% 52.27% Water Bodies 90.06% 0.18% 9.8% Cropland/Vegetation 32.02% 27.54% 40.44% Barren 5.16% 47.30% 47.55%
50
Annex 14: Maximum Flood Extent for 2007
Table 1: Change matrix for 2007 flood event
2007
Water No Water No Data
L C L U Urban 11.72% 88.11% 0.17% Water Bodies 98.33% 0.43% 1.2% Cropland/Vegetation 16.09% 45.50% 38.40% Barren 3.02% 59.38% 37.60%