RESEARCH ARTICLE
Placenta-Enriched LincRNAs
MIR503HG
and
LINC00629
Decrease Migration and Invasion
Potential of JEG-3 Cell Line
Bruna Rodrigues Muys1,2,3, Júlio Cesar Cetrulo Lorenzi1,2,3, Dalila Luciola Zanette4, Rafaela de Barros Lima e Bueno1,2,3, Luíza Ferreira de Araújo1,2,3, Anemari
Ramos Dinarte-Santos2,3, Cleidson Pádua Alves1,2,3, Anelisa Ramão1,2, Greice Andreotti
de Molfetta1,2,3, Daniel Onofre Vidal5, Wilson Araújo Silva, Jr.1,2,3 *
1Department of Genetics, Ribeirão Preto Medical School, University of São Paulo, Ribeirão Preto, Brazil, 2Center for Cell-Based Therapy (CEPID/FAPESP), National institute of Science and Technology in Stem Cell and Cell Therapy (INCTC/CNPq), Regional Blood Center of Ribeirão Preto, Riberão Preto, Brazil, 3Center for Medical Genomics (HCFMRP/USP), Center for Integrative Systems Biology (CISBi–NAP/USP), Ribeirão Preto, Brazil,4Gonçalo Moniz Research Center, Oswaldo Cruz Foundation, Bahia, Brazil, 5Molecular Oncology Research Center, Barretos Cancer Hospital, Barretos, Brazil
Abstract
LINC00629andMIR503HGare long intergenic non-coding RNAs (lincRNAs) mapped on chromosome X (Xq26), a region enriched for genes associated with human reproduction. Genes highly expressed in normal reproductive tissues and cancers (CT genes) are well known as potential tumor biomarkers. This study aimed to characterize the structure, expression, function and regulation mechanism ofMIR503HGandLINC00629lincRNAs. According to our data,MIR503HGexpression was almost exclusive to placenta and
LINC00629was highly expressed in placenta and other reproductive tissues. Further analy-sis, using a cancer cell lines panel, showed thatMIR503HG and LINC00629were
expressed in 50% and 100% of the cancer cell lines, respectively.MIR503HGwas expressed predominantly in the nucleus of JEG-3 choriocarcinoma cells. We observed a positively correlated expression betweenMIR503HGandLINC00629, and between the lincRNAs and neighboring miRNAs. Also, bothLINC00629andMIR503GHcould be nega-tively regulated by DNA methylation in an indirect way. Additionally, we identified new tran-scripts forMIR503HGandLINC00629that are relatively conserved when compared to other primates. Furthermore, we found that overexpression ofMIR503HG2and the three-exonLINC00629new isoforms decreased invasion and migration potential of JEG-3 tumor cell line. In conclusion, our results suggest that lincRNAsMIR503HGandLINC00629
impaired migration and invasion capacities in a choriocarcinomain vitromodel, indicating a potential role in human reproduction and tumorigenesis. Moreover, theMIR503HG expres-sion pattern found here could indicate a putative new tumor biomarker.
OPEN ACCESS
Citation:Muys BR, Lorenzi JCC, Zanette DL, Bueno RdBLe, Araújo LFd, Dinarte-Santos AR, et al. (2016) Placenta-Enriched LincRNAsMIR503HGand
LINC00629Decrease Migration and Invasion Potential of JEG-3 Cell Line. PLoS ONE 11(3): e0151560. doi:10.1371/journal.pone.0151560
Editor:Cees Oudejans, VU University Medical Center, NETHERLANDS
Received:March 20, 2015
Accepted:March 1, 2016
Published:March 29, 2016
Copyright:© 2016 Muys et al. This is an open access article distributed under the terms of the
Creative Commons Attribution License, which permits unrestricted use, distribution, and reproduction in any medium, provided the original author and source are credited.
Data Availability Statement:All sequences files are available from the GenBank database (accession number(s) KM886853, KM886854, KM886855, KM886856 and KM886857).
Introduction
There is evidence that the X chromosome contains more genes related to sex and reproduction than we would be expected by chance [1]. Specifically, it is known that region Xq26 harbors critical genes responsible for placental and normal fetal development, includingPLAC1gene [2], which expression is restricted to placenta [3]. Interestingly, PLAC1 protein is present in a variety of tumor types, and its expression was previously associated with the malignant pheno-type [4–5]. Until recently,PLAC1has been the only candidate gene, within the chromosome region Xq26, relevant for normal placental development. Nevertheless, according to the most updated version of the human genome [2], new genes with unknown functions have been iden-tified in this region, such asPHF6,MIR503HG, andLINC00629, the last two were previously known asMGC16121 and CR596471,respectively.
MIR503HGandLINC00629genes are mapped betweenHPRT1andPLAC1loci (Genome
Browse–UCSC; Feb. 2009, CRCh37/hg19) in opposite orientations and are about 3kb apart from each other (S1 Fig). Both genes present three exons and CpG islands in their putative pro-moter regions. Also, they were described as long intergenic non-coding RNAs (lincRNAs): RNAs longer than 200 bp, non-translated and located between protein-coding genes. LincR-NAs are involved in regulation of transcription, processing, and post-transcription pathways [6] and when deregulated, they are associated with several types of cancer [7].
Considering the significance of Xq26 region in embryo development and similarity between germinal and placental cells with tumors [8], we sought to characterize the structure, expres-sion pattern, function, and regulation mechanism ofMIR503HGandLINC00629genes.
Results
MIR503HG
and
LINC00629
are highly expressed in reproductive tissues
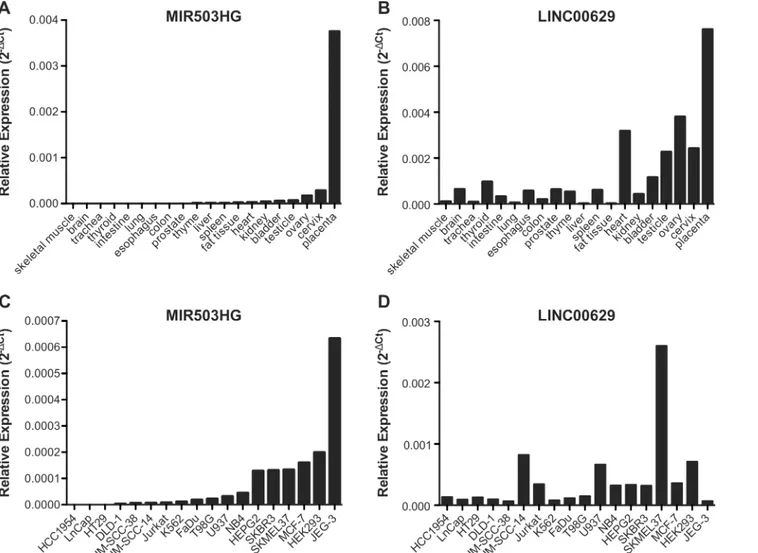
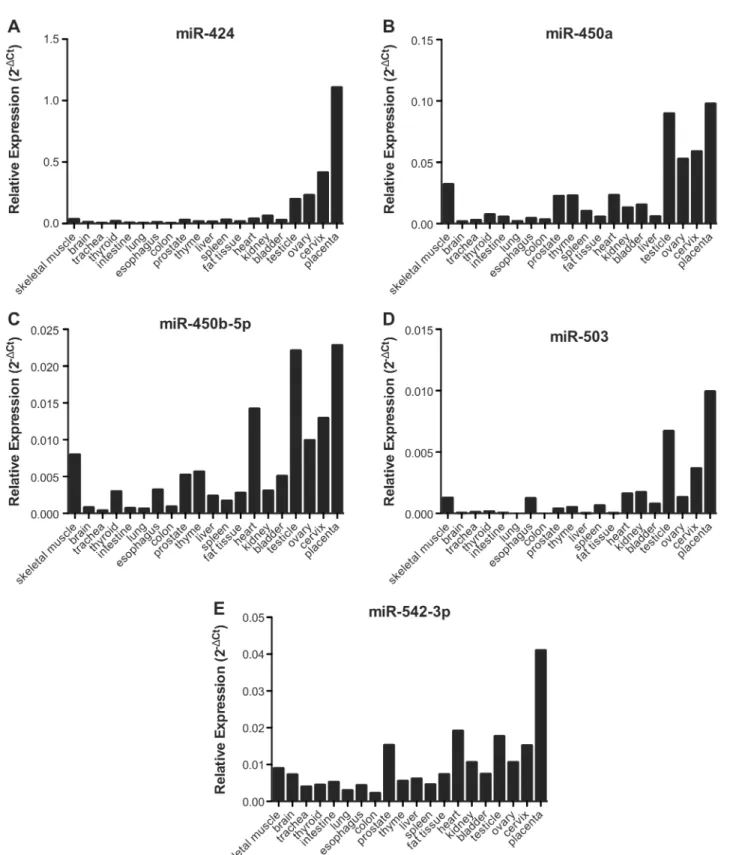
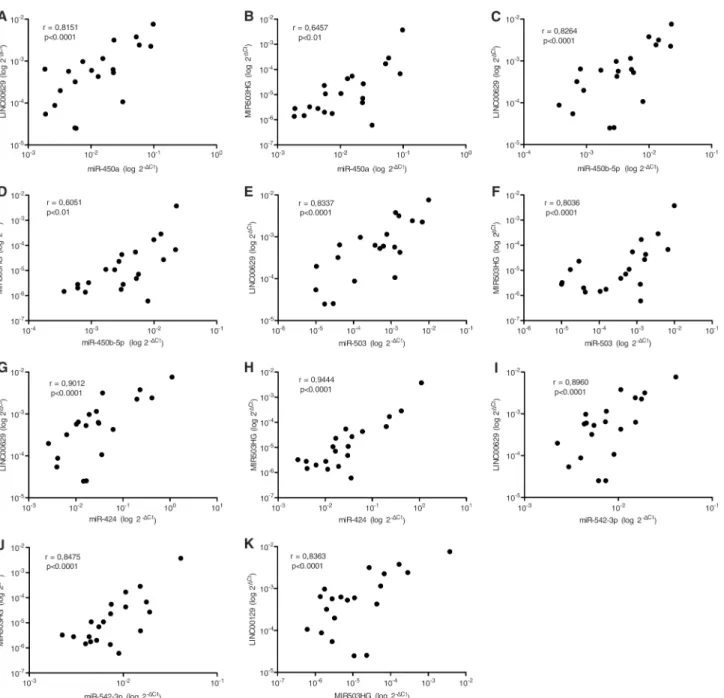
MIR503HGandLINC00629genes are located in the same region asPLAC1, whose expression is restricted to placenta and recently was found to be expressed in cancer cells [2]. Therefore, we sought to determine the expression levels ofMIR503HGandLINC00629in RNA samples from a commercial normal human tissue panel. We found thatMIR503HGexpression is almost restricted to the placenta (Fig 1A) and thatLINC00629was also highly expressed in pla-centa and other reproductive tissues (Fig 1B). RT-qPCR analysis of 18 cancer cell lines revealed thatMIR503HGis expressed in 50% (9/18) andLINC00629in 100% of them, considering as not expressed samples with Cts values above 34 (Fig 1C and 1D, respectively).MiRNAs flanking the same region also tended to be higher expressed in reproductive tissues as ovary, cervix, and placenta, similarly toLINC00629(Fig 2). Furthermore, using the normal tissue panel, we observed a significant positive correlation betweenMIR503HGand
LINC00629lincRNAs (Fig 3K), and also between both lincRNAs and the neighboring miRNAs: miR-424, miR450a, miR-450b-5p, miR-542-3p and miR-503 (Fig 3A–3J).
MIR503HG
and
LINC00629
expression can be indirectly regulated by
methylation
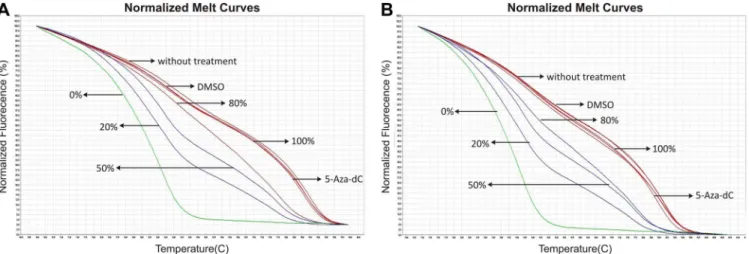
The presence of CpG islands in the promoter regions of both lincRNAs suggests that DNA methylation could regulate them. To test this possibility, we treated cancer cell lines with low expression ofMIR503HGandLINC00629with the demethylating agent 5-Aza-2-deoxycytidine (5-Aza-dC).
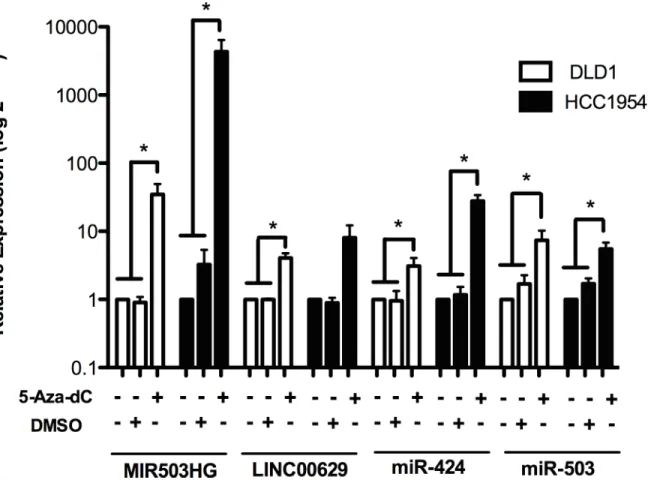
Treatment with 5-Aza-dC at 5μM significantly increasedMIR503HGexpression in
mam-mary gland tumor cell line (HCC1954) and the colorectal adenocarcinoma cell line (DLD-1). On the other hand,LINC00629expression was increased by treatment only in the DLD-1 cell
LincRNAs Structure, Expression Pattern, Function, and Regulation Mechanism Characterization
no role in study design, data collection and analysis, decision to publish, or preparation of the manuscript.
line (Fig 4). Likewise, the miRNAs miR-424 and miR-503, which are mapped in the
MIR503HGgene, also presented increased expression after 5-Aza-dC treatment (Fig 4). Interestingly, Methylation Sensitive High-Resolution Melting (MS-HRM) revealed that meth-ylation status of the CpG islands near to putative promoter region of both genes did not change after treatment. Both control and treated samples were 100% methylated (Fig 5). To prove that DNA global demethylation was effective after 5-aza-dC treatment, we digested DNA derived from treated samples usingMspIandHpaIIrestriction enzymes.HpaIIis sensitive to DNA methylation within the CCGG region and an isoschizomer ofMspI. Comparing DNA band intensities in agarose gel from samples digested withMspIorHpaII, we verified that 5-aza-treated samples presented a lower methylation level than un5-aza-treated samples (S2 Fig).
MIR503HG
and
LINC00629
new isoforms
AlthoughMIR503HGandLINC00629genes have been recently validated, we have found some isoforms not previously reported nor deposited atNCBI RNA reference sequences collection Fig 1.MIR503GHandLINC00629are highly expressed in placenta and also expressed in other reproductive tissues.A and B.MIR503GHand LINC00629expressions were determined using RNA samples from a commercial normal human tissue panel, and C and D. Expressions were determined using RNA samples from tumor cell lines. RT-qPCR evaluated the RNA expressions and further normalized by geometric mean from the endogenous genes GAPDH and HPRT.
doi:10.1371/journal.pone.0151560.g001
Fig 2. miRNAs flankingMIR503HGandLINC00629genes are in general more expressed in reproductive tissues, a similar expression pattern as
the lncRNAs.A-E: RT-qPCR analysis using RNA samples from a commercial normal human tissue panel and further normalized by geometric mean from the snoRNAsRNU24andRNU48.
doi:10.1371/journal.pone.0151560.g002
(RefSeq). The new sequences identified for both genes were submitted to the GenBank database under accession numbers KM886853 (MIR503HG2), KM886854 (LINC00629A), KM886855 (LINC00629B), KM886856 (LINC00629C) and KM886857 (LINC00629D).
Regarding to theMIR503HGgene, we identified an isoform that had a smaller 5’region and a longer 3’region when compared to theMIR503HGsequence, currently deposited in RefSeq (Fig 6A). We denominated this new isoformMIR503HG2. Likewise,LINC00629presented other four isoforms, two of them carried three exons and the other two had only two exons. In GenBank, we deposited theLINC00629isoforms:LINC00629AandLINC00629B(2 exons);
Fig 3.MIR503HGandLINC00629lncRNAs expression are related to each other and to their neighboring microRNAs, in normal tissue panel.A-J.
Pearson Correlation (r) test between one of the lncRNAs and a neighbor microRNA.K. Pearson Correlation (r) test betweenMIR503HGandLINC00629
genes.
doi:10.1371/journal.pone.0151560.g003
LINC00629CandLINC00629D(3 exons). We observed that in the three-exon isoforms, the first exon was mapped in a different position than in the original sequence previous described at RefSeq. We found no similar transcripts to the isoforms containing two exons in the same data bank (Fig 6B). Isoforms with the same number of exons also differ by their length in poly A tail.
The expression profile for the two and three-exonsLINC00629isoforms described herein is similar to normal tissues and cancer cell lines tested. However, the isoforms containing three exons were more expressed than the two-exons isoforms (S3 Fig).
Conservation and secondary structure
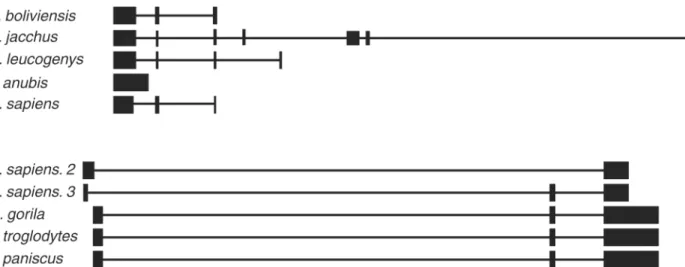
To evaluate the conservation and structure of the new isoforms, we compared them with simi-lar sequences from other species deposited in the GenBank (RefSeq). The most simisimi-lar sequences were found in other primates. RegardingMIR503HG2, the sequences with the high-est identity were fromNomascus leucogenys,Papio anubis,Saimiri boliviensisandCallithrix jacchus. When aligned to the human genome, the last exons were apparently the most con-served (Fig 7A). ForLINC00629, we only evaluated one of each two-exons or three-exons
Fig 4.MIR503HGandLINC00269expression can be regulated by methylation.Expression levels ofMIR503HG,LINC00269,and their neighbouring miRNAs—miR-424 and miR-503, were determined in RNA samples from breast and colon adenocarcinoma cell lines treated with 5-aza-2-deoxycytidine (5-Aza-dC) by RT-qPCR normalized to the geometric mean fromGAPDHandHPRTgenes (forMIR503HGandLINC0026genes) or snoRNAsRNU24andRNU48(for
miRNAs). Relative expression was obtained from three independent experiments using samples without treatment as reference samples (2-ΔΔCT).*p<0.05 (t-test).
doi:10.1371/journal.pone.0151560.g004
isoforms, once they were very similar, differing only in the 3’end. For both types of isoforms, the most similar sequences were found inPan paniscus,Pan troglodytesandGorilla gorilla
(Fig 7B).
Analysis of the secondary structure ofMIR503HG2showed that the region corresponding to the exon 3, displayed a substructure similar to other primates (S4 Fig).
MIR503HG
is predominantly found in nucleus and
LINC00629
is evenly
spread in JEG-3 choriocarcinoma cell line
To determine the cellular location fromMIR503HGandLINC00629RNAs, we extracted RNA from nucleus and cytoplasm from JEG-3 cells cultured in normal conditions.Fig 8shows that
MIR503HGRNA was mainly found in the nucleus, about 12-fold higher expressed than in cytoplasm (p<0.001), andLINC00629was equally dispersed in cell compartments.
Fig 5. 5-Aza-2-deoxycytidine (5-Aza-dC) treatment does not affect methylation status of the CpG islands near to putative promoter region of both genes.Representative normalized melt curves from samples treated with demethylating agent 5-Aza-dC. A-B. DNA analyzed from the CpG island at the promoter region ofMIR503HGgene in DLD1 (a) and HCC1954 (b) cell lines. C. DNA analyzed from the CpG island at the promoter region ofLINC00629
gene in DLD1 cell line. Arrows indicate curves that correspond the percentage of methylation from reference, treatment, and control DNA samples. Images were obtained from High-ReSolution Melt Software v2.
doi:10.1371/journal.pone.0151560.g005
MIR503HG
and
LINC00629
inhibit migration and invasion in JEG-3
choriocarcinoma cell line
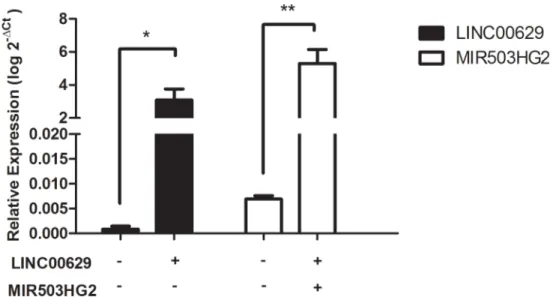
Taking into account thatMIR503HGandLINC00629were lower expressed in JEG-3 cell line than in normal placenta tissues (Fig 1), we used this cell line to overexpress theMIR503HG2
and the 3-exonLINC00629isoforms (Fig 9).
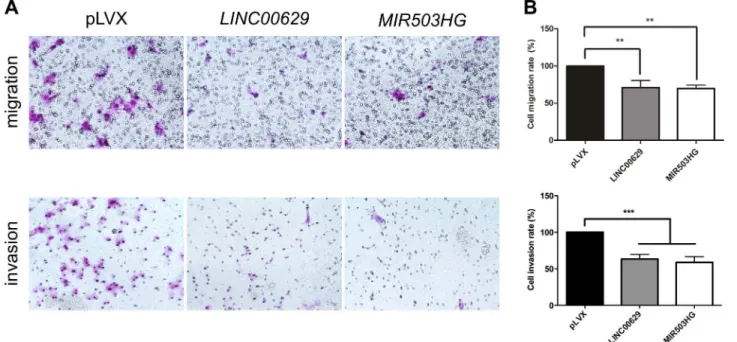
We found that the overexpression of both lincRNAs reduced the percentage of migrating cells around 30% (p<0.01) and invading cells in approximately 40% (p<0.001) (Fig 10A and
10B). However, there were no change of cells in S phase in cell cycle assay (S5 Fig), suggesting that cell proliferation not is affected by these lincRNAs.
Fig 6. New isoforms ofMIR503HGandLINC00629genes were identified.A.MIR503HGnew isoform, namedMIR503HG2. B.LINC00629four new isoforms containing either two exons (LINC00629AandLINC00629B) or three exons (LINC00629CandLINC00629D). The sequences were aligned by BLAT tool to the human genome (http://genome.ucsc.edu.version:Feb.2009,CRCh37/hg19).*Reference isoforms.
doi:10.1371/journal.pone.0151560.g006
Fig 7. Evolutionary conservation of the new isoforms.A. Sequence obtained fromMIR503HG2isoform (H.sapiens) aligned to human genome using BLAT tool (http://genome.ucsc.edu.version:Feb.2009,CRCh37/hg19)with similar sequences inSaimiri boliviensis(S.boliviensis),Callithrix jacchus(C.
jacchus),Nomascus leucogenys(N.leucogenys) andPapio anubis(P.anubis) found in NCBI-BLAST. B. Sequences obtained fromLINC0026isoforms comprising two exons (H.sapiens. 2) and three exons (H.sapiens. 3) aligned to human genome using BLAT tool (http://genome.ucsc.edu.version:Feb.
2009,CRCh37/hg19)with similar sequences inGorilla gorilla(G.gorilla),Pan troglodytes(P.troglodytes) andPan paniscus(P.paniscus) found in NCBI-BLAST.
doi:10.1371/journal.pone.0151560.g007
Discussion
Despite their functions, placenta, and germinative cells display some characteristics similar to tumor cells [8–9]. These include proliferation, migration, and invasion [10]. Consequently, the study of genes expressed in placenta and germinative cells could be considered a model system to investigate tumorigenic mechanism [10].
We showed here the characterization ofMIR503HGandLINC00629genes. Both genes are described as lincRNAs located in Xq26 region, which contains other genes related to
Fig 8. Cellular location ofMIR503HGandLINC00269RNAs.RNA samples were extracted from nuclear and cytoplasmic fractions of JEG3 cells.
RT-qPCR obtained relative expression from three experiments normalized to 18S ribosomal RNA. GAPDH fits as a control of predominantly cytoplasmic genes. **p<0.01 and***p<0.001 (t-test).
doi:10.1371/journal.pone.0151560.g008
Fig 9.MIR503HG2orLINC00269were overexpressed in JEG-3 cell line.Plasmidial expression vectors
containingMIR503HG2orLINC00629full-length sequences were transfected into JEG-3 cell line. Relative expression was analyzed by RT-qPCR normalized by the geometric mean fromGAPDHandHPRT
endogenous genes. The empty plasmid was used as a control.*p<0.05 and**p<0.01 (t-test).
doi:10.1371/journal.pone.0151560.g009
reproduction, fetal and placental development [2–3]. To our knowledge, gene expression pro-files of bothlociin normal and tumor cell lines have not been shown in the literature. Accord-ing to Sasaki et al. [11] and Cabili et al. [12], most of the lncRNAs are expressed in a tissue-specific manner and probably regulate tissue-specific biologic process in each tissue.
MIR503HGandLINC00629genes were higher expressed in placenta compared to other normal tissues.LINC00629gene was also expressed in other tissues related to reproduction, such as cervix, ovary and testis. The same expression pattern was observed for miRNAs located near the studiedloci(miR-424, miR-450a, miR-450b-5p, miR-503 and miR-542-3p). Takada et al. [13] showed in mice that the expression of miR-503 was restricted to placenta and ovary, supporting the suggestion that Xq26 region is involved in human reproduction and develop-ment. In a similar way, C19MC, which is exclusively expressed in placenta, contains miRNAs that are aberrantly expressed in specific human malignancies [14].
The positively correlated expression ofMIR503HGandLINC00629genes and neighbor miRNAs suggests that all of them might be regulated simultaneously and that genetic and epi-genetic alterations found in tumors could disrupt this control. However, on the opposite of our finding, Fiedler et al. [15] verified thatMIR503HGrepression up-regulated miR-424 in Human Umbilical Vein Endothelial Cells (HUVECs). We suggest that this correlation may be tissue related.
MIR503HG,LINC00629, miR-424 and miR-503 were negatively regulated by DNA methyl-ation after treatment with the demethylating agent 5-aza-2-deoxycytidine. A previous study had already demonstrated that methylation regulates miR-503 in non-small lung cancer cell lines [16]. Nevertheless, the CpG dinucleotides from CpG islands located near theMIR503HG
andLINC006295’regions apparently have no effect on their expression. In this way, they must be regulated by demethylation in an indirect route. As observed in CTAs (cancer/testis-associ-ated genes), the selective expression in germinal tissues and tumor cells can be regul(cancer/testis-associ-ated by
Fig 10.LINC00629orMIR503HG2overexpression decreased migration and invasion rates of JEG3 cell line.A. Representative figures from transwell
migration (upper) and invasion assays (bottom) from cells containing empty (pLVX),MIR503HG2orLINC00629expression vectors. B. Graph bars are showing migration and invasion rates after 48 hours from transfection. The data represent the average of 2 or 3 experiments performed in triplicate.**p
<0.01 and***p<0.001 (ANOVA followed by Bonferroni post-test).
doi:10.1371/journal.pone.0151560.g010
DNA methylation [17]. In this way, despite the fact that our study is about non-coding RNAs, both genes seem to be regulated by the same mechanism.
MIR503HGandLINC00629 locipredicted from Expressed Sequence Tags (ESTs), which are more prone to have mistakes, mostly in its ends [18]. The RACE approach revealed that
LINC00629locus transcribes two isoforms with two exons. Besides, the results showed that the three-exons isoforms presented higher expression than the two-exons isoforms, suggesting an important role in processes regulated byLINC00629gene.
Even though long non-coding genes are less conserved than coding genes regarding nucleo-tide sequence, they present highly conserved secondary structures [19]. The transcripts herein described are relatively conserved when compared to RNA sequences found in other primates. As stated by Necsulea et al. [20], theMIR503HGgene was originated at least 370 Myr ago in the tetrapod ancestor and, curiously, its expression pattern changed from predominantly testic-ular in ancestors to placental in eutherians.
Interestingly, we found that the last exon of theMIR503HG2transcript has a secondary sub-structure, which is very similar to transcripts fromNomascus leucogenys,Callithrix jacchusand
Saimiri saimiri. The presence of a domain that is evolutionarily conserved in nucleotide sequence and RNA secondary structure suggests that it may represent a functional domain [21], and probably could be the most important region of these transcripts.
Functions of lncRNAs depend on cellular location, and most lincRNAs are located in the nucleus [22], as we foundMIR503HGin JEG-3 cells. This suggests that it could act organizing sub-structures, altering the chromatin state or regulating gene expression [23]. On the other hand,LINC00629, which is evenly spread in nucleus and cytoplasm, may have a different role in global cellular function.
Functional assays demonstrated that overexpression ofMIR503HG2andLINC00629 three-exon isoform (LINC00629CandLINC00629D) decreased cell migration and invasion rates, indicating a potential role in tumorigenesis. Besides, once both lincRNAs are enriched in pla-centa and located in Xq26 region, we suggest that they could act as tumor suppressors in cho-riocarcinoma, which lost its ability to cease invasion and migration. Nevertheless, Fiedler et al. [15] verified thatMIR503HGsuppression inhibited migration and proliferation in HUVEC cells, indicating that its action must be influenced by cell context or isoform type.
Here we have characterized the structure, regulation by methylation and function of
MIR503HGandLINC00629genes. Based on their expression profile and their effects on migra-tion and invasion in a model of choriocarcinoma, our study suggests a potential role for
MIR503HGandLINC00629genes in tumorigenesis and human reproduction, considering the similarity among normal placenta and germinal tissues to tumors. Additionally, the expression pattern found forMIR503HGcould indicate a putative new tumor biomarker.
Materials and Methods
Cell culture experiments
For this work we used commercial human cell lines. All procedures were performed after approval of the Internal Human Ethics Committee (13867/2011) at the Clinical Hospital of the Medical School of Ribeirao Preto (Brazil).
Mammary gland tumor cell line HCC1954 and colorectal adenocarcinoma cell line DLD-1 were purchased from the American Type Culture Collection (ATCC) and cultivated in RPMI medium (Gibco, Catalog No. 31800–022). The JEG-3 cell line, from human choriocarcinoma, as well as FaDu, UM-SCC-14 and UM-SCC-38 cell lines, head and neck squamous cell carci-noma, were kindly provided by Dr. Eloiza H. Tajara from the School of Pharmaceutical Sci-ences–UNESP. JEG-3 cells were cultured in Eagle's Minimum Essential Medium (ATCC,
Catalog No. 30–2003). All mediums were supplemented with 10% FBS (GE Healthcare, Cata-log No. SH30071.03) and 1% penicillin-streptomycin (Sigma-Aldrich Co., CataCata-log No. P4333). All other cell lines utilized were purchased from ATCC or DSMZ and cultured according to recommended mediums. Cells were kept at 37°C and 5% CO2.
Plasmid construction
Plasmids expression vectors containing GFP and theMIR503HG2orLINC00629full-length sequence were constructed using pLVX-IRES-ZsGreen Vector (Clontech, Catalog No. 632187, modified for restriction enzymes positions), EcoRI and BamH1 restriction enzymes (New England BioLabs Catalog No. R0101S and R0136S, respectively). We used cDNA derived from placenta tissue from a panel of 20 normal tissues RNA (FirstChoice Human Total RNA Panel Survey, Ambion, Catalog No. AM6000) to generate the lincRNAs full sequences. We used the following pair of primers to amplifyMIR503HG2: MIR F: 5’GGATCCGCTCCCCGCGA
GGCCGGCT 3’and MIR R: 5’GAATTCGGACAGTTGCCC ATATTAAC 3’, and LINC F 5’
GGATCCACTGGGCGCCCAGAGTAA 3’and LINC R 5’GAATTCGAGAGTGACTTG CA
GTCTTGTG 3’to amplifyLINC00629three-exon isoform (LINC00629CorLINC00629D).
Plasmid transfection
The lincRNAs in this study were transfected in JEG-3 cell line using Lipofectamine 2000 reagent (Thermo Scientific, Catalog No. 11668–019) together with 500 ng of vector DNA for each well in 24 well plates. As a negative control, we used the empty vector. Experiments were performed 48 hours after transfection. The transfection efficiency and cell viability were evalu-ated by GFP expression and PI staining, using FACS Calibur flow cytometer (Becton
Dickinson).
Migration and invasion assays
Cell migration was evaluated in 24-well transwell plates (Greiner BioOne, Catalog No 662638). Matrigel Invasion Chamber (Corning, Catalog No. 354480) replaced the filters, in the invasion assay. Cells from the upper compartment were removed with a cotton swab and cells that migrated to the lower face of the filter were fixed in 4% formaldehyde (in PBS) and stained with 0.5% crystal violet. The number of cells was manually counted using Image J software. All experiments were performed two to three times, independently.
Cell cycle assay
Cell cycle assay was done synchronizing cells by FBS starving for 24 hours before vectors trans-fection. After 48 hours post transfection, cells were fixed with ice-cold absolute ethanol over-night, added to RNAse A and PI and analyzed in FACS Calibur flow cytometer. All
experiments were performed three times, independently.
5-Aza-dC treatment
For 5-Aza-,2-deoxycytidine (Sigma-Aldrich Co., Catalog No. A3656) treatment, 1.3x10⁵ DLD-1, and HCC1954 cells were cultured in each well of a six-well plate. After 24 hours, 5-Aza-2-deoxycytidine diluted in DMSO (Sigma-Aldrich Co., Catalog No. D2650) was added to a final concentration of 5μM. Mediums were changed each 24 hours adding fresh drug each day,
for three days. At the end of the experiment, the cells were harvested, and the viability analyzed using trypan blue (Life, Catalog No. 15250–061). All experiments were performed three times, independently.
DNA and RNA extraction
RNA and DNA from cells were extracted with Trizol Reagent (Life, Catalog No. 15596–018), according to the manufacturer’s protocol.
RT-qPCR analysis
To evaluate the expression profile of the lincRNAs, we used RNA extracted from cancer cell lines and a panel of 20 normal tissues (FirstChoice Human Total RNA Panel Survey, Ambion, Catalog No. AM6000). Reverse transcription was performed with High Capacity cDNA Reverse Transcription Kit (Thermo Scientific, Catalog No. 4368813), according to supplier´s protocol.
The RT-qPCR analysis was performed using Taqman Gene Expression Assay (Applied Bio-systems) or IDT (Integrated DNA Technologies) probes. ForMIR503HGRefSeq isoform we used the assay Hs03681341_m1 (Applied Biosystems) and for both RefSeq andMIR503HG2
isoforms we utilized Hs.PT.58.2631940 (Integrated DNA Technologies). ForMIR503HG2 spe-cific isoform, we used a custom probe with the following sequences: primer F: 5`CAG CCT TCC TGA AAG ACC A 3`; primer R: 5`TGT TGA TGT AGT GTT CCT GGG T 3`and probe:
5`CT CCA GTG G A CGC CTG CAG G 3`(Integrated DNA Technologies). ForLINC00629
gene, we used the assay 186830593 (Applied Biosystems) forLINC00629A andLINC00629B isoforms and the assay Hs04274538_m1 (Applied Biosystems) for RefSeq,LINC00629C, and
LINC00629D isoforms. Expression levels were normalized with endogenous genesGAPDH
(Applied Biosystems, Catalog No. Hs02758991_g1) andHPRT1(Applied Biosystems, Catalog No. Hs02800695_m1). MiRNAs expression analyzes were performed using TaqMan miRNA Assay (Applied Biosystems), for miR-424 (Catalog No. 000604), miR-450a (Catalog
No.002303), 450b-5p (Catalog No.002207), 542-3p (Catalog No.001284) and miR-503 (Catalog No.001048). The snoRNAsRNU24(Catalog No. 001001) andRNU48(Catalog No. 001006) were used as endogenous genes. All reactions were performed in duplicates at 7500 Fast Real-Time PCR System (Applied Biosystems, Catalog No. 4351107) with Taqman Universal PCR Master Mix (Applied Biosystems, Catalog No. 4369016), using 4μl from diluted
cDNA in a final reaction volume of 10μl. qPCR conditions were: 1 cycle of 10 min at 95°C,
fol-lowed by 40 cycles of 94°C, 15s and 60°C for 1 min.
All the expression data, except the ones from the demethylating treatment, were analyzed by the formula 2-ΔCt, in whichΔCt value was calculated using the geometric mean from endog-enous genes. For the demethylating treatment experiment, we used 2-ΔΔCt, with the same endogenous and considering samples without treatment as a reference sample.
Nucleus and cytoplasm expression assay
For nucleus and cytoplasm RNA separated extraction, we used PARIS Kit (Thermo Scientific, Catalog No. AM1921) according to supplier’s protocol and utilizedGAPDHRNA (Applied Biosystems, Catalog No. Hs02758991_g1), predominantly cytoplasmic, as a control. We nor-malized the expression levels with endogenous rRNA 18S (Applied Biosystems, Catalog No. 4319413E) and expression analysis was performed as the previous item.
DNA methylation assay
The DNA obtained from cell lines were subjected to treatment with sodium bisulfite, which is based on deamination of unmethylated cytosines to uracil and maintenance of methylated cytosines, in the presence of NaOH and sodium bisulfate [24]. For this procedure, we used Epi-Tect Bisulfite Kit (Qiagen, Catalog No. 59104), according to manufacturer's instructions.
The Methylation Sensitive High-Resolution Melting (MS-HRM) method allows analyzing the methylation percentages among different converted bisulfite DNA samples. This method is based on different dissociation times from double strand to single strand DNA, among distinc-tive methylated samples after PCR [25].
We utilized standard DNA fully methylated and no-methylated from EpiTect Control DNA (Qiagen, Catalog No. 59655) diluted in different concentrations (0%, 20%, 50%, 80% and 100% methylated) that we used as a reference.
To perform the HRM-MS method were used 10 ng of modified DNA sample, MeltDoctor HRM Master Mix (Applied Biosystems, Catalog No. 4415440) 1X and 0.3μM of each primer
sequence (forward and reverse) to a final volume of 20μL. The reactions were performed in
replicate using 7500 Fast Real-Time PCR System (Applied Biosystems, Catalog No. 4351107). The following cycle was used: 95°C (10 minutes), followed by 40 cycles of 95°C (15 seconds) and 60°C (1 minute); succeeded by the corresponding melting phase at 95°C (10 seconds), 60°C (1 minute), 95°C (15 seconds) and 60°C (15 seconds).
For CpG island located near to the 5'MIR503HGgene end, we used the following pair of primers: F MG HRM-MS: 5' GTTTATGCGTTTTAGTTTAGTTAGG 3' and R MG HRM-MS:
5' CGTATTCCTACCACCAAATACC 3'. For CpG island located near to the 5'LINC00629
gene end, it was analyzed by the following pair of primers: CR F HRM-MS: 5'CGGGGTGGGG ATTTTTTG3' and R CR HRM-MS: 5'ACAACTACGACCTCCCTC3 '. For both pairs, 60°C was used as annealing temperature.
The DNA derived from three independent experiments were analyzed in High ReSolution Melt Software v2 (Applied Biosystems, Catalog No. 4397808).
Rapid Amplification of cDNA Ends (RACE)
We used the GeneRacer Kit (Invitrogen, Catalog No. L1502-01) as indicated in the manufac-turer’s protocol to theMIR503HGandLINC00629genes. For the definition of the 5’and 3’
regions ofMIR503HGgene we used the RNA from the cell lines HEK293 and MCF-7 and, for theLINC00629gene, we used the UM-SCC-14 cell line. The following primers were used:
MIR503HG5’region Reverse primer: 5’GGAGTACAGCCCACTGTTTT 3’, andLINC00629
5’region Reverse primer: 5’GCTGAATAACGGATTACCCC 3’.MIR503HG3’region For-ward primer: 5’GCCAGCCAGCCTTCCTGAAA 3’, andLINC006293’region Forward
primer: 5’GGG GTAATCCGTTATTCAGC 3’.
The sequences obtained by RACE technique and by PCR regarding the CpG islands were evaluated using the software Codoncode Aligner (CodonCode Corp.) and aligned to the human genome using the BLAT tool [26] (website:http://genome.ucsc.edu/).
Conservation and secondary structure analyses
Nucleotide sequences obtained by RACE technique were analyzed by The Basic Local Align-ment Search Tool (NCBI-BLAST) [27–29], searching for similar RNA sequences contained in the NCBI Reference RNA sequences (RefSeq_rna) [28]. Then, sequences similar to nonhuman RNA were compared to the studied genes and further aligned to the human genome, through the BLAT tool [26] (website:http://genome.ucsc.edu/). Additionally, we predicted the common RNA structure using the TurboFold algorithm, available in RNAstructure platform (http://rna. urmc.rochester.edu/RNAstructureWeb/) [29], which presents the common RNA structures with the lowest free energy values.
Statistics Analysis
The expression data derived from cancer cell lines and normal tissue were analyzed with Pear-son’s correlation coefficient, using expression values found for each gene and the miRNA. For the demethylating treatment experiment, transfected cells assays and nucleus/cytoplasm expression assay, we used Student's t-test. For migration and invasion assays, we used ANOVA followed by Bonferroni post-test. All the statistical analysis were performed with GraphPad Prism 4 software and p<0.05 was considered as significant.
Supporting Information
S1 Fig. Schematic figure showingMIR503HG,LINC00629and neighboring miRNAs posi-tions in Xq26 region.Lighter gray bars at the bottom represent CpG islands. Adapted from Genome Browse–UCSC; Feb. 2009, CRCh37/hg19.
(JPG)
S2 Fig. Global DNA methylation assay of cell lines treated with 5-Aza-dC.Genomic DNA samples from cell lines HCC1954 and DLD-1 treated with vehicle (DMSO), or 5μM 5-Aza-dC
were digested withMspIorHpaIIrestriction enzymes and loaded in a one percent SYBR stained agarose gel.HpaIIis sensitive to DNA methylation within the CCGG region and an iso-schizomer ofMspI. ND: non-digested DNA.
(TIF)
S3 Fig. Expression ofLINC00629isoforms.A.LINC00629isoforms expression pattern in
normal tissue panel. B.LINC00629isoforms expression in cancer cell lines. The endogenous
GAPDHandHPRTgenes were used for normalization of samples. (TIF)
S4 Fig. Secondary common structures among theMIR503HG2isoform from human and the similar ones found in other species.The circulated areas represent the most similar sub-structure localized in the last exon. The secondary sub-structure was obtained through RNAstruc-ture (http://rna.urmc.rochester.edu/RNAstructureWeb/) using the algorithm TurboFold. (TIF)
S5 Fig. Percentage of cells in S phase afterMIR503HG2orLINC00269overexpression in the JEG-3 cell line.After 48 hours from transfection, cells were fixed with ice-cold absolute ethanol overnight, added to RNAse A and PI and analyzed in FACS Calibur flow cytometer. pLVX: empty expression vector.
(TIFF)
Acknowledgments
We thank Adriana Aparecida Marques and Cristiane Ayres Ferreira for the technical support. This work was funding by The National Counsel of Technological and Scientific Development (CNPq), grant #573754/2008-0 and #131371/2011-8; by grants #2011/04154-7 and #2013/ 08135-2, São Paulo Research Foundation (FAPESP); and by Research Support of the University of Sao Paulo, CISBi-NAP/USP #12.1.25441.01.2.
Author Contributions
Conceived and designed the experiments: BRM WAS. Performed the experiments: BRM ARDS. Analyzed the data: BRM JCCL DLZ RBLB LFA CPA AR GAM WASJ DOV.
Contributed reagents/materials/analysis tools: BRM JCCL DLZ RBLB LFA CPA AR GAM WASJ DOV. Wrote the paper: BRM JCCL DLZ RBLB LFA CPA AR GAM WASJ DOV.
References
1. Hurst L, Randerson JP. An exceptional chromosome. Trends Genet. 1999; 15(10):383–85. PMID: 10498931
2. Fant M, Farina A, Nagaraja R, Schlessinger D.PLAC1(placenta specific 1): a novel, X-linked gene with
roles in reproductive and cancer biology. Prenatal Diag. 2010; (30: ):497–502.
3. Jackman SM, Kong X, Fant ME. Plac1 (Placenta-specific 1) is essential for normal placental and embryonic development. Mol Reprod Dev. 2012; 79 (8):564–72. doi:10.1002/mrd.22062PMID: 22729990
4. Silva WA Jr, Gnjatic S, Ritter E, Chua R, Cohen T, Hsu M, et al. PLAC1, a trophoblast specific cell-sur-face protein, is expressed in a range of human tumors and elicits spontaneous antibody responses. Cancer Immun. 2007; 7:18–27. PMID:17983203
5. Koslowski M, Sahin U, Mitnacht-Kraus R, Seitz G, Huber C, Türeci Ö. A placenta-specific gene ectopi-cally activated in many human cancers is essentially involved in malignant cell processes. Cancer Res. 2007; 67(19):9528–34. PMID:17909063
6. Geisler S, Coller J. RNA in unexpected places: long non-coding RNA functions in diverse cellular con-texts. Nat Rev Mol Cell Biol. 2013; (14: ):699–12.
7. Moran VA, Perera RJ, Khalil AM. Emerging functional and mechanistic paradigms of mammalian long non-coding RNAs. Nucleic Acids Res. 2012; (14: ):6391–00. doi:10.1093/nar/gks296PMID:22492512 8. Simpson AJG, Caballero OL, Jungbluth A, Chen YT, Old LJ. Cancer/testis antigens, gametogenesis
and cancer. Nat Rev Cancer. 2005; 5(8):615–25. PMID:16034368
9. Ferretti C, Bruni L, Dangles-MArie V, Pecking A P, Bellet D. Molecular circuits shared by placental and cancer cells, and their implications in the proliferative, invasive and migratory capacities of tropho-blasts. Hum Reprod Update. 2007; 13(2):121–41. PMID:17068222
10. Soundararajan R, Rao AJ. Trophoblast 'pseudo-tumorigenesis': Significance and contributory factors. Reprod Biol Endocrinol. 2004; (2: ):15.
11. Sasaki Y T, Sano M, Ideue T, Kin T, Asai K, Hirose T. Identification and characterization of human non-coding RNAs with tissue-specific expression. Biochem Biophys Res Commun. 2007; 357(4):991–96. PMID:17451645
12. Cabili M N, Trapnell C, Goff L, Koziol M, Tazon-Vega B, Regev A,et al. (2011). Integrative annotation of human large intergenic noncoding RNAs reveals global properties and specific subclasses. Genes Dev. 2011; 25(18):1915–27. doi:10.1101/gad.17446611PMID:21890647
13. Takada S, Berezikov E, Yamashita Y, Lagos-Quintana M, Kloosterman WP, Enomoto M, et al. Mouse microRNA profiles determined with a new and sensitive cloning method. Nucleic Acids Res. 2006; 34 (17):e115. PMID:16973894
14. Donker RB, Mouillet JF, Chu T, Stolz DB, Morelli AE, Sadovsky Y. The expression profile of C19MC microRNAs in primary human trophoblast cells and exosomes. Mol Hum Reprod. 2012; (18: ) 8:417– 24.
15. Fiedler J, Breckwoldt K, Remmele CW, Hartmann D, Dittrich M, Pfanne A, et al. Development of Long Noncoding RNA-Based Strategies to Modulate Tissue Vascularization. J Am Coll Cardiol. 2015; 66 (18):2005–15. doi:10.1016/j.jacc.2015.07.081PMID:26516004
16. Li N, Zhang F, Li S, Zhou S. Epigenetic silencing of MicroRNA-503 regulates FANCA expression in non-small cell lung cancer cell. Biochem Biophys Res Commun. 2014; 444(4):611–16. doi:10.1016/j. bbrc.2014.01.103PMID:24486548
17. Esteller M. Relevance of DNA methylation in the management of cancer. Lancet Oncol. 2003; (6: ):351–58. PMID:12788407
18. Nagaraj SH, Gasser RB, Ranganathan S. A hitchhiker's guide to expressed sequence tag (EST) analy-sis. Brief Bioinform. 2007; 8(1):6–PMID:16772268
19. Torarinsson E, Sawera M, Havgaard JH, Fredholm M, Gorodkin J. Thousands of corresponding human and mouse genomic regions unalignable in primary sequence contain common RNA structure. Genome Res. 2006; 16(7):885–89. PMID:16751343
20. Necsulea A, Soumillon M, Warnefors M, Liechti A, Daish T, Zeller U, et al. The evolution of lncRNA rep-ertoires and expression patterns in tetrapods. Nature. 2014; 505(7485):635–40. doi:10.1038/ nature12943PMID:24463510
21. Tam W. Identification and characterization of human BIC, a gene on chromosome 21 that encodes a noncoding RNA. Gene 2001; (274: ):157–67.
22. Cabili MN, Dunagin MC, McClanahan PD, Biaesch A, Padovan-Merhar O, Regev A, et al. Localization and abundance analysis of human lncRNAs at single cell and single-molecule resolution. Genome Biol. 2015; Jan 29; 16:20. doi:10.1186/s13059-015-0586-4PMID:25630241
23. Bergmann JH, Spector DL. Long non-coding RNAs: modulators of nuclear structure and function. Curr Opin Cell Biol. 2014; (26: ):10–8.
24. Frommer M, McDonald LE, Millar DS, Collis CM, Watt F, Grigg GW, et al. A genomic sequencing proto-col that yields a positive display of 5-methylcytosine residues in individual DNA strands. Proc Nat. Acad Sci USA. 1992; 89(5):1827–31. PMID:1542678
25. Wojdacz TK, Dobrovic A. Methylation-sensitive high resolution melting (MS-HRM): a new approach for sensitive and high-throughput assessment of methylation. Nucleic Acids Res. 2007; 35(6): e41. PMID: 17289753
26. Kent WJ. BLAT- The BLAST-like alignment tool. Genome Res. 2002; (4: ):656–64. PMID:11932250 27. Altschul SF, Gish W, Miller W, Myers EW, Lipman DJ. Basic local alignment search tool. J Mol Biol.
1990; 215:403–10. PMID:2231712
28. Pruitt KD, Tatusova T, Maglott DR. NCBI reference sequences (RefSeq): a curated non-redundant sequence database of genomes, transcripts and proteins. Nucleic Acids Res. 2005; (33: ):501–04.
29. Harmanci AO, Sharma G, Mathews DH. TurboFold: Iterative probabilistic estimation of secondary structures for multiple RNA sequences. BMC Bioinformatics. 2011; 12:108. doi: 10.1186/1471-2105-12-108PMID:21507242