Biomarkers in Parkinson Disease: global gene expression
analysis in peripheral blood from patients with and without
mutations in
PARK2
and
PARK8
Biomarcadores na doença de Parkinson: avaliação da expressão gênica no sangue periférico de
pacientes com e sem mutações nos genes
PARK2
e
PARK8
Patricia Maria de Carvalho Aguiar1, Patricia Severino2
ABSTRACT
Objective: To evaluate the performance of gene expression analysis in the peripheral blood of Parkinson disease patients with different genetic profiles using microarray as a tool to identify possible diseases related biomarkers which could contribute to the elucidation of the pathological process, as well as be useful in diagnosis. Methods: Global gene expression analysis by means of DNA microarrays was performed in peripheral blood of Parkinson disease patients with previously identified mutations in PARK2 or PARK8
genes, Parkinson disease patients without known mutations in these genes and normal controls. Each group consisted of five individuals. Results: Global gene expression profiles were heterogeneous among patients and controls, and it was not possible to detect a consistent pattern between groups. However, analyzing genes with differential expression of p < 0.005 and fold change ≥ 1.2, we were able to identify a small group of well-annotated genes. Conclusions: Despite the small sample size, the identification of differentially expressed genes suggests that the microarray technique may be useful in identifying potential biomarkers in the peripheral blood of Parkinson disease patients or in people at risk of developing the disease. This will be important once neuroprotective therapies become available, and may contribute to the identification of new pathways involved in the disease physiopathology. Results presented here should be further validated in larger groups of patients.
Keywords: Parkinson disease/blood; Parkinson disease/genetics; Biological markers/blood; Gene expression; Mutation
RESUMO
Objetivo: Avaliar a viabilidade da análise da expressão gênica por
microarray no sangue periférico de pacientes com doença de Parkinson com diferentes perfis genéticos, para a identificação de marcadores que possam estar relacionados ao desenvolvimento da doença ou que possam se tornar úteis para o seu o diagnóstico. Métodos: Foram selecionados pacientes portadores de mutações nos genes PARK2 ou PARK8, além de parkinsonianos não-portadores dessas mutações e controles sadios, sendo cinco pessoas em cada grupo. A expressão gênica global foi analisada por microarray com RNA extraído do sangue periférico desses pacientes. Resultados: O perfil de expressão global apresentou grande heterogeneidade entre os pacientes, não sendo possível identificar um padrão diferencial entre os grupos. No entanto, utilizando como critérios de seleção p < 0,005 e fold-change ≥ 1,2, observamos expressão diferencial de alguns genes específicos entre os diferentes grupos estudados. Conclusões: A detecção de expressão diferencial de alguns genes sugere que a técnica pode vir a ser útil na identificação de marcadores em sangue periférico que possam caracterizar pessoas com risco de desenvolver doença de Parkinson, o que será importante, uma vez que terapias neutroprotetoras se tornem disponíveis, bem como auxiliará na elucidação da fisiopatologia da doença, identificando novas vias de sinalização que possam estar comprometidas. Esses achados deverão ainda ser confirmados por novos estudos com ampliação das amostras e testes para validação dos genes identificados.
Descritores: Doença de Parkinson/sangue; Doença de Parkinson/ genética; Marcadores biológicos/sangue; Expressão gênica; Mutação
Study carried out at Laboratory of Experimental Research of Instituto Israelita de Ensino e Pesquisa Albert Einstein – IIEPAE; Movement Disorders Clinic, Universidade Federal de São Paulo – UNIFESP, São Paulo (SP), Brazil.
1 PhD; Researcher at Instituto Israelita de Ensino e Pesquisa Albert Einstein – IIEPAE; Department of Neurology and Neurosurgery of Universidade Federal de São Paulo – UNIFESP, São Paulo (SP), Brazil. 2 PhD; Researcher at Instituto Israelita de Ensino e Pesquisa Albert Einstein – IIEPAE, São Paulo (SP), Brazil.
Corresponding author: Patricia Maria de Carvalho Aguiar – Avenida Albert Einstein, 627 – 2º subsolo – bloco A – Morumbi – CEP 05652-900 – São Paulo (SP), Brasil – Tel.: 11 3747-1366 – e-mail: [email protected]
Received on Feb 27, 2010 – Accepted on Jun 9, 2010
Conflict of interest:
INTRODUCTION
Parkinson disease (PD) is the second most common neurodegenerative disease. Its etiology is multifactoral, involving both genetic and environmental factors. Even though patients with a clearly genetic etiology are not the most common ones, finding genes related to PD has contributed to clarifying the disease physiopathology, making it possible to reveal the series of events related to the neurodegenerative process, and to find out how environmental factors might be interacting with the genetic factors, leading to neuronal death(1).
Over the last years, a number of genes related to PD have been identified, including SNCA ( alpha-synuclein), PARK2 (Parkin), PARK5 (UCHL1), PARK6 (PINK1), PARK7 (DJ1), PARK8 (LRRK2), and PARK9 (ATP13A2). Among these, mutations are most frequently found in genes PARK2 in those cases with autosomal recessive inheritance, and PARK8 in cases with autosomal dominant inheritance. Mutations in PARK2 are predominantly related to early-onset PD (before 50 years old). Mutations in PARK8 were initially described in patients whose disease manifestation started after 50 years old, but recent reports have described these mutations in patients with earlier onset(2). Although PARK2 was initially
thought to be of autosomal recessive inheritance, there is an increasing number of reports on PD cases with a single mutation in this gene; therefore, it has been discussed whether a single mutant allele could be only a risk factor or a causal factor for PD(3). Our
preliminary results showed that, in the Brazilian population, mutations in PARK2 or PARK8 are associated with 18% of early-onset PD cases(2).
It is very likely that different genetic causes of parkinsonism are connected by common metabolic pathways. The functions and interactions of the proteins produced by these genes are not yet completely clear, but a few reports state that mutations in these lead to dysfunctions in the ubiquitin-proteasome pathway (UP) and/or to a higher susceptibility to oxidative stress(4,5). Functional studies using cell culture showed
that there is an interaction between the gene products of PARK2 (Parkin) and PARK8 (LRRK2). Parkin is an E3 ubiquitin-ligase and LRRK2 is a kinase. Apparently, they interact through the RING2 parkin domain(5). The
protein synphilin-1, found in Lewy bodies, is known to interact with parkin, but a series of other substrates connected to these proteins and to the UP pathway are still unknown.
Currently, no curative treatment is provided for PD, and it is not possible to prevent its progression. The neurodegenerative process begins long before the first clinical manifestations arise. It is estimated that,
by the onset of the first symptoms, a loss of 75% of the population of dopaminergic neurons in the substantia nigra pars compacta, one of the main affected regions in PD, has already been established. The exact moment in lifetime when this process starts is so far unknown. A presymptomatic diagnosis of these individuals would be of great value, not only for a better understanding of the disease’s pathophysiology, but also for providing early treatment when neuroprotective therapies become available.
Finding biomarkers for PD could greatly benefit the identification of patients at risk of developing the disease, their diagnosis and progression follow-up. Moreover, the detection of novel pathways involved in the neurodegenerative process could enable the identification of new potential therapeutic targets.
One of the main difficulties in finding good biomarkers for PD is the fact that its manifestations occur predominantly in the central nervous system (CNS), a tissue not easily accessible in living persons. Recent studies have shown major modifications in gene expression in the substantia nigra of patients with PD(6-8). However, for molecular markers to
have a clinical application, it is desirable that they be identified by methods which are not too invasive such as in peripheral blood. Even though the cardinal signs of PD are related to the degeneration of CNS cells, pro-apoptotic modifications and alterations in the activity of the up system, possibly related to caspase activation, was observed in peripheral blood leukocytes of patients(9,10). It was also observed that peripheral
blood leukocytes can be used to study modifications in the receptor and neurotransmitter systems of some neurodegenerative diseases. In PD, a reduction in the immunoreactivity of the dopamin transporter (DAT) was observed in peripheral blood leukocytes(11). A recent
study performed with microarrays identified molecular markers of early-onset PD in peripheral blood(12). The
utilization of DNA microarrays provides information on the expression of thousands of genes in parallel, thus enabling a fast screening for possible biomarkers. Therefore, performing gene expression studies in PD patients with characterized mutations might potentially provide more data on genes and proteins that are associated with the neurodegenerative process.
OBJECTIVES
available in the literature, so as to contribute to the validation of the already described biomarkers and to evaluate the use of this kind of approach in the identification of markers of interest.
METHODS Sample
Fifteen patients with PD were selected from the movement disorders outpatient clinic of the Department of Neurology and Neurosurgery of Universidade Federal de São Paulo (UNIFESP), clinically diagnosed according to the UK Parkinson’s Disease Society Brain Bank criteria. This study was approved by the Institutional Ethics Committee, and all participants signed an informed consent form. Ten of the patients were carriers of previously identified mutations in PARK2 or PARK8 genes (five in each group)(2), while five
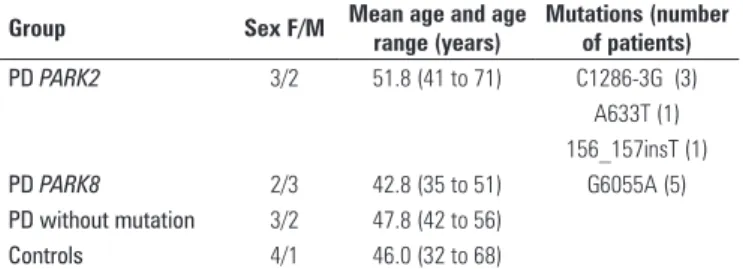
patients had no mutation in these genes. Five healthy controls matched by gender and age were enrolled for comparison with the PD patient group. The mutations in genes PARK2 and PARK8 were investigated according to previously published criteria(2). The characteristics of
these individuals are presented in table 1.
sample was individually labeled and hybridized in one array. A total of 20 hybridizations were performed, one for each subject of the study.
The platform chosen was Affymetrix® (Santa Clara,
California, USA), and the microarray was Affymetrix Human Gene 1.0 st. This slide evaluates 28,969 genes, each represented by approximately 26 probes distributed along the gene. All the experiments were carried out according to the manufacturer’s instructions and are briefly described below.
cDNA synthesis and cRNA labeling
The protocol began with the synthesis and labeling of cDNA from RNA, using a GeneChip Whole Transcript Sense Target Labelling Assay (Affymetrix®
– Santa Clara, California, USA) kit. To start the assay, 100 ng of total RNA were used, according to the manufacturer’s instructions. For the synthesis of double-stranded cDNA, we used random hexamers containing a T7 promoter sequence. This material was amplified by T7 RNA polymerase, generating antisense cRNA copies. In a second cDNA synthesis cycle, random hexamers were used as initiators for reverse transcription of the cRNA obtained in the first cycle. This step produced sense single-stranded DNA that was labeled with a specific reagent (Affymetrix®
proprietary DNA Labeling Reagent) covalently bonded to biotin by deoxynucleotidyl transferase (TdT). For the initial procedures, we used a WT cDNA Synthesis and Amplification (Affymetrix®) kit. This kit was used
for cDNA synthesis both in the first and in the second cycle, and also for the linear amplification procedures through in vitro transcription. Once these procedures were completed, the single-stranded DNA generated was fragmented and labeled with the GeneChip® WT Terminal Labeling kit.
Hybridization and data acquisition
The GeneChip Hybridization, Wash and Stain Kit (Affymetrix®) was used to prepare the hybridization
solutions and wash the slides. The synthesized cDNA samples and the labeled RNA samples were hybridized on the Human Gene 1.0 st (Affymetrix®) slide. One slide
per selected patient was used in this study. The slides were incubated in a chamber at 45°C, submitted to 60 rotations per minute for 17 hours, and then washed using adequate buffers. Image acquisition from the slides was performed with a GeneChip® Scanner 3000 7G – controlled by the
GeneChip® Operating Software (GCOS).
Gene expression quantification and data analysis
The generated data were normalized by Robust Multichip Analysis (RMA) with the Expression Console Table 1. Clinical and molecular characteristics of patients and controls
Group Sex F/M Mean age and age range (years)
Mutations (number of patients) PD PARK2 3/2 51.8 (41 to 71) C1286-3G (3)
A633T (1) 156_157insT (1)
PD PARK8 2/3 42.8 (35 to 51) G6055A (5)
PD without mutation 3/2 47.8 (42 to 56)
Controls 4/1 46.0 (32 to 68)
F: female; M: male; PD: Parkinson disease.
Gene expression analysis RNA extraction
Gene expression analysis was performed in RNA extracted from 2.5 ml of peripheral blood using the PAXgene™ Blood RNA System (PreAnalytiX GmbH, Germany), according to the manufacturer’s instructions. The RNA of all individuals were randomly extracted on the same day at different moments. The quality and concentration of the obtained RNA was assessed with the Agilent 2100 Electrophoresis Bioanalyser (Agilent Technologies) equipment.
Microarray platform and experimental design
program (Affymetrix®), using the RMA parameters
background correction, quantile normalization and mean summarization.
The Principal Component Analysis (PCA) was used to assess the main sources of variation in gene expression among distinct samples. The identification of differentially expressed genes among groups of patient samples was performed by means of ANOVA test. These analyses were made using the Partek® version 6.4 software
(Copyright© 2009 Partek Inc., St. Louis, MO, USA).
RESULTS
This study aimed to identify, in peripheral blood, alterations in the expression of genes possibly related to the development of PD in individuals carrying specific mutations in PARK2 or PARK8 compared to PD patients without mutations in these genes and to normal controls. As presented in detail below, a great variability was observed among the samples studied regarding global gene expression, and a pattern differentiating these patients in a clear-cut manner could not be identified. On the other hand, the expression of some genes was altered among patients’ groups and pointed out the possible role of these genes in PD.
Global gene expression patterns
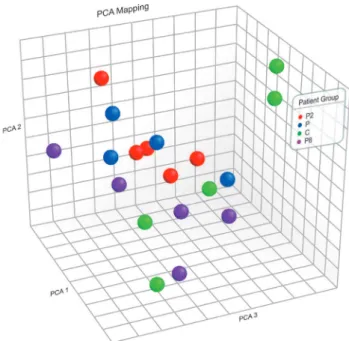
Initially, the global gene expression profile of the selected samples was assessed. For this purpose, principal variation component analysis (PCA) was used in this set of data (Figure 1). PCA pointed out that the samples presented a very pronounced expression variation. In peripheral blood, the presence of the mutations showed no significant global impact that could be identified on a total genomic level.
Investigation of genes differentially expressed in the patient groups
Since there was no global gene expression pattern reflecting the differences between the groups that were analyzed, differences in the expression of specific genes which might play a significant role in the development of PD were investigated. Firstly, a small group of well-annotated genes displaying differential expression in the three groups (parkinsonians and healthy individuals) was identified when we used p < 0.005 and a fold-change ≥
1.2 as selection criteria. The same criteria were used to search for genes differentially expressed between the differrent groups, two by two. The ten genes presenting a differential expression with higher statistical significance per analyzed group are pointed out in tables 2 to 6. The choice of the criteria for selecting the differentially
Table 2. Relation of differentially expressed genes among samples of parkinsonians and healthy individuals
Gene RefSeq Fold-change*
TRIM24 NM_015905 1.20
RUFY1 NM_025158 1.38
RICS NM_001142685 1.20
PLCL1 NM_001114661 1.36
NOG NM_005450 1.53
PAIP2B NM_020459 1.27
NUDC NM_006600 1.20
CDR2 NM_001802 1.26
DSC1 NM_024421 1.36
DNM3 NM_015569 1.32
*Fold-change: ratio between intensity of gene expression in parkinsonians compared to healthy individuals (negative numbers indicate greater expression in parkinsonians). This table includes only the genes presenting p < 0.005 and fold-change ≥ 1.2.
Table 3. List of differentially expressed genes among parkinsonians without mutations in PARK2 or PARK8 and healthy individuals
Gene RefSeq Fold-change*
CACHD1 NM_020925 1.20
TRIM24 NM_015905 1.21
PEA15 NM_003768 1.22
RICS NM_001142685 1.22
SORCS3 NM_014978 1.22
TMEM173 NM_198282 1.27
SDHC NM_003001 1.28
ARRB1 NM_004041 1.30
RUFY1 NM_025158 1.39
SIDT2 NM_001040455 1.43
*Fold-change: ratio between intensity of gene expression in parkinsonians without PARK2 or PARK8 mutations and healthy individuals (negative numbers indicate greater expression in parkinsonians). This table includes only the genes presenting p < 0.005 and fold-change ≥ 1.2.
Figure 1. PCA showing the projection of gene expression values obtained by microarrays. Each dot represents the gene expression of one sample. Each color represents one type of sample. Blue: parkinsonians without mutation in PARK2
or PARK8; red: patients carrying mutation in PARK2; purple: patients carriers of
Table 4. List of differentially expressed genes among PARK8 mutation carriers and healthy individuals
Gene RefSeq Fold-change*
TRIM24 NM_015905 1.20
LRRC47 NM_020710 1.20
PPYR1 NM_005972 1.20
LTA NM_001159740 1.21
B3GALTL NM_194318 1.21
IKZF2 NM_016260 1.40
FMN1 NM_001103184 1.86
OCR1 AF314543 -1.74
ARG1 NM_000045 -1.63
SLC26A8 NM_052961 -1.61
*Fold-change: ratio between intensity of gene expression in PARK8 mutation carriers and healthy individuals (negative numbers indicate greater expression in PARK8 mutation carriers). This table includes only the genes presenting p < 0.005 and fold-change ≥ 1.2.
Table 5. List of differentially expressed genes among PARK2 mutation carriers and healthy individuals
Gene RefSeq Fold-change*
KLHL32 NM_052904 1.20
OR13G1 NM_001005487 1.20
RICS NM_001142685 1.20
RABGEF1 NM_014504 1.20
PTK2 NM_153831 1.20
PTX3 NM_002852 1.22
TRIM24 NM_015905 1.23
NUDC NM_006600 1.23
GCOM1 NM_001018100 1.23
ARHGAP21 NM_020824 1.25
*Fold-change: ratio between intensity of gene expression in PARK2 mutation carriers and healthy individuals (negative numbers indicate greater expression in PARK2 mutation carriers). This table includes only the genes presenting p < 0.005 and fold-change ≥ 1.2.
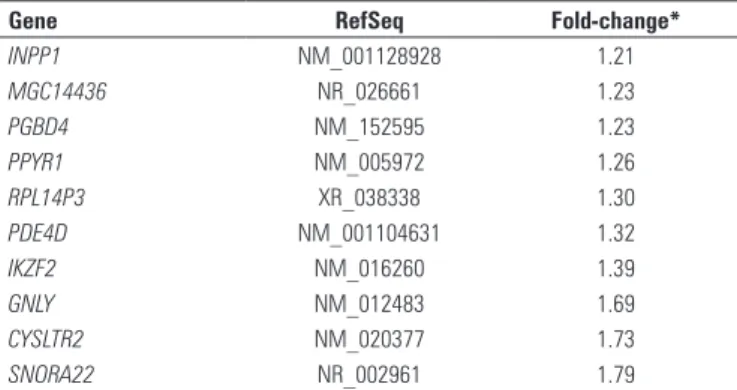
Table 6. List of differentially expressed genes among of PARK2 versus PARK8 mutation carriers
Gene RefSeq Fold-change*
INPP1 NM_001128928 1.21
MGC14436 NR_026661 1.23
PGBD4 NM_152595 1.23
PPYR1 NM_005972 1.26
RPL14P3 XR_038338 1.30
PDE4D NM_001104631 1.32
IKZF2 NM_016260 1.39
GNLY NM_012483 1.69
CYSLTR2 NM_020377 1.73
SNORA22 NR_002961 1.79
*Fold-change: ratio between intensity of gene expression in PARK2 mutation carriers and PARK8 mutation carriers (negative numbers indicate greater expression in PARK8 mutation carriers). This table includes only the genes presenting p < 0.005 and fold-change ≥ 1.2.
expressed genes took into consideration the great heterogeneity among the samples.
DISCUSSION
The microarray technology has been changing the traditional manner of conducting research because it allows relevant questions to be addressed through an integral perspective, favoring new paradigms. Microarrays allow the simultaneous evaluation of
the expression of thousands of genes, having been largely employed in experiments designed to study the functions and interactions of genes within a global context. A central question in this study is the application of microarrays for a better understanding of the biology of PD. With this strategy, one can infer, for example, activated or inactivated signaling pathways in patients with particular genetic characteristics. Since this kind of approach establishes associations between the genome and biological processes involved in phenotype manifestation, this technology produces new hypotheses that will require testing in further studies using more targeted approaches.
The evaluation of the global gene expression patterns in the 20 samples was unable to segregate parkinsonians from healthy individuals, or to distinguish patients carrying specific mutations, which suggests that the global effects of these mutations in peripheral blood are modest compared to the general gene expression variability of the studied material. This variability in gene expression represents a combination between a methodological variability and the biological variation inherent to the selected patients.
Among the methodological variables, the nature of the chosen assay – gene expression analysis by microarrays – brings about a rather large number of steps which add variables to the analysis. Among these steps, the processes of sample collection and storing, RNA extraction, and the experimental array hybridization protocol stand out. Regarding the array hybridization protocol, all precautions were taken to reduce the experimental variability, particularly in selecting samples with similar RNA quality, randomizing the order of the hybridized samples in the arrays, and performing the experimental steps with all samples on the same day. Thus, it can be assured that the differences observed are inherent to the analyzed samples, and may be of a biological nature. Although the common final pathway of PD is neuronal degeneration, mainly with regard to the dopaminergic neurons of the substantia nigra pars compacta, from the clinical point of view, there is a great difficulty in obtaining a homogeneous group of patients, because they differ from each other regarding their symptoms, therapeutic schedule and disease age of onset, among other aspects.
TRIM24 encodes a nuclear localization protein involved in the transcription control of some nuclear receptors, among other functions. Recently, protein TRIM24 was found to have protein p53 as target(13). This protein is involved in several cellular
processes, among which one of greatest interest to neurodegenerative diseases is the control of the apoptosis and autophagia mechanisms. In the CNS, in the presence of cytotoxicity or ischemia, an increase of the levels of p53 and apoptosis are observed(14).
TRIM24 acts negatively as a p53 regulator. Some studies in animal models showed that a depletion of TRIM24 can lead to p53-induced apoptosis(13).
There are a number of studies demonstrating that p53 levels are increased in some regions of the CNS of patients with neurodegenerative diseases, such as Alzheimer’s disease, PD and amyotrophic lateral sclerosis(14). Oxidative stress is one of the factors
which are likely to contribute to PD. In the presence of DNA damage, which may occur, for example, in situations of oxidative stress, p53-induced apoptosis occurs(14). Recently, it was observed that the protein
parkin, encoded by gene PARK2 (which is related to one of the forms of familiar PD), is a repressor of p53 transcription(15). Protein TRIM24 has not yet been
directly correlated to the physiopathology of PD, but we found that its gene has a reduced expression in the peripheral blood of parkinsonians. This finding in particular, if confirmed in a larger sample of PD patients, and if the gene expression is validated by real-time PCR, can illustrate how the microarray technique used in peripheral blood cells can help us to identify biomarkers, novel pathways involved in the physiopathology of PD, and even in the identification of possible therapeutic targets.
This study was focused on analyzing the gene expression profile of patients with and without mutations related to PD, verifying whether less invasive methods such as peripheral blood analyses could contribute to the identification of biomarkers and the elucidation of the disease physiopathology. We hypothesized that the gene expression pattern could show peculiarities associated with the presence of such mutations. The assessment of the global gene expression patterns of the samples was unable to segregate patients based on these criteria, suggesting that their global effects on gene expression are modest compared to the general variability in gene expression of the studied material. However, the investigation of differential expression of specific genes can help inferring distinct mechanisms among groups of patients, thus contributing to a better understanding of the pathophysiology of PD.
CONCLUSIONS
The small number of studied samples did not allow definitive conclusions, suggesting, however, that specific molecular alterations may be found among patients with PD who carry mutations with distinct functional modifications, and that they also present some alterations in common with patients without mutations. The challenge posed by this kind of study lies mainly in the selection of homogeneous samples regarding the clinical-pathological characteristics, so as to allow a consistent evaluation of the impact of the mutation on the development of the disease.
Based on the preliminary data obtained in this pilot study, a second project shall be designed with a larger number of patients and controls, in order to validate these genes using the real-time PCR technique. Once the differential expression of some of these genes is confirmed in a larger group of parkinsonians, functional studies of some of the proteins they encode shall be initiated in order to elucidate their role in PD and investigate their potential as biomarkers of the disease.
ACKNOWLEDGMENTS
We thank all patients and volunteers who took part in this study. This work was financially supported by CNPq (473640/2007-4).
REFERENCES
1. Klein C, Schlossmacher MG. Parkinson disease, 10 years after its genetic revolution: multiple clues to a complex disorder. Neurology. 2007;69(22):2093-104.
2. Aguiar Pde C, Lessa PS, Godeiro C Jr, Barsottini O, Felício AC, Borges V, et al. Genetic and environmental findings in early-onset Parkinsons disease Brazilian patients. Mov Disord. 2008;23(9):1228-33.
3. Klein C, Lohmann-Hedrich K, Rogaeva E, Schlossmacher MG, Lang AE. Deciphering the role of heterozygous mutations in genes associated with parkinsonism. Lancet Neurol. 2007;6(7):652-62.
4. Moore DJ, West AB, Dawson VL, Dawson TM. Molecular pathophysiology of Parkinsons disease. Annu Rev Neurosci. 2005;28:57-87.
5. Smith WW, Pei Z, Jiang H, Moore DJ, Liang Y, West AB, et al. Leucine-rich repeat kinase 2 (LRRK2) interacts with parkin, and mutant LRRK2 induces neuronal degeneration. Proc Natl Acad Sci U S A. 2005;102(51):18676-81. 6. Duke DC, Moran LB, Kalaitzakis ME, Deprez M, Dexter DT, Pearce RK, et al.
Transcriptome analysis reveals link between proteasomal and mitochondrial pathways in Parkinsons disease. Neurogenetics. 2006;7(3):139-48. 7. Hauser MA, Li YJ, Xu H, Noureddine MA, Shao YS, Gullans SR, et al.
Expression profiling of substantia nigra in Parkinson disease, progressive supranuclear palsy, and frontotemporal dementia with parkinsonism. Arch Neurol. 2005;62(6):917-21.
9. Blandini F, Cosentino M, Mangiagalli A, Marino F, Samuele A, Rasini E, et al. Modifications of apoptosis-related protein levels in lymphocytes of patients with Parkinsons disease. The effect of dopaminergic treatment. J Neural Transm. 2004;111(8):1017-30.
10. Blandini F, Sinforiani E, Pacchetti C, Samuele A, Bazzini E, Zangaglia R, et al. Peripheral proteasome and caspase activity in Parkinson disease and Alzheimer disease. Neurology. 2006;66(4):529-34.
11. Pellicano C, Buttarelli FR, Circella A, Tiple D, Giovannelli M, Benincasa D, et al. Dopamine transporter immunoreactivity in peripheral blood lymphocytes discriminates Parkinsons disease from essential tremor. J Neural Transm. 2007;114(7):935-8.
12. Scherzer CR, Eklund AC, Morse LJ, Liao Z, Locascio JJ, Fefer D, et al. Molecular markers of early Parkinsons disease based on gene expression in blood. Proc Natl Acad Sci U S A. 2007;104(3):955-60.
13. Allton K, Jain AK, Herz HM, Tsai WW, Jung SY, Qin J, et al. Trim24 targets endogenous p53 for degradation. Proc Natl Acad Sci U S A. 2009;106(28):11612-6.
14. Miller FD, Pozniak CD, Walsh GS. Neuronal life and death: an essential role for the p53 family. Cell Death Differ. 2000;7(10):880-8.