R E S E A R C H
Open Access
Kinetic estimated glomerular filtration rate
in critically ill patients: beyond the acute
kidney injury severity classification system
Flávio de Oliveira Marques
1, Saulo Aires Oliveira
1, Priscila Ferreira de Lima e Souza
1, Wandervânia Gomes Nojoza
1,
Maiara da Silva Sena
1, Taynara Muniz Ferreira
1, Bruno Gabriele Costa
2and Alexandre Braga Libório
1,2,3*Abstract
Background:Although significant advances have been achieved in acute kidney injury (AKI) research following its classification, potential pitfalls can be identified in clinical practice. The nonsteady-state (kinetic) estimated glomerular filtration rate (KeGFR) could add clinical and prognostic information in critically ill patients beyond the current AKI classification system.
Methods:This was a retrospective analysis using data from the Multiparameter Intelligent Monitoring in Intensive Care II project. The KeGFR was calculated during the first 7 days of intensive care unit (ICU) stay in 13,284 patients and was correlated with outcomes.
Results:In general, there was not a good agreement between AKI severity and the worst achieved KeGFR. The stepwise reduction in the worst achieved KeGFR conferred an incremental risk of death, rising from 7.0% (KeGFR > 70 ml/min/1.73 m2) to 27.8% (KeGFR < 30 ml/min/1.73 m2). This stepwise increment in mortality remained in each AKI severity stage. For example, patients with AKI stage 3 who maintained KeGFR had a mortality rate of 16.5%, close to those patients with KeGFR < 30 ml/min/1.73 m2 but no AKI; otherwise, mortality increased
to 40% when both AKI stage 3 and KeGFR < 30 ml/min/1.73 m2 were present. In relation to another
outcome—renal replacement therapy (RRT)—patients with the worst achieved KeGFR < 30 ml/min/1.73 m2
and KDIGO stage 1/2 had a rate of RRT of less than 10%. However, this rate was 44% when both AKI stage 3
and a worst KeGFR < 30 ml/min/1.73 m2 were observed. This interaction between AKI and KeGFR was also
present when looking at long-term survival.
Conclusion: Both the AKI classification system and KeGFR are complementary to each other. Assessing both AKI stage and KeGFR can help to identify patients at different risk levels in clinical practice.
Background
Acute kidney injury (AKI) is now recognized as a major public health problem affecting millions of patients worldwide [1]. Critically ill patients are at high risk of developing AKI, with its incidence during intensive care unit (ICU) stay varying from 36% to 67% [2, 3]. During the last few years, acute-onset disturbance of kidney
function has been a subject of avid scientific discussion, which has led to the definition of “acute kidney injury.” AKI identification was based on changes in serum cre-atinine (SCr) compared with baseline levels before the disease onset and changes in diuresis. Scoring systems for AKI quantification have been developed at consensus conferences. These included the RIFLE [4] and AKIN [5] criteria for AKI. Most recently, the AKIN criteria were revised and clarified as the Kidney Disease Improving Global Outcomes (KDIGO) criteria for AKI [6].
Although significant advances have been achieved in AKI research following this classification, potential pit-falls can be identified in clinical practice. Intuitively, the shorter the amount of time during which a determined
* Correspondence:[email protected]
1Medical Sciences Postgraduate Program, Department of Clinical Medicine, Universidade Federal do Ceará, Fortaleza, Ceará, Brazil
2Medical Sciences Postgraduate Program, Universidade de Fortaleza – UNIFOR, Fortaleza, Ceará, Brazil
Full list of author information is available at the end of the article
SCr change occurs, the greater the AKI severity. For ex-ample, going from a SCr of 1 to 1.5 mg/dl within 12 h signifies a worse glomerular filtration rate (GFR) fall than going from a SCr of 1 to 1.5 mg/dl within 48 h (see Additional file 1 for illustrative examples); however, if the same urinary output is maintained in both situations, AKI severity will be classified similarly. Also, even con-sidering the difficulty in ascertaining a baseline SCr, the AKI score systems do not consider previous underlying chronic kidney disease (CKD) and its possible prognostic implications. To exemplify, a patient whose SCr varied from 0.8 to 1.2 mg/dl has the same AKI severity as an-other patient whose variation was from 2 to 3 mg/dl, although the GFR is clearly more severely reduced in the second case. Finally, as suggested by Waikar and Bonventre [7] and demonstrated by our group [8], an SCr kinetic model can be superior to AKI classification systems in patients with previous CKD.
Assessing the GFR is problematic when the SCr is changing quickly. In severe AKI and anuric patients, it is a consensus to consider that the GFR is < 10 ml/min/ 1.73 m2. However, a less reduced GFR may also affect management and impact patient survival. Recently, the nonsteady-state (kinetic) estimated glomerular filtration rate (KeGFR) has been advocated in AKI and renal re-covery assessment [9, 10]. The formula is derived from the initial SCr, the distribution volume, the creatinine production rate, and the quantitative difference between consecutive SCr over a given period. Taking these vari-ables into account, KeGFR yields the measured creatin-ine clearance (CrCl) rate for that period between two SCr measurements. Thus, the KeGFR results in the same interpretation of a measured CrCl level, but without the need for collecting urine and measuring urinary creatin-ine levels. Using this approach, we can estimate the GFR in a determined time interval, regardless of whether Scr is slowly increasing as described in the abovementioned examples, where a patient whose SCr levels increased from 1 to 1.5 mg/dl in 12 h had a worse KeGFR in com-parison with another whose SCr level also increased from 1 to 1.5 mg/dl in 48 h.
In the present study, we hypothesized that a worse KeGFR could add clinical and prognostic information in critically ill patients beyond the current AKI classifica-tion system, mainly regarding the need for renal replace-ment therapy, hospital mortality, and 1-year survival.
Methods
Multiparameter Intelligent Monitoring in Intensive Care II database and data collection
The Multiparameter Intelligent Monitoring in Intensive Care (MIMIC)-II project, maintained by the Massachu-setts Institute of Technology Laboratory for Computa-tional Physiology, contains data on patients hospitalized
in an ICU at Beth Israel Deaconess Medical Center from 2001 to 2008 [11]. The database is freely available so that any researcher who accepts the data use agreement and has attended “protecting human subjects’ training” can apply for permission to access the data. This study was ap-proved by the institutional review boards of Massachusetts Institute of Technology and Beth Israel Deaconess Med-ical Center and was granted a waiver of informed consent. We included all patients with an ICU length of stay (LOS) lasting more than 48 h with at least three SCr measurements taken. Patients with known end-stage renal disease (ESRD), previous renal transplantation, those who underwent renal replacement therapy (RRT) before ICU admission, and those with admission SCr > 4 mg/dl were excluded.
Data collection
All data were extracted from the MIMIC-II database (v2.6) and included demographic information (e.g., age, gender) and clinical information from the admission notes. The following admission data were collected: ad-mission body weight, adad-mission type (elective or emer-gency), care unit type (medical, coronary unit, surgery, or cardiac surgery), sepsis diagnosis as described by Angus et al. [12], admission SCr, and disease severity as assessed by the Simplified Acute Physiology Score (SAPS) II [13] and Sequential Organ Failure Assessment (SOFA) [14] scores. In the first 7 days of ICU stay, we also recorded daily SCr measurements, and the need for vasoactive drugs and mechanical ventilation.
Estimated kinetic glomerular filtration rate
The KeGFR was calculated during the first 7 days of ICU stay according the following equation:
KeGFR¼baseline SCr X eGFR Mean SCr
x 1‐Δ 24xΔSCr
Time hð ÞxMaxΔSCr=day
where eGFR = estimated glomerular filtration rate using baseline SCr, mean SCr = mean of two consecutive SCr measurements, ΔSCr = change in SCr, ΔTime(h) = in-terval in hours between two consecutive SCr mea-surements, and MaxΔSCr/Day = the maximal change (increase) in SCr that can occur per day if renal function is completely lost.
The KeGFR was derived from the initial SCr, the dis-tribution volume, the creatinine production rate, and the quantitative difference between consecutive SCr mea-surements over a given time. We included all SCr levels measured at least 6 h and no more than 48 h apart. KeGFR was calculated by taking each interval between two consecutive creatinine measurements. The volume
of distribution for creatinine does not need to be equated with total body water, but can be expressed as a function of the creatinine production rate. The amount by which a known creatinine production rate can in-crease the creatinine concentration if all excretion has ceased (i.e., near-zero GFR) informs us about the volume of distribution. Since there is only creatinine addition and no subtraction, this situation describes the max-imum increment of SCr in 1 day. To obtain it, we identi-fied 94 patients with anuria and two SCr measurements apart with no RRT in this interval. The mean SCr incre-mental corrected for 24 h was 1.47 ± 0.44 mg/dl for men and 1.41 ± 0.49 mg/dl for women. We used these values instead of a fixed value of 1.7 mg/dl per day, as de-scribed by Chen [9].The other necessary variables for this formula included baseline SCr. Because the MIMIC-II does not provide any laboratory information prior to ICU admission, the lowest SCr available during ICU stay before RRT initiation was used as the baseline renal function and baseline CrCl was calculated using the CKD-EPI formula [15]. Any SCr measurement after RRT was not considered. After that, to exclude any influence from previous CKD or out-of-ICU-acquired AKI, we performed a complete sensi-tivity analysis using only patients admitted to the ICU with an eGFR > 70 ml/min/1.73 m2.
AKI definition
AKI was defined according to the KDIGO criteria [6]. We classified patients based on the KDIGO maximum stage achieved within the first 7 days of ICU stay. Be-cause we used RRT as an outcome, we did not apply it as a rule to patients that commenced RRT before achiev-ing AKI stage 3. Urinary output was collected in fixed blocks of 6 h beginning at ICU admission. To be accept-able, the maximum gap between two actual values was 3 h. To stage a patient based on urine output (UO), a minimum of 6 h of data were required. Since Kellum et al. [16] have recently described that the risk of death over the index hospital stay and over the following year is greatest for patients that meet both UO and SCr cri-teria for AKI, and to exclude the fact that KeGFR is the only other approach to describe SCr increment, we per-formed a second sensitivity analysis with SCr-based KDIGO criteria only.
Estimated GFR using steady-state SCr formula
Although KeGFR theoretically provides better estimation of GFR than formulae that were developed to be used with steady-state SCr, we evaluated the capacity of the most recently proposed formula (CKD-EPI) [15] using the highest SCr during the first 7 days of ICU stay to predict the main outcomes.
Outcomes
Patient outcomes included the need for RRT during ICU stay, hospital mortality, and survival up to 1 year.
Statistical analysis
Patients were categorized in groups according to the worst achieved KeGFR. Variables were assessed for nor-mality using the Kolmogorov-Smirnov test. Parametric variables were compared using a ttest and nonparamet-ric variables using the Mann-Whitney test. Categononparamet-rical variables were compared using the chi-square test. We built a logistic regression model to assess the association between categorized KeGFR and hospital mortality ac-cording to each AKI KDIGO stage. We defined a priori that the following variables would be included in the lo-gistic regression model for both outcomes: age, gender, SAPS II score, SOFA score, main comorbidities (hyper-tension, congestive heart failure, cardiac arrhythmias, chronic pulmonary obstructive disease, diabetes mellitus, lymphoma, metastatic cancer, liver disease, obesity), type of admission (clinical or surgical), vasoactive drugs, the need for mechanical ventilation, and baseline eGFR. A Cox model was performed to access survival by AKI se-verity and lowest KeGFR after adjusting for comorbidi-ties, baseline eGFR, and age.
Results
Characteristics of study patients
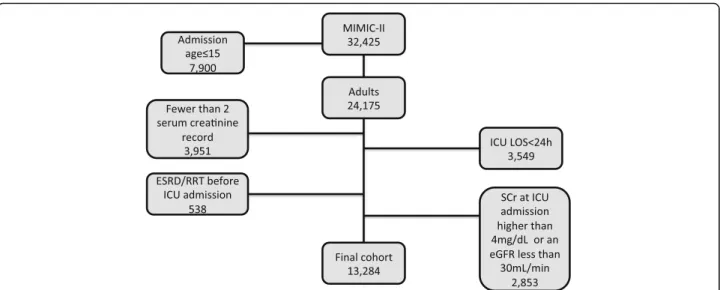
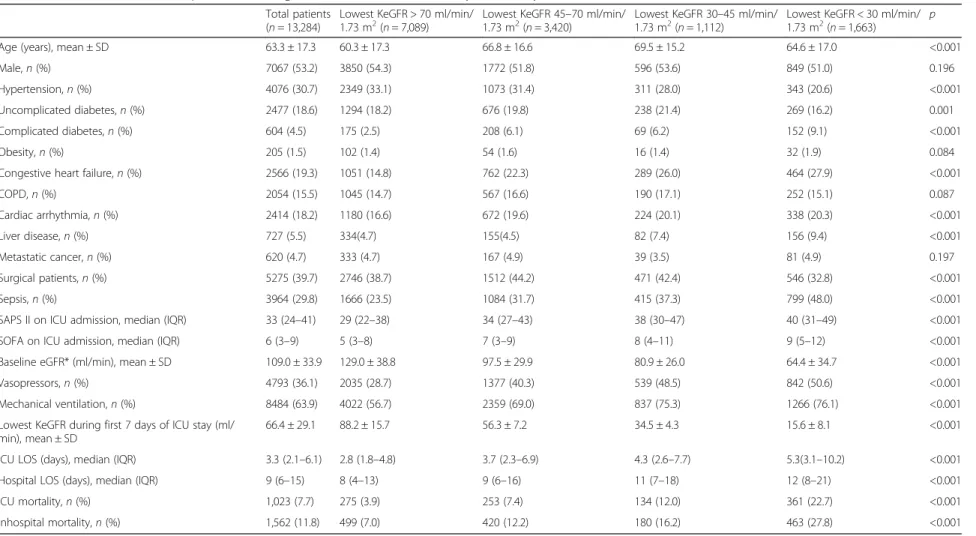
The MIMIC-II database contains the records of 32,425 patients, 24,175 of whom were adults aged > 15 years at the time of admission. Patients with an ICU LOS < 24 hours (n= 3549), those with less than two SCr measurements in a period of 48 h (n= 3951), and patients with ESRD/RRT before the ICU admission (n= 538) were excluded from the analysis. Additionally, patients at ICU admission with an SCr higher than 4 mg/dl (n= 1159) or an eGFR lower than 30 ml/min/1.73 m2 (n= 1694) were also excluded (Fig. 1). After all exclusions, 13,284 patients were eligible to be analyzed. Of the SCr levels used to calculate KeGFR, more than 85% had an interval between them of 20 to 28 h. Table 1 provides baseline characteristics of patients according to the worst KeGFR. Patients with a reduced KeGFR during the first 7 days of ICU stay were more prone to have more comorbidities (except arterial hypertension), more sepsis diagnosis, and were more severely ill.
Main outcomes according to the worst KeGFR
variable (Additional file 2: Figure S1). As shown in Table 1, a stepwise reduction in the worst achieved KeGFR con-ferred an incremental risk of death, rising from 7.0% (KeGFR > 70 ml/min/1.73 m2) to 27.8% (KeGFR < 30 ml/ min/1.73 m2). This association was also observed in the other evaluated outcomes (need for RRT, ICU LOS, and hospital LOS) (Table 1).
Association between the worst achieved KeGFR and AKI stage
The distribution of patients according to AKI stage and the worst KeGFR are shown in Table 2. There was not a good agreement between AKI severity and the worst achieved KeGFR. We identified many patients with AKI according to the KDIGO classification (stages 1–3) but who maintained a KeGFR above 70 ml/min/1.73 m2. Al-though many of these patients achieved maximum KDIGO stage only by the UO criteria, 1008 patients had AKI according to the SCr-based KDIGO classification but no significant reduction in KeGFR (Additional file 3: Table S1). On the other hand, several patients achieved a KeGFR < 45 ml/min/1.73 m2 but had no AKI or had KDIGO AKI stage 1 only. As shown in Table 3, which includes only patients with ICU admission eGFR > 70 ml/min/1.73 m2, this finding cannot be explained only by previous CKD.
Impact of the worst achieved KeGFR on hospital mortality
As previously stated, the hospital mortality rate increases according to the worst achieved KeGFR within the first 7 ICU days. This stepwise increment in mortality remained in each AKI severity stage (Table 2). Roughly, it is also possible to identify an increment in hospital
death when using the KDIGO system within each worse KeGFR range. For example, patients with AKI stage 3 who maintained KeGFR had a mortality rate of 16.5%, close to those patients with KeGFR < 30 ml/min/1.73 m2 but no AKI; otherwise, mortality increased to 40% when both AKI stage 3 and KeGFR < 30 ml/min/1.73 m2were present. For illustrative purposes, we reduced the num-ber of groups based on similar rates of hospital mortality (different colors in Tables 2 and 3 and Additional files 3 and 4: Tables S1 and S2). To rule out the fact that our findings are merely another way to explore the higher mortality rates in patients meeting both UO and sCr cri-teria for AKI [16], we performed a sensitivity analysis using only SCr-based KDIGO criteria against reduced KeGFR (Additional file 3: Table S1). Overall, the results did not change. For further comparison, we evaluated the eGFR using the CKD-EPI formula with the highest SCr. As shown in Additional file 5: Table S3, although there was an increment in mortality according to eGFR, this remained true only in patients with no AKI. There was no stepwise increment in mortality in each AKI se-verity stage 1 through 3 according to eGFR by CKD-EPI. To further explore the association of the worst achieved KeGFR and hospital mortality, we adjusted this association for potential confounders and evaluated the adjusted odds ratio in each AKI stage (Table 4). Again, eGFR by CKD-EPI was independently associated with hospital mortality only in patients with no AKI (Additional file 6: Table S4).
Worst KeGFR and need for RRT
We also evaluated if the worst KeGFR was associated with a need for RRT beyond the KDIGO system during Fig. 1Patient distribution in the MIMIC-II database and exclusion criteria.eGFRestimated glomerular filtration rate,ESRDend-stage renal disease,
ICUintensive care unit,LOSlength of stay,MIMICMultiparameter Intelligent Monitoring in Intensive Care,RRTrenal replacement therapy,
sCrserum creatinine
Table 1Baseline characteristics for patients according to worst KeGFR in the first 7 days of ICU stay
Total patients (n= 13,284)
Lowest KeGFR > 70 ml/min/
1.73 m2(n= 7,089) 1.73 mLowest KeGFR 452(n= 3,420)–70 ml/min/ Lowest KeGFR 301.73 m2(n= 1,112)–45 ml/min/ Lowest KeGFR < 30 ml/min/1.73 m2(n= 1,663) p
Age (years), mean ± SD 63.3 ± 17.3 60.3 ± 17.3 66.8 ± 16.6 69.5 ± 15.2 64.6 ± 17.0 <0.001
Male,n(%) 7067 (53.2) 3850 (54.3) 1772 (51.8) 596 (53.6) 849 (51.0) 0.196
Hypertension,n(%) 4076 (30.7) 2349 (33.1) 1073 (31.4) 311 (28.0) 343 (20.6) <0.001
Uncomplicated diabetes,n(%) 2477 (18.6) 1294 (18.2) 676 (19.8) 238 (21.4) 269 (16.2) 0.001
Complicated diabetes,n(%) 604 (4.5) 175 (2.5) 208 (6.1) 69 (6.2) 152 (9.1) <0.001
Obesity,n(%) 205 (1.5) 102 (1.4) 54 (1.6) 16 (1.4) 32 (1.9) 0.084
Congestive heart failure,n(%) 2566 (19.3) 1051 (14.8) 762 (22.3) 289 (26.0) 464 (27.9) <0.001
COPD,n(%) 2054 (15.5) 1045 (14.7) 567 (16.6) 190 (17.1) 252 (15.1) 0.087
Cardiac arrhythmia,n(%) 2414 (18.2) 1180 (16.6) 672 (19.6) 224 (20.1) 338 (20.3) <0.001
Liver disease,n(%) 727 (5.5) 334(4.7) 155(4.5) 82 (7.4) 156 (9.4) <0.001
Metastatic cancer,n(%) 620 (4.7) 333 (4.7) 167 (4.9) 39 (3.5) 81 (4.9) 0.197
Surgical patients,n(%) 5275 (39.7) 2746 (38.7) 1512 (44.2) 471 (42.4) 546 (32.8) <0.001
Sepsis,n(%) 3964 (29.8) 1666 (23.5) 1084 (31.7) 415 (37.3) 799 (48.0) <0.001
SAPS II on ICU admission, median (IQR) 33 (24–41) 29 (22–38) 34 (27–43) 38 (30–47) 40 (31–49) <0.001
SOFA on ICU admission, median (IQR) 6 (3–9) 5 (3–8) 7 (3–9) 8 (4–11) 9 (5–12) <0.001
Baseline eGFR* (ml/min), mean ± SD 109.0 ± 33.9 129.0 ± 38.8 97.5 ± 29.9 80.9 ± 26.0 64.4 ± 34.7 <0.001
Vasopressors,n(%) 4793 (36.1) 2035 (28.7) 1377 (40.3) 539 (48.5) 842 (50.6) <0.001
Mechanical ventilation,n(%) 8484 (63.9) 4022 (56.7) 2359 (69.0) 837 (75.3) 1266 (76.1) <0.001
Lowest KeGFR during first 7 days of ICU stay (ml/ min), mean ± SD
66.4 ± 29.1 88.2 ± 15.7 56.3 ± 7.2 34.5 ± 4.3 15.6 ± 8.1 <0.001
ICU LOS (days), median (IQR) 3.3 (2.1–6.1) 2.8 (1.8–4.8) 3.7 (2.3–6.9) 4.3 (2.6–7.7) 5.3(3.1–10.2) <0.001
Hospital LOS (days), median (IQR) 9 (6–15) 8 (4–13) 9 (6–16) 11 (7–18) 12 (8–21) <0.001
ICU mortality,n(%) 1,023 (7.7) 275 (3.9) 253 (7.4) 134 (12.0) 361 (22.7) <0.001
Inhospital mortality,n(%) 1,562 (11.8) 499 (7.0) 420 (12.2) 180 (16.2) 463 (27.8) <0.001
*Using lowest serum creatinine during ICU stay
COPDchronic obstructive pulmonary disease,eGFRestimated glomerular filtration rate,ICUintensive care unit,IQRinterquartile range,KeGFRkinetic estimated glomerular filtration rate,LOSlength of stay,SAPS II Simplified Acute Physiology Score II,SDstandard deviation,SOFASequential Organ Failure Assessment
Marques
et
al.
Critical
Care
(2017) 21:280
Page
5
of
ICU stay. In Table 2, we can observe that in the group of patients with KDIGO stage 3 and a worst achieved KeGFR greater than 30 ml/min/1.73 m2 or a worst achieved KeGFR < 30 ml/min/1.73 m2and KDIGO stage 1/2, the rate of RRT was no greater than 10%. However, this rate was almost 44% when both KDIGO stage 3 and a worst KeGFR < 30 ml/min/1.73 m2were observed.
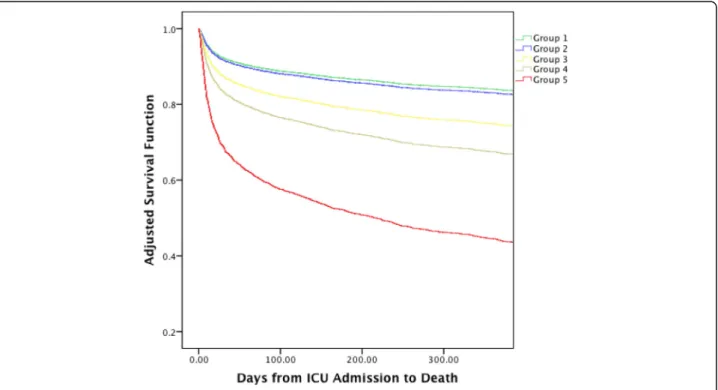
AKI, the worst achieved KeGFR, and long-term survival
After adjusting for comorbidities, baseline eGFR, and age, survival over 1 year after ICU admission followed a similar pattern to the hospital death shown in Table 2. In Fig. 2, there was separation among all, except one, of the five groups depicted in Table 3.
Table 2Outcomes for all patients according to maximum AKI severity and worst achieved KeGFR
Colors denote similar outcome patterns
AKIacute kidney injury,ICUintensive care unit,KDIGOKidney Disease Improving Global Outcomes,KeGFRkinetic estimated glomerular filtration rate,RRTrenal replacement therapy,SCrserum creatinine
Table 3Outcomes for patients with baseline eGFR > 70 ml/min/1.73 m2according to maximum AKI severity and worst achieved KeGFR
Colors denote similar outcome patterns
AKIacute kidney injury,eGFRestimated glomerular filtration rate,ICUintensive care unit,KDIGOKidney Disease Improving Global Outcomes,KeGFRkinetic estimated glomerular filtration rate,RRTrenal replacement therapy,SCrserum creatinine
Sensitivity analysis
Besides a separated analysis considering only patients with ICU admission eGFR > 70 ml/min/1.73 m2 and considering only sCr-based KDIGO criteria, we per-formed another subgroup analysis with non-oliguric patients only (KDIGO stage 3 according to urine cri-terion were excluded) and the results are shown in Additional file 3: Table S1. In general, the main re-sults were maintained regarding the need for RRT and hospital mortality.
Discussion
In this study, the performance of KeGFR in critically ill patients was evaluated for the first time. We found that the worst achieved KeGFR within the first 7 days of ICU stay was associated with several short- and long-term outcomes, such as the need for RRT, hos-pital mortality, and 1-year survival. Moreover, the worst KeGFR appears not to substitute for, but adds
prognostic information to the current AKI
classification.
Table 4Adjusted odds ratios for hospital death
Odds ratio (95% confidence interval)
KeGFR (ml/min/1.73 m2) No AKI (n= 3922) AKI stage 1 (n= 3996) AKI stage 2 (n= 3826) AKI stage 3 (n= 1540)
>70 Reference Reference Reference Reference
45–70 1.39 (1.00–1.94) 2.41 (1.91–3.19) 0.86 (0.66–1.32) 1.79 (1.09–2.54)
30–45 1.45 (0.64–2.986) 2.47 (1.44–4.35) 1.62 (1.28–1.71) 2.28 (1.38–2.63)
<30 3.71 (2.14–5.90) 5.43 (3.48–7.99) 1.73 (1.34–2.31) 4.39 (2.59–5.29)
Observe that the worst KeGFR is associated with hospital death even after dividing patients by maximum AKI stage
Adjusted for age, gender, SAPS II score, SOFA score, main comorbidities (hypertension, congestive heart failure, cardiac arrhythmias, chronic pulmonary obstructive disease, diabetes mellitus, lymphoma, metastatic cancer, liver disease, obesity), type of admission (clinical or surgical), baseline estimated glomerular filtration rate, need for vasoactive drugs, and mechanical ventilation
AKIacute kidney injury,KeGFRkinetic estimated glomerular filtration rate
Although significant advances have been made in the diagnosis and prognosis of AKI since the development of the consensus classification system, several questions remained when evaluating patients in this setting. First, as stated in the introduction section, current AKI classifi-cations are not able to discern prognosis between patients with pure AKI or acute-on-chronic kidney disease [8]. An-other possible pitfall concerns the time patients take to fully develop AKI severity, as exemplified in the introduc-tion secintroduc-tion when one patient had an increment of 50% of baseline SCr within 12 h and another within 48 h, but both were classified as KDIGO stage 1. Theoretically, cal-culating KeGFR even when SCr changes acutely can avoid these gaps found in the AKI classification system.
Our results demonstrate several important findings. First, we disclosed a disagreement between AKI severity and the worst achieved KeGFR. Several patients had AKI KDIGO stage 3, but maintained KeGFR greater than 70 ml/min/1.73 m2. This can be explained by a slow in-crement of SCr over time. For example, one patient had a baseline SCr of 0.6 mg/dl and it increased only ap-proximately 0.3 mg/dl each 48 h, going up to 1.8 mg/dl after 7 days. This patient was classified as AKI stage 3, but his KeGFR was never lower than 70 ml/min/ 1.73 m2. On the other hand, other patients had severely reduced KeGFR but no or only a minor AKI stage. Clearly, some of these patients already had reduced eGFR at baseline. However, when evaluating only those patients admitted with eGFR above 70 ml/min/1.73 m2 (Table 3) we can identify that most of these patients had no eGRF reduction at baseline. In these cases, the in-crease in SCr was not so great, but occurred within a short time interval (for example, an increment of 0.3 mg/dl in two consecutive SCr measurements, ob-tained 8 h apart can reduce the KeGFR to less than 30 ml/min/1.73 m2, but this patient will be classified as only AKI stage 1).
Although the great majority of SCr measurements in the present study had an interval between them of 20 to 28 h, we maintained all measurements with an interval between 6 and 48 h, making it possible to evaluate the patients earlier, within the first 12 h after ICU admission, when SCr can already be increasing. At this time, it is possible there is not enough time for SCr to increase for the KDIGO system to achieve even AKI stage 1, al-though KeGFR can already be severely reduced.
Secondly, and perhaps most importantly, both the AKI classification system and KeGFR seem to be comple-mentary in predicting outcomes. For example, almost 45% of patients with AKI stage 3 and KeGFR < 30 ml/ min/1.73 m2needed RRT in comparison with less than 10% of patients with AKI stage 3 but less severe KeGFR reduction and less than 5% of those patients with KeGFR < 30 ml/min/1.73 m2but only AKI stage 1/2.
In relation to hospital mortality, a stepwise reduction in the worst achieved KeGFR conferred an incremental risk of death to each AKI stage in both uni- and multi-variate analyses. It is already known that AKI classifica-tion systems are not as good at predicting events in patients with previous CKD [7, 8]. Moreover, it has been recently suggested that different AKI patterns in relation to SCr trajectory (resolving/nonresolving) imply different prognoses [17]. Analyzing the KeGFR equation, it con-tains two important pieces of information not contem-plated in the AKI classification systems: baseline eGFR and the speed of SCr increase. In part, it is probable that KeGFR adds prognostic information because it can iden-tify patients with previous CKD. However, our data sug-gest that to correctly quantify renal injury in critically ill patients we must take into consideration not only the SCr increment degree but also the speed at which this increment occurs, as suggested in the introductory sec-tion of this manuscript. Supported by the groups shown in Table 3, it is important to highlight that we do not propose substituting the AKI classification with KeGFR, but we think both must be used together—the first to evaluate the magnitude of the acute injury and the latter to measure the effects of AKI on GFR.
Because it is clear that oligoanuric patients had GFR close to zero and it is more difficult to ascertain eGFR in these patients who maintain UO, we performed a sensi-tivity analysis excluding those patients with AKI KDIGO stage 3 according to the UO. Generally, the results were maintained, mainly when evaluating the need for RRT (almost 50% of patients with both AKI stage 3 according to the Scr criterion and a KeGFR < 30 ml/min/1.73 m2).
Finally, we also evaluated long-term mortality. Except for groups 1 and 2, there was a clear separation in sur-vival lines according to the classification by AKI KDIGO stage/worst KeGFR. These results emphasize that AKI severity alone does not determine long-term outcome but that an interaction between baseline GFR and AKI severity and the speed of onset of AKI are important to assess both short- and long-term prognosis.
Our study has several and important limitations. First, and most important, we did not have access to previous SCr measurements thus making it impossible to identify patients with actual previous CKD. To overcome this fact, we performed a sensitivity analysis including only patients with an eGFR > 70 ml/min/1.73 m2. We consid-ered the lowest SCr available during ICU stay as the baseline, although this approach can inflate the AKI inci-dence, indicating that such a level is often lower than the most recent outpatient creatinine value [18]. An-other limitation is that it is difficult to determine the ac-tual maximal increase in SCr when eGFR is near zero in critically ill patients and, consequently, the total body water volume as described in the methodology section.
Although it has been suggested to limit this increment to 1.7 mg/dl a day [9, 10], we analyzed a subset of pa-tients with anuria and no RRT to determine the mean value of daily SCr increment (a real measure of maximal SCr increment) and used different means for men and women, although we acknowledge this can change ac-cording to obesity status, age, and other factors. While we have identified KeGFR as a prognostic tool in risk stratification regarding the need for RRT and survival, identifying patients at high risk and highlighting the im-portance of implementing measures that prevent/limits further renal damage [19], we recognize that, regarding the further practical use of KeGFR for drug dose correc-tion, validation studies using standard GFR measurements (by measuring CrCl or using exogenous substances such as inulin, iohexol, and others) are warranted.
Conclusion
In conclusion, we suggest that both the AKI classifica-tion system and KeGFR are complementary to each other. Analyzing different prognoses according to the worst achieved KeGFR in each AKI stage, we suggest that patients with acute CKD, pure AKI, slow- or fast-onset AKI, and all possible combinations thereof, have different prognoses and that assessing both AKI stage and KeGFR can help to identify patients at different risk levels in clinical practice.
Additional files
Additional file 1:Illustrative cases of differences between KDIGO stage and worst KeGFR. (DOCX 14 kb)
Additional file 2: Figure S1.Discriminative ability of worst KeGFR as continuous or categorized variable in predicting hospital death. (DOCX 36 kb)
Additional file 3: Table S1.Outcomes for patients according to maximum sCr-based AKI severity and worst achieved eGFR. (DOCX 16 kb)
Additional file 4: Table S2.Outcomes for non-oliguric patients according to maximum sCr-based AKI severity and worst achieved eGFR. (DOCX 16 kb)
Additional file 5: Table S3.Outcomes for patients according to maximum sCr-based AKI severity and worst eGFR estimated by CKD-EPI equation using maximum SCr. (DOCX 16 kb)
Additional file 6: Table S4.Adjusted odds ratios for hospital death. Observe that worst eGFR estimated by CKD-EPI equation using maximum SCr is associated with hospital death only in patients with no AKI. (DOCX 15 kb)
Abbreviations
AKI:Acute kidney injury; CKD: Chronic kidney disease; CrCl: Creatinine clearance; ESRD: End-stage renal disease; GFR: Glomerular filtration rate; ICU: Intensive care unit; KDIGO: Kidney Disease Improving Global Outcomes; KeGFR: Kinetic estimated glomerular filtration rate; LOS: Length of stay; MIMIC: Multiparameter Intelligent Monitoring in Intensive Care; RRT: Renal replacement therapy; SAPS: Simplified Acute Physiology Score; SCr: Serum creatinine; SOFA: Sequential Organ Failure Assessment; UO: Urine output
Acknowledgements None.
Funding Not applicable.
Availability of data and materials
The Multiparameter Intelligent Monitoring in Intensive Care (MIMIC)-II project is freely available, so that any researcher who accepts the data user agreement and has attended“protecting human subjects’training”can apply for permission to access the data.
Authors’contributions
ABL designed the study, carried out data extraction as well as data analysis, and wrote the manuscript. FdOM, SAO, PFdLeSS, WGN, MdSS, TMF, and BGC participated in data extraction and data analysis. FdOM participated in analyzing samples and data, including clinical aspects, and revised the manuscript. All authors read and approved the final manuscript.
Ethics approval and consent to participate
This study was approved by the institutional review boards of Massachusetts Institute of Technology and Beth Israel Deaconess Medical Center and was granted a waiver of informed consent.
Consent for publication Not applicable.
Competing interests
The authors declare that they have no competing interests.
Publisher’s Note
Springer Nature remains neutral with regard to jurisdictional claims in published maps and institutional affiliations.
Author details
1Medical Sciences Postgraduate Program, Department of Clinical Medicine, Universidade Federal do Ceará, Fortaleza, Ceará, Brazil.2Medical Sciences Postgraduate Program, Universidade de Fortaleza–UNIFOR, Fortaleza, Ceará, Brazil.3Instituto Dr. José Frota, Avenida Abolição, 4043 Ap 1203, Fortaleza, Ceará CEP 60165-082, Brazil.
Received: 16 August 2017 Accepted: 26 October 2017
References
1. Bagshaw SM, George C, Bellomo R, ANZICS Database Management Committee. A comparison of the RIFLE and AKIN criteria for acute kidney injury in critically ill patients. Nephrol Dial Transplant. 2008;23:1569–74. 2. Singbartl K, Kellum JA. AKI in the ICU: definition, epidemiology, risk
stratification, and outcomes. Kidney Int. 2012;81:819–25.
3. Hoste EAJ, Clermont G, Kersten A, et al. RIFLE criteria for acute kidney injury are associated with hospital mortality in critically ill patients: a cohort analysis. Crit Care. 2006;10:R73.
4. Bellomo R, Ronco C, Kellum JA, Mehta RL, Palevsky P, Acute Dialysis Quality Initiative workgroup. Acute renal failure—definition, outcome measures, animal models, fluid therapy and information technology needs: the Second International Consensus Conference of the Acute Dialysis Quality Initiative (ADQI) Group. Crit Care. 2004;8:R204–12.
5. Molitoris BA, Levin A, Warnock DG, et al. Improving outcomes of acute kidney injury: report of an initiative. Nat Clin Pract Nephrol. 2007;3:439–42. 6. Kellum JA, Lameire N, KDIGO AKI Guideline Work Group. Diagnosis, evaluation,
and management of acute kidney injury: a KDIGO summary (Part 1). Crit Care. 2013;17:204.
7. Waikar SS, Bonventre JV. Creatinine kinetics and the definition of acute kidney injury. J Am Soc Nephrol. 2009;20:672–9.
8. Libório AB, Macedo E, de Queiroz REB, et al. Kidney Disease Improving Global Outcomes or creatinine kinetics criteria in acute kidney injury: a proof of concept study. Nephrol Dial Transplant. 2013;28:2779–87. 9. Chen S. Retooling the creatinine clearance equation to estimate kinetic GFR
when the plasma creatinine is changing acutely. J Am Soc Nephrol. 2013;24:877–88.
11. Saeed M, Villarroel M, Reisner AT, et al. Multiparameter Intelligent Monitoring in Intensive Care II: a public-access intensive care unit database. Crit Care Med. 2011;39:952–60.
12. Angus DC, Linde-Zwirble WT, Lidicker J, Clermont G, Carcillo J, Pinsky MR. Epidemiology of severe sepsis in the United States: analysis of incidence, outcome, and associated costs of care. Crit Care Med. 2001;29:1303–10. 13. Le Gall JR, Lemeshow S, Saulnier F. A new Simplified Acute Physiology
Score (SAPS II) based on a European/North American multicenter study. JAMA. 1993;270:2957–63.
14. Vincent JL, de Mendonça A, Cantraine F, et al. Use of the SOFA score to assess the incidence of organ dysfunction/failure in intensive care units: results of a multicenter, prospective study. Working group on“sepsis-related problems”of the European Society of Intensive Care Medicine. Crit Care Med. 1998;26:1793–800.
15. Levey AS, Stevens LA, Schmid CH, et al. A new equation to estimate glomerular filtration rate. Ann Intern Med. 2009;150:604–12.
16. Kellum JA, Sileanu FE, Murugan R, Lucko N, Shaw AD, Clermont G. Classifying AKI by urine output versus serum creatinine level. J Am Soc Nephrol. 2015;26:2231–8.
17. Bhatraju PK, Mukherjee P, Robinson-Cohen C, et al. Acute kidney injury subphenotypes based on creatinine trajectory identifies patients at increased risk of death. Crit Care. 2016;20:372.
18. Siew ED, Matheny ME, Ikizler TA, et al. Commonly used surrogates for baseline renal function affect the classification and prognosis of acute kidney injury. Kidney Int. 2010;77:536–42.
19. Joannidis M, Druml W, Forni LG, et al. Prevention of acute kidney injury and protection of renal function in the intensive care unit: update 2017: expert opinion of the Working Group on Prevention, AKI section, European Society of Intensive Care Medicine. Intensive Care Med. 2017;43:730–49.
• We accept pre-submission inquiries
• Our selector tool helps you to find the most relevant journal • We provide round the clock customer support
• Convenient online submission • Thorough peer review
• Inclusion in PubMed and all major indexing services • Maximum visibility for your research
Submit your manuscript at www.biomedcentral.com/submit