CKD Epidemiology Collaboration (CKD-EPI) Equations for
Taiwanese Adults
Ling-I Chen1., Jinn-Yuh Guh1,4., Kwan-Dun Wu3
, Yung-Ming Chen3, Mei-Chuan Kuo1,4, Shang-Jyh Hwang1,4, Tzu-Hui Chen2, Hung-Chun Chen1,4*
1Division of Nephrology, Department of Internal Medicine, Kaohsiung Medical University Hospital, Kaohsiung, Taiwan,2Department of Nursing, Kaohsiung Medical University Hospital, Kaohsiung, Taiwan,3Department of Internal Medicine, National Taiwan University Hospital, Taipei, Taiwan,4Faculty of Renal Care, College of Medicine, Kaohsiung Medical University, Kaohsiung, Taiwan
Abstract
Background:Estimated glomerular filtration rate (eGFR) using the Modification of Diet in Renal Disease (MDRD) study or the Chronic Kidney Disease Epidemiology Collaboration (CKD-EPI) equations may not be accurate for Asians; thus, we developed modified eGFR equations for Taiwanese adults.
Methods:This cross-sectional study compared the Taiwanese eGFR equations, the MDRD study, and the CKD-EPI equations with inulin clearance (Cin). A total of 695 adults including 259 healthy volunteers and 436 CKD patients were recruited.
Participants from the Kaohsiung Medical University Hospital were used as the development set (N = 556) to develop the Taiwanese eGFR equations, whereas participants from the National Taiwan University Hospital were used as the validation set (N = 139) for external validation.
Results:The Taiwanese eGFR equations were developed by using the extended Bland-Altman plot in the development set. The Taiwanese MDRD equation was 1.3096MDRD0.912, Taiwanese CKD-EPI was 1.2626CKD-EPI0.914and Taiwanese four-level CKD-EPI was 1.2056four-level CKD-EPI0.914. In the validation set, the Taiwanese equations had the lowest bias, the Taiwanese equations and the Japanese CKD-EPI equation had the lowest RMSE, whereas the Taiwanese and the Japanese equations had the best precision and the highest P30among all equations. However, the Taiwanese MDRD equation had
higher concordance correlation than did the Taiwanese CKD-EPI, the Taiwanese four-level CKD-EPI and the Japanese equations. Moreover, only the Taiwanese equations had no proportional bias among all of the equations. Finally, the Taiwanese MDRD equation had the best diagnostic performance in terms of ordinal logistic regression among all of the equations.
Conclusion:The Taiwanese MDRD equation is better than the MDRD, CKD-EPI, Japanese, Asian, Thai, Taiwanese CKD-EPI, and Taiwanese four-level CKD-EPI equations for Taiwanese adults.
Citation:Chen L-I, Guh J-Y, Wu K-D, Chen Y-M, Kuo M-C, et al. (2014) Modification of Diet in Renal Disease (MDRD) Study and CKD Epidemiology Collaboration (CKD-EPI) Equations for Taiwanese Adults. PLoS ONE 9(6): e99645. doi:10.1371/journal.pone.0099645
Editor:Jean-Claude Dussaule, INSERM, France
ReceivedNovember 12, 2013;AcceptedMay 17, 2014;PublishedJune 13, 2014
Copyright:ß2014 Chen et al. This is an open-access article distributed under the terms of the Creative Commons Attribution License, which permits unrestricted use, distribution, and reproduction in any medium, provided the original author and source are credited.
Funding:This study was supported by the Bureau of Health Promotion (DOH99-HP-1107), Department of Health, R.O.C. (Taiwan). The funders had no role in study design, data collection and analysis, decision to publish, or preparation of the manuscript.
Competing Interests:The authors have declared that no competing interests exist.
* E-mail: [email protected]
.These authors contributed equally to this work.
Introduction
The abbreviated Modification of Diet in Renal Disease (MDRD) study equation [1] was derived from Caucasians and African Americans with chronic kidney diseases (CKD) [2] and is not accurate for Asians [3–6] or when the estimating equations for
glomerular filtration rate (eGFR) are above 60 mL/min/1.73 m2
[7]. Thus, some Asian countries have developed their own eGFR equations [5,8–11]. However, many equations were derived solely from CKD patients, thereby having limitations in application to the general population [12,13]. For example, the MDRD equation underestimated the gold standard GFR measured by inulin
clearance (Cin) for those with Cin of greater than 60 mL/min/
1.73 m2in a recent Japanese study [4].
Taiwan has a high prevalence (11.93%) and a low awareness (3.54%) of CKD [18]. In order to diagnose CKD by an eGFR equation with better accuracy based on the native data, we used
Cinas the gold standard to develop modified Taiwanese eGFR
equations from a cohort of CKD and healthy people and compared the performance between the original and the modified MDRD Study and the CKD-EPI equations.
Materials and Methods
We recruited adults aged over 18 years to sign informed consents from the Kaohsiung Medical University Hospital and the National Taiwan University Hospital. Subjects with acute renal failure, allergy to inulin, pregnancy, problems in voiding, amputation, congestive heart failure, cirrhosis with ascites, use of cimetidine or trimethoprim, oliguria, and those who had ever received any renal replacement therapy were excluded. Healthy volunteers were enrolled according to the percentage of age distribution in Taiwanese reported by the Ministry of the Interior of Taiwan. CKD was diagnosed and classified according to the K/ DOQI clinical guidelines [1]. The ratio of the number of the CKD patients to healthy volunteers was approximately 2:1 in this study.
Ethics Statement
The study protocol was approved by the Institutional Review Board of the Kaohsiung Medical University Hospital (KMUH-IRB-960304) and National Taiwan University Hospital (NTUH-IRB-201002031M). Informed consents were obtained in written form from patients and all clinical investigations were conducted according to the principles expressed in the Declaration of Helsinki. The patients gave consent for the publication of the clinical details.
Inulin clearance
All subjects underwent procedures to measure Cin at the
Kaohsiung Medical University Hospital or the National Taiwan University Hospital with the same protocol after the approval by
the Ethics Committee in each respective hospital. Cin was
calculated from serum inulin, urine inulin concentration, and urine volume collected in each time period. The protocol has been described before [9,19]. Briefly, after overnight fasting, the subject drank 500 mL of water 30 minutes before intravenous injection of inulin (40 mL 10% inulin in 360 mL 0.54% NaC1 with a final concentration of 1%, Fuji Yakuhin Co. Ltd., Saitama, Japan). Just before the infusion, complete urine collection and blood sampling were performed in an ordinary way. To maintain hydration, 60 mL of water was drunk at 30 and 60 minutes after the start of inulin infusion. The rate of inulin infusion was 300 mL/hour for the first 30 min and 100 mL/hour for the following 60 min.
Blood samples for serum inulin concentration were collected at 45 min and 75 min after the start of inulin infusion. Urine samples for urinary inulin concentration were collected between 30 and 60 min and between 60 and 90 min after the patient completely voided the bladder at 30 min. The first and second urinary excretions of inulin were added, assuming the total amount as a single urine collection between 30 and 90 min [9]. This value was then used with the mean of the first (45 minutes) and second (75
minutes) serum inulin concentrations to calculate Cin as the
measured GFR (mL/min/1.73 m2) [9]. Note that this abbreviated
method for the calculation of Cinhas been shown to be equivalent
to the full 2-hour Cinprotocol [9].
Serum inulin was measured by an enzymatic method by using a commercial kit (Diacolor Inulin; Toyobo Co, Osaka, Japan) with Hitachi 7180 auto-analyzer at the Kaohsiung Medical University
Hospital. The steady-state of serum inulin concentrations was reached at 45 min (22.2 [21.5, 22.9] mg/dL) and 75 min (21.6 [21.1, 22.1] mg/dL) because the coefficient of variation was only 2.9%. This result was similar to a previous study [9].
Measurement of creatinine and estimated GFR
Serum creatinine (SCr) was measured by the IDMS-traceable enzymatic method in a Roche Cobas Integra 400 at the Kaohsiung Medical University Hospital. The eGFR values were
calculated by the IDMS-traceable MDRD equation: 1756SCr
-1.154
6Age-0.20360.742 (if female), the CKD-EPI equation:
1416min(SCr/k, 1)a 6max(SCr/k, 1)-1.20960.993Age61.018 [if
female] wherekis 0.7 for females and 0.9 for males,ais20.329
for females and20.411 for males, min indicates the minimum of
SCr/kor 1, and max indicates the maximum of SCr/kor 1, and
the four-level CKD-EPI equation [17]: 1416min(SCr/k,
1)a6max(SCr/k, 1)21.210
60.993Age60.993 [if female]61.05 [if Asian] wherekis 0.7 for females and 0.9 for males,ais20.328 for
females and 20.412 for males, min indicates the minimum of
SCr/kor 1, and max indicates the maximum of SCr/kor 1.
Additionally, the Japanese modifications of MDRD
( = 0.8086MDRD) and CKD-EPI ( = 0.8136CKD-EPI) [10],
Asian (Chinese, Malays and Indians in Singapore) modifications
of MDRD ( = 1.0866MDRD) and CKD-EPI ( = 1.0496
CKD-EPI) [11] and Thai modification of MDRD ( = 1.1296MDRD)
[20] were calculated.
Statistical analysis
Continuous data were expressed as the mean6standard error
of the mean or mean (95% confidence interval) unless stated otherwise. Linear regression was expressed as the prediction
equation6standard deviation of prediction. The 95% prediction
interval was calculated as the estimate62 standard deviations of
prediction. Note that the 95% prediction interval is always wider than the 95% confidence interval because the former estimates the scatter of the data whereas the latter estimates only the mean [21].
Continuous variables were compared by unpairedt-tests whereas
categorical variables were compared by x2
tests unless stated otherwise. All eGFR equations were compared to the Taiwanese MDRD equation.
The Taiwanese equations were generated from the whole development set by using linear regression of the difference on the average (i.e. the extended Bland-Altman plot in the MethComp package in R, which was designed specifically for method
comparison studies) [22] of the log-transformed Cin and the
MDRD, CKD-EPI and four-level CKD-EPI equations.
Internal validation of the Taiwanese equations was performed by 2,000 bootstraps in which the subjects were drawn at random with replacement [23]. Hence, subjects may be represented zero or many times in a bootstrap sample. The Taiwanese equations were trained in the sampled subjects and tested in the original development set in each bootstrap step. Afterwards, the difference of RMSE between the bootstrap and the test samples was subtracted from the RMSE of the original development set [23].
For the validation set, eGFR equations were assessed for accuracy and agreement. Accuracy was measured as the percentage within 30% of Cin(P30), bias, precision, and the root mean squared error (RMSE) [24]. The bias was defined as the
median difference between Cin and eGFR (Cin - eGFR) with
negative values indicating overestimation of Cin. Precision was
expressed as the interquartile range of the bias. RMSE was defined
as the square root of the average squared difference of Cin and
Because P30and bias were compared between the paired data, P30 was compared by the exact McNemar test, whereas bias was compared by the Wilcoxon signed rank test.
Agreement between two continuous variables (Cinand eGFR)
was measured by the concordance correlation coefficient (r) [25] and the Bland-Altman plot [22,26]. Concordance correlation was compared by Zou’s method [27]. Note that the comparison of two r’s (r of Cinand eGFR1 and r of Cinand eGFR2) requires a third r (r of eGFR1 and eGFR2). Diagnostic performance of the eGFR equations for the classification of CKD stages (according to Cinor eGFR alone, disregarding proteinuria) was assessed by ordinal logistic (generalized ordered logit) regression and chance-corrected agreement (kappa coefficient, a measure of the agreement between two categorical variables) [28]. Ordinal logistic regressions (Cin -defined CKD category and eGFR was the dependent and independent variable, respectively) (Methods S1) were compared by the Akaike information criterion (AIC) where a model with the lowest AIC is the best model [29]. Note that the AIC is an information-theoretic approach in which there are no null hypothesis significance tests to choose the lowest AIC [29].
Instead, the Akaike weight (wi) is used to weigh the evidence of
each model [29,30].
wi~ exp ({(AICi{min (AIC))=2)
PK k~1
exp ({(AICi{min (AIC))=2)
Here, exp denotes the exponential,AICidenotes theAICfor the
ith model whereas min (AIC) denotes the minimalAIC for theK
models.
Analyses were computed by using the R (version 3.0.0; Free Software Foundation, Boston, MA) and the Stata software (version 13.0, StataCorp LP, College Station, TX).
Results
Characteristics of the Participants in the Development and Validation Sets
From April, 2008 to October, 2009, a total of 300 persons were recruited from the Kaohsiung Medical University Hospital where 11 subjects were excluded due to incomplete data. From Oct. 2009 to June 2011, a total of 406 persons were recruited from either the Kaohsiung Medical University Hospital or the National Taiwan University Hospital. Thus, a total of 695 participants which included 259 healthy volunteers and 436 CKD patients were recruited.
Participants from the Kaohsiung Medical University Hospital (located in the southern Taiwan) were used as the development set (N = 556) to develop the Taiwanese eGFR equations whereas participants from the National Taiwan University Hospital were used as the validation set (N = 139) for the external validation of the Taiwanese eGFR equations. Note that this was a geographical external validation set [31], in that the National Taiwan University Hospital is a different hospital located in Northern Taiwan. As shown in Table 1, there were no healthy volunteers, and the participants were older in the validation set.
Determination and bootstrap cross-validation of the Taiwanese eGFR equations in the development set
Taiwanese eGFR equations were determined by using linear regression of the difference on the average (i.e. the extended Bland-Altman plot) in the development set [22]. Taiwanese eGFR
equations were 1.3096MDRD0.912 for the Taiwanese MDRD
(Fig. 1A), 1.2626CKD-EPI0.914 for the Taiwanese CKD-EPI
(Fig. 1B) and 1.2056four-level CKD-EPI0.914for the Taiwanese
four-level CKD-EPI (Fig. 1C) in the (anti-logged) original units, respectively. In 2,000 bootstraps of the development set, RMSE of the Taiwanese MDRD (11.7) was lower than that of the Taiwanese CKD-EPI (13.7) and Taiwanese four-level CKD-EPI (18.3). Note that RMSE of internal validation was lower than that of the external validation. However, the results of internal validation are usually too optimistic and external validation is necessary for the generalizability of prediction rules [32].
Accuracy of eGFR for the validation set
Accuracy was assessed by P30, bias, precision and the RMSE.
We found P30for all of the equations except that of the Japanese
equations, Taiwanese EPI or Taiwanese four-level CKD-EPI equations was lower than that of the Taiwanese MDRD
equation for the whole set (Table 2) and those with Cin$60 mL/
min/1.73 m2 (Table3). In contrast, only P30 of the four-level
CKD-EPI, Asian CKD-EPI and Thai MDRD equations were lower than that of the Taiwanese MDRD equation for those with
Cin,60 mL/min/1.73 m2(Table 4)
The Taiwanese equations had the lowest bias among all of the
equations for the whole set (Table 2), those with Cin$60 mL/
min/1.73 m2(Table 3) and those with Cin,60 mL/min/1.73 m2
(Table 4). The Taiwanese and the Japanese equations had the best
precision (19–20 mL/min/1.73 m2) among all of the equations for
the whole set (Table 2). The Taiwanese equations, the Japanese CKD-EPI equation, and the MDRD equation had the lowest RMSE among all equations for the whole set (Table 2). In contrast, the Taiwanese MDRD equation and the Japanese
equations had the lowest RMSE for those with Cin,60 mL/min/
1.73 m2 (Table 4). However, the Taiwan MDRD equation had
lower RMSE than did all equations except the Taiwanese CKD-EPI, Taiwanese four-level CKD-CKD-EPI, MDRD and CKD-EPI
equations for those with Cin$60 mL/min/1.73 m2(Table 3).
Agreement between Cinand eGFR for the validation set
The agreement between Cin and the eGFR equations was
assessed by concordance correlation and the Bland-Altman plot for the validation set. We found that concordance correlation of
the Taiwanese MDRD equation (0.823) was higher (P,0.05) than
those of the Japanese MDRD (0.803), Taiwanese CKD-EPI (0.78), Taiwanese four-level CKD-EPI (0.78), Thai MDRD (0.772) and Japanese CKD-EPI (0.771) equations, but was not different from that of the MDRD (0.826), CKD-EPI (0.798), Asian MDRD (0.794), Asian CKD-EPI (0.782),or four-level CKD-EPI (0.781), for the whole set.
The concordance correlation of the Taiwanese MDRD
equation (0.757) was higher (P,0.05) than those of the Taiwanese
CKD-EPI (0.729), Taiwanese four-level CKD-EPI (0.728), MDRD (0.685), CKD-EPI (0.628), Asian MDRD (0.627), Asian CKD-EPI (0.593), four-level CKD-EPI (0.59) and Thai MDRD (0.598) equations, but was not different from that of the Japanese MDRD (0.771) or Japanese CKD-EPI (0.746) equation, for those
with Cin,60 mL/min/1.73 m2.
The concordance correlation of the Taiwanese MDRD (0.537)
was higher (P,0.05) than those of the Taiwanese four-level
EPI (0.39) and Taiwanese EPI (0.388) and Japanese CKD-EPI (0.378) equations, but was not different from that of the MDRD (0.571), Asian MDRD (0.522), Japanese MDRD (0.502), Thai MDRD (0.489), CKD-EPI (0.464), four-level CKD-EPI
(0.447) or Asian CKD-EPI (0.446), for those with Cin$60 mL/
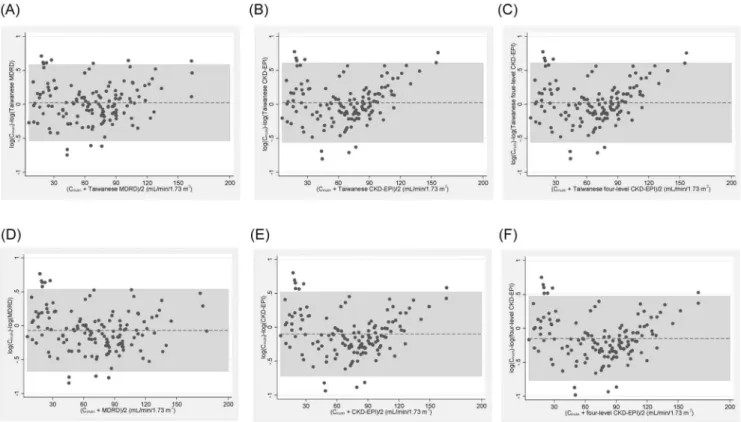
In the Bland-Altman plot of the original data (data not shown), there were increasing scatters of differences with increasing eGFR (i.e. V-shaped limits of agreement) for all of the equations. Moreover, there were negative correlations between the difference and the mean for the MDRD, CKD-EPI and four-level CKD-EPI equations respectively. These findings violated the assumptions of the homogeneity of the scatter of differences and a constant bias for the Bland-Altman plot [22,26,33]. Thus, the Bland-Altman plot of the difference of the log-transformed data on the ordinate [33] was shown in Fig. 2. Note that the anti-log of the difference between two log-transformed data is the ratio of the two data in the original units. The geometric mean ratio (95% limit of agreement) in the original units of the Taiwanese MDRD (A), Taiwanese CKD-EPI (B), Taiwanese four-level CKD-EPI (C), MDRD (D), CKD-EPI (E) and four-level CKD-EPI (F) equations was 1.023 (0.58, 1.79), 1.025 (0.57, 1.8), 1.025 (0.57, 1.8), 0.93 (0.5, 1.7), 0.91 (0.49, 1.7), 0.86 (0.46, 1.6), respectively.
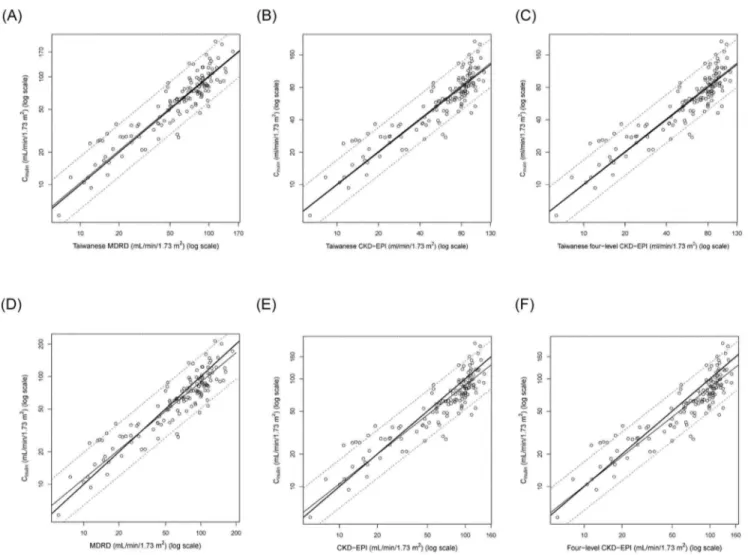
Regression lines and the 95% prediction intervals of the
extended Bland-Altman plot of the log-transformed Cinand the
log-transformed Taiwanese MDRD (Fig. 3A), Taiwanese CKD-EPI (Fig. 3B), Taiwanese four-level CKD-CKD-EPI (Fig. 3C), MDRD (Fig. 3D), CKD-EPI (Fig. 3E) and four-level CKD-EPI (Fig. 3F) in the (anti-logged) original units are shown in Fig. 3.
The slope (95% confidence interval) of the Taiwanese MDRD, Taiwanese CKD-EPI, Taiwanese four-level CKD-EPI, MDRD, CKD-EPI, four-level CKD-EPI, Japanese MDRD, Japanese CKD-EPI, Asian MDRD, Asian CKD-EPI and Thai MDRD was 0.99 (0.92, 1.06), 1.008 (0.93, 1.08), 1.007 (0.93, 1.08), 0.9 (0.83, 0.96), 0.92 (0.85, 0.99), 0.92 (0.85, 0.99), 0.9 (0.83, 0.96), 0.92 (0.85, 0.99), 0.9 (0.83, 0.96), 0.92 (0.85, 0.99) and 0.9 (0.83, 0.96), respectively. Note that only the Taiwanese equations had no proportional bias (i.e. they had slopes that were not different from 1).
Diagnostic performances of the eGFR equations for the classification of CKD stages for the validation set
Diagnostic performance of the eGFR equations for the classification of CKD stages was assessed by the ordinal logistic regression and the kappa coefficients [28]. We found that all the eGFR equations had similar kappa values compared with that of the Taiwanese MDRD equation for the whole set (Table 2), those
with Cin$60 mL/min/1.73 m
2
(Table 3) and those with Cin,
60 mL/min/1.73 m2(Table 4).
In ordinal logistic regression, the Taiwanese MDRD equation had the lowest AIC (230.7) compared to those of the MDRD (231.4), CKD-EPI (232), four-level CKD-EPI (232.2), Taiwanese CKD-EPI (231.4), Taiwanese four-level CKD-EPI (231.5), Japa-nese MDRD (231.4), JapaJapa-nese CKD-EPI (232), Asian MDRD (231.4), Asian CKD-EPI (232) and Thai MDRD (231.4) equa-tions. Moreover, the Taiwanese MDRD equation had the highest Akaike weight (0.14) compared to those of the MDRD (0.097), EPI (0.07), four-level EPI (0.07), Taiwanese CKD-EPI (0.098), Taiwanese four-level CKD-CKD-EPI (0.09), Japanese MDRD (0.097), Japanese CKD-EPI (0.07), Asian MDRD (0.097), Asian CKD-EPI (0.07) and Thai MDRD (0.097) equations. Thus, the Taiwanese MDRD equation had the best diagnostic perfor-mance.
Discussion
In this study, the Taiwanese equations had the lowest bias, the Taiwanese equations and the Japanese CKD-EPI equation had the lowest RMSE, whereas the Taiwanese and the Japanese
equations had the best precision and the highest P30. The
Taiwanese MDRD equation had higher concordance correlation than the Taiwanese CKD-EPI, Taiwanese four-level CKD-EPI and the Japanese equations. Moreover, only the Taiwanese equations had no proportional bias among all of the equations. Finally, the Taiwanese MDRD equation had the best diagnostic performance in terms of ordinal logistic regression among all of the equations.
We found that the MDRD, CKD-EPI, four-level CKD-EPI, Asian equations, and Thai MDRD equations overestimated GFR, whereas the Japanese equations underestimated GFR. In contrast, the Taiwanese equations had very low bias in that the Taiwanese equations had the lowest bias among all equations.
The Taiwanese and the Japanese equations had similar
performances in terms of P30and precision in that they had the
highest P30and the best precision among all equations. Moreover,
the Taiwanese equations and the Japanese CKD-EPI equation had the lowest RMSE among all equations. However, the Taiwanese equations had lower biases than those of the Japanese equations and the Taiwanese MDRD equation had lower RMSE
than those of the Japanese equations for those with Cin$60 mL/
min/1.73 m2. Note that P30is an arbitrary measure of accuracy
whereas dichotomization (i.e., P30) of continuous variables
introduces biases [34]. In contrast, bias and RMSE are standard
Table 1.Clinical characteristics of the participants.
Clinical characteristics Development set (n = 556) Validation set (n = 139) P
Age (years) 4760.7 5161 0.006
Men (%) 47.1 51 0.40
Height (cm) 16360.4 16360.8 0.96
Weight (kg) 6460.5 6261 0.14
Body surface area (m2) 1.69
60.01 1.6760.01 0.28
CKD clinic patient (%) 53.4 100.0 ,0.001
Diabetes mellitus (%) 12.0 12.2 0.95
Serum creatinine (mg/dL) 1.5260.05 1.4360.1 0.45
Cin(mL/min/1.73 m2) 6761.6 68.863.0 0.56
Cin,60 mL/min/1.73 m2(%) 43.5 42.5 0.82
Abbreviations: CKD, chronic kidney disease; Cin, inulin clearance.
measures of model accuracy [35]. Moreover, the Taiwanese MDRD equation had higher concordance correlation than the Japanese equations. Finally, the Japanese, but not the Taiwanese equations, had proportional bias. Thus, the Taiwanese MDRD equation is better than the Japanese equations.
In the Bland-Altman plot, the 95% limits of agreement were too wide to draw conclusions. Nonetheless, only the Taiwanese equations had no proportional bias among all equations in the extended Bland-Altman plot [22].
Surprisingly, the Taiwanese MDRD equation had similar kappa value with the other equations. This finding can be explained by the fact that eGFR is a continuous variable and that the
eGFR-defined CKD stage is an arbitrary categorical variable whereas dichotomization of continuous predictor variables introduces biases [34]. In contrast, the Taiwanese MDRD equation-derived eGFR (a continuous variable) had the best diagnostic performance in terms of the lowest AIC and the highest Akaike weight in the ordinal logistic regression.
Many (but not all) studies found that the CKD-EPI equation was more accurate than the MDRD equation [6,24,36-38]. For example, the Japanese CKD-EPI equation was better than the Japanese MDRD equation [10]. The CKD-EPI equation was also better than the MDRD and four-level CKD-EPI equations in a Chinese study [39]. However, the CKD-EPI equation was not Figure 1. Determination of the Taiwanese eGFR equations in the development set.Taiwanese eGFR equations were derived by using linear regression of the differences on the average (i.e. the extended Bland-Altman plot). Cinand the eGFR equations were log-transformed and
plotted on the log-scale. The regression line (thin solid line) and its 95% prediction interval (dotted lines) were plotted along with the identity (thick solid diagonal) line. (A) The regression equation of the Taiwanese MDRD equation was 1.3096MDRD0.912in the (anti-logged) original unit. (B) The
regression equation of the Taiwanese CKD-EPI equation was 1.2626CKD-EPI0.914in the original unit. (C) The regression equation of the Taiwanese
four-level CKD-EPI equation was 1.2056four-level CKD-EPI0.914in the original unit.
better than the MDRD study equation for diabetic patients [37,38]. In this study, the Taiwanese CKD-EPI and Taiwanese four-level CKD-EPI equations were worse than the Taiwanese
MDRD equation especially for those with Cin,60 mL/min/
1.73 m2
The differences in ethnicity, study population and the use of different reference GFR methods may account for this discrepan-cy. For example, our study and the Japanese study [10] used the
gold standard Cinas the reference GFR, whereas the MDRD and
CKD-EPI equation used urinary clearance of iothalamate, which
overestimates Cin[40-42]. In contrast, the Singapore and the Thai
studies [11,20] used plasma technetium-99m-labeled
diethylene-triamine penta-acetate (99mTc-DTPA) clearance, which also
overestimates Cin[43,44].
The strengths of this study were the use of the gold standard (Cin) as the reference GFR, the inclusion of healthy volunteers, and the validation of the Taiwanese eGFR equations using an external validation set. One of the limitations of this study was that there were no healthy volunteers in the validation set. However, the
mean Cinwas similar and the proportion of subjects with Cin,
60 mL/min/1.73 m2was also similar between the development
and the validation set. The other limitation was that the participants were older in the external validation set. However, differences in case mix is not a great concern for external
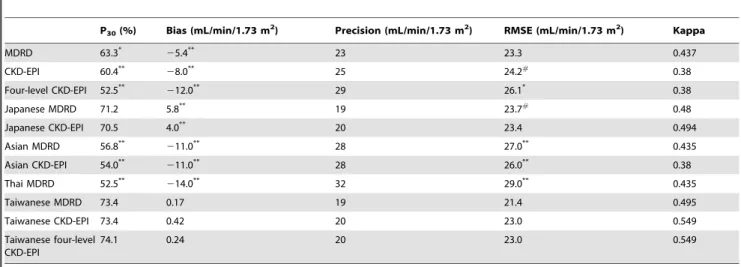
Table 2.Performance of the eGFR equations for the validation set.
P30(%) Bias (mL/min/1.73 m2) Precision (mL/min/1.73 m2) RMSE (mL/min/1.73 m2) Kappa
MDRD 63.3*
25.4** 23 23.3 0.437
CKD-EPI 60.4**
28.0** 25 24.2#
0.38
Four-level CKD-EPI 52.5**
212.0** 29 26.1* 0.38
Japanese MDRD 71.2 5.8** 19 23.7#
0.48
Japanese CKD-EPI 70.5 4.0** 20 23.4 0.494
Asian MDRD 56.8**
211.0** 28 27.0** 0.435
Asian CKD-EPI 54.0**
211.0** 28 26.0** 0.38
Thai MDRD 52.5**
214.0** 32 29.0** 0.435
Taiwanese MDRD 73.4 0.17 19 21.4 0.495
Taiwanese CKD-EPI 73.4 0.42 20 23.0 0.549
Taiwanese four-level CKD-EPI
74.1 0.24 20 23.0 0.549
Abbreviations and definitions: MDRD, Modification of Diet in Renal Disease; CKD-EPI, Chronic Kidney Disease Epidemiology Collaboration; P30, the percentage within
30% of inulin clearance; bias, median difference of inulin clearance and estimated GFR (Cin– eGFR); precision, interquartile range of the bias; RMSE, root mean square
error; Kappa, kappa coefficients of the eGFR equations for the classification of CKD stages. #
P,0.05 versus Taiwanese MDRD; *p,0.01 versus Taiwanese MDRD; **P,0.001 versus Taiwanese MDRD. doi:10.1371/journal.pone.0099645.t002
Table 3.Performance of the eGFR equations for the participants with Cin$60 mL/min/1.73 m2in the validation set.
P30(%) Bias (mL/min/1.73 m2) Precision (mL/min/1.73 m2) RMSE (mL/min/1.73 m2) Kappa
MDRD 65.0*
29.2** 30 27.0 0.257
CKD-EPI 65.0*
212.0** 26 26.7 0.205
Four-level CKD-EPI 57.5** 216.6** 26 28.4#
0.205
Japanese MDRD 78.8 8.6** 26 27.9# 0.28
Japanese CKD-EPI 81.3 5.2** 26 28.7#
0.29
Asian MDRD 60.0*
217.0** 30 31.1#
0.26
Asian CKD-EPI 57.5**
216.0** 26 28.3# 0.26
Thai MDRD 55.0**
222.0** 31 33.9#
0.26
Taiwanese MDRD 81.3 2.1 28 25.8 0.271
Taiwanese CKD-EPI 81.3 1.2 26 27.5 0.33
Taiwanese four-level CKD-EPI
81.3 1.4 26 27.5 0.33
Abbreviations and definitions: MDRD, Modification of Diet in Renal Disease; CKD-EPI, Chronic Kidney Disease Epidemiology Collaboration; P30, the percentage within
30% of inulin clearance; bias, median difference of inulin clearance and estimated GFR (Cin– eGFR); precision, interquartile range of the bias; RMSE, root mean square
error; Kappa, kappa coefficients of the eGFR equations for the classification of CKD stages. #
Table 4.Performance of the eGFR equations for the participants with Cin,60 mL/min/1.73 m2in the validation set.
P30(%) Bias (mL/min/1.73 m2) Precision (mL/min/1.73 m2) RMSE (mL/min/1.73 m2) Kappa
MDRD 61.0 21.7** 17 17.0** 0.356
CKD-EPI 54.0 23.1** 21 20.3** 0.31
Four-level CKD-EPI 45.8*
25.0** 24 22.6** 0.31
Japanese MDRD 61.0 3.9** 13 12.3 0.424
Japanese CKD-EPI 56.0 2.4** 15 13.9 0.407
Asian MDRD 52.5 24.8** 21 20.2** 0.365
Asian CKD-EPI 49.0#
25.1** 24 22.4** 0.291
Thai MDRD 49.0*
25.6** 23 21.9** 0.365
Taiwanese MDRD 62.7 20.58 15 13.2 0.429
Taiwanese CKD-EPI 62.7 20.61 15 14.7* 0.411
Taiwanese four-level CKD-EPI
64.4 20.62 15 14.8* 0.411
Abbreviations and definitions: MDRD, Modification of Diet in Renal Disease; CKD-EPI, Chronic Kidney Disease Epidemiology Collaboration; P30, the percentage within
30% of inulin clearance; bias, median difference of inulin clearance and estimated GFR (Cin– eGFR); precision, interquartile range of the bias; RMSE, root mean square
error; Kappa, kappa coefficients of the eGFR equations for the classification of CKD stages. #
P,0.05 versus Taiwanese MDRD; *p,0.01 versus Taiwanese MDRD; **P,0.001 versus Taiwanese MDRD. doi:10.1371/journal.pone.0099645.t004
Figure 2. Bland-Altman plot of eGFR equations versus inulin clearance (Cin) for the validation set.The difference of log-transformed Cin
and eGFR equation (ordinate) was plotted against the mean of Cinand each respective eGFR equation (abscissa). The mean difference was shown as a
dotted horizontal line whereas the 95% limit of agreement was shown as the shaded area. Note that the anti-log of the difference between two log-transformed data is the ratio of the two data in the original units. Bland-Altman plot of (A) The geometric mean ratio (95% limit of agreement) was 1.023 (0.58, 1.79) for the Taiwanese MDRD in the original unit, (B) The geometric mean ratio (95% limit of agreement) was 1.025 (0.57, 1.8) for the Taiwanese EPI in the original unit, (C) The geometric mean ratio (95% limit of agreement) was 1.025 (0.57, 1.8) for the Taiwanese four-level CKD-EPI, (D) The geometric mean ratio (95% limit of agreement) was 0.93 (0.5, 1.7) for the MDRD in the original unit, (E) The geometric mean ratio (95% limit of agreement) was 0.91 (0.49, 1.7) for the CKD-EPI in the original unit and (F) The geometric mean ratio (95% limit of agreement) was 0.86 (0.46, 1.6) for the four-level CKD-EPI in the original unit.
validation [31]. Finally, both hospitals used the same study protocol and serum creatinine and inulin were both measured at the Kaohsiung Medical University Hospital.
In conclusion, the Taiwanese MDRD equation performs better than the MDRD, CKD-EPI, four-level CKD-EPI, Japanese, Asian, Thai, Taiwanese CKD-EPI, and Taiwanese four-level CKD-EPI equations for Taiwanese adults. Thus, further studies are required to determine its clinical applications (e.g. correlations with complications and prognosis) in Taiwan.
Supporting Information
Figure S1 Logistic regression for Cin-defined CKD stage 1 in the validation set.Linear regression (the oblique line) and logistic regression (the S-shaped sigmoid curve) of the Taiwanese
MDRD equation for the prediction of the probability (p(x)) of
inulin clearance (Cin)-defined CKD stage 1 (the dots on the vertical axis, yes = 1, no = 0). Note that the probability of CKD stage 1
increases as eGFR increases and that the logistic curve always predictsp(x) to be within the limit of zero and 1 whereas the linear
regression line can predictp(x) to be less than zero.
(TIFF)
Figure S2 Ordinal logistic regression of the Taiwanese MDRD equation for the prediction of Cin-defined CKD stages in the validation set. Ordinal logistic regression (generalized ordered logit) of the Taiwanese MDRD equation was performed by the cumulative logit model. (A) Cumulative
probability of Cin-defined CKD stages and the logistic curves.
Note that the cumulative probability of CKD stage 1, stage 1–2, stage 1–3 and stage 1–4 increases as eGFR increases. (B) Taiwanese MDRD equation was used to predict the log(odds) (logit) of the probability of CKD stage 1, stage 1–2, stage 1–3 and stage 1–4. Note that the non-linear relationship between cumulative probability and eGFR in (A) had been transformed to be a linear (a+bx) relationship. The odds ratio (95% confidence interval) of one unit increase in x was calculated as exp(b), which Figure 3. Regression of the Taiwanese eGFR equations versus inulin clearance (Cin) in the validation set.Cinand the eGFR equations
were log-transformed and plotted on the log-scale in the regression derived from the extended Bland-Altman plot. The regression line (thin solid line) and its 95% prediction interval (dotted lines) were plotted along with the identity (thick solid diagonal) line. (A) The slope (95% confidence interval) was 0.99 (0.92, 1.06) and the regression equation of the Taiwanese MDRD was 1.066Taiwanese MDRD0.99in the anti-logged (original) unit. (B) The
slope was 1.008 (0.93, 1.08) and the regression equation of the Taiwanese CKD-EPI was 0.996Taiwanese CKD-EPI1.01in the original unit. (C) The slope
was 1.007 (0.93, 1.08) and the regression equation of the Taiwanese four-level CKD-EPI was 0.996Taiwanese four-level CKD-EPI1.01in the original unit.
(D) The slope was 0.9 (0.83, 0.96) and the regression equation of the MDRD equation was 1.416MDRD0.9in the original unit. (E) The slope was 0.92
(0.85, 0.99) and the regression equation of the CKD-EPI equation was 1.286CKD-EPI0.92in the original unit. (F) The slope was 0.92 (0.85, 0.99) and the
regression equation of the four-level CKD-EPI was 1.226four-level CKD-EPI0.92in the original unit.
was 1.09 (1.05, 1.13), 1.11 (1.07, 1.15), 1.14 (1.08, 1.21) and 2.01 (1.06, 3.82) for stage 1, stage 1–2, stage 1–3 and stage 1–4, respectively.
(TIFF)
Methods S1 Supplemental methods-ordinal logistic re-gression.
(DOC)
Acknowledgments
We would like to thank Drs. Seiichi Matsuo, Enyu Imai, Masaru Horio, and Yoshinari Yasuda for their assistance with inulin clearance testing and measurement.
Author Contributions
Conceived and designed the experiments: L-IC J-YG H-CC. Performed the experiments: L-IC J-YG H-CC T-HC Y-MC K-DW. Analyzed the data: J-YG. Contributed reagents/materials/analysis tools: M-CK S-JH T-HC Y-MC K-DW. Wrote the paper: L-IC J-YG.
References
1. National-Kidney-Foundation (2002) K/DOQI clinical practice guidelines for chronic kidney disease: evaluation, classification, and stratification. Am J Kidney Dis 39: S1–S266.
2. Levey AS, Bosch JP, Lewis JB, Greene T, Rogers N, et al. (1999) A more accurate method to estimate glomerular filtration rate from serum creatinine: a new prediction equation. Modification of Diet in Renal Disease Study Group. Ann Intern Med 130: 461–470.
3. Zuo L, Ma Y-C, Zhou Y-H, Wang M, Xu G-B, et al. (2005) Application of GFR-estimating equations in Chinese patients with chronic kidney disease. Am J Kidney Dis 45: 463–472.
4. Imai E, Horio M, Nitta K, Yamagata K, Iseki K, et al. (2007) Estimation of glomerular filtration rate by the MDRD study equation modified for Japanese patients with chronic kidney disease. Clin Exp Nephrol 11: 41–50.
5. Ma YC, Zuo L, Chen JH, Luo Q, Yu XQ, et al. (2006) Modified glomerular filtration rate estimating equation for Chinese patients with chronic kidney disease. J Am Soc Nephrol 17: 2937–2944.
6. Earley A, Miskulin D, Lamb EJ, Levey AS, Uhlig K (2012) Estimating equations for glomerular filtration rate in the era of creatinine standardization: a systematic review. Ann Intern Med 156: 785–795.
7. Stevens L, Coresh J, Feldman H, Greene T, Lash J, et al. (2007) Evaluation of the modification of diet in renal disease study equation in a large diverse population. JASN 18: 2749–2757.
8. Imai E, Horio M, Nitta K, Yamagata K, Iseki K, et al. (2007) Modification of the Modification of Diet in Renal Disease (MDRD) Study equation for Japan. Am J Kidney Dis 50: 927–937.
9. Horio M, Imai E, Yasuda Y, Hishida A, Matsuo S, et al. (2009) Simple sampling strategy for measuring inulin renal clearance. Clin Exp Nephrol 13: 50–54. 10. Horio M, Imai E, Yasuda Y, Watanabe T, Matsuo S (2010) Modification of the
CKD epidemiology collaboration (CKD-EPI) equation for Japanese: accuracy and use for population estimates. Am J Kidney Dis 56: 32–38.
11. Teo BW, Xu H, Wang D, Li J, Sinha AK, et al. (2011) GFR estimating equations in a multiethnic Asian population. Am J Kidney Dis 58: 56–63. 12. Rule A, Larson T, Bergstralh E, Slezak J, Jacobsen S, et al. (2004) Using serum
creatinine to estimate glomerular filtration rate: accuracy in good health and in chronic kidney disease. Ann Intern Med 141: 929–937.
13. Poggio E, Wang X, Greene T, Van Lente F, Hall P (2005) Performance of the modification of diet in renal disease and Cockcroft-Gault equations in the estimation of GFR in health and in chronic kidney disease. JASN 16: 459–466. 14. Levey A, Stevens L, Schmid C, Zhang YL, Castro A, et al. (2009) A new equation to estimate glomerular filtration rate. Ann Intern Med 150: 604–612. 15. Stevens L, Schmid C, Greene T, Zhang YL, Beck G, et al. (2010) Comparative performance of the CKD Epidemiology Collaboration (CKD-EPI) and the Modification of Diet in Renal Disease (MDRD) Study equations for estimating GFR levels above 60 mL/min/1.73 m2. Am J Kidney Dis 56: 486–495. 16. KDIGO (2013) Definition, identification, and prediction of CKD progression.
Kidney Int 61: 63–72.
17. Stevens L, Claybon M, Schmid C, Chen J, Horio M, et al. (2011) Evaluation of the Chronic Kidney Disease Epidemiology Collaboration equation for estimating the glomerular filtration rate in multiple ethnicities. Kidney Int 79: 555–562.
18. Hsu C-C, Hwang S-J, Wen C-P, Chang H-Y, Chen T, et al. (2006) High prevalence and low awareness of CKD in Taiwan: a study on the relationship between serum creatinine and awareness from a nationally representative survey. Am J Kidney Dis 48: 727–738.
19. Orita Y, Gejyo F, Sakatsume M, Shiigai T, Maeda Y, et al. (2005) [Estimation of glomerular filtration rate by inulin clearance: comparison with creatinine clearance]. Nihon Jinzo Gakkai Shi 47: 804–812.
20. Praditpornsilpa K, Townamchai N, Chaiwatanarat T, Tiranathanagul K, Katawatin P, et al. (2011) The need for robust validation for MDRD-based glomerular filtration rate estimation in various CKD populations. Nephrology, dialysis, transplantation 26: 2780–2785.
21. Altman DG, Gardner MJ (1988) Calculating confidence intervals for regression and correlation. Br Med J (Clin Res Ed) 296: 1238–1242.
22. Carstensen B (2010) Comparing methods of measurement: Extending the LoA by regression. Stat Med 29: 401–410.
23. Seel RT, Steyerberg EW, Malec JF, Sherer M, Macciocchi SN (2012) Developing and evaluating prediction models in rehabilitation populations. Arch Phys Med Rehabil 93: S138–153.
24. Delanaye P, Pottel H, Botev R, Inker LA, Levey AS (2013) Con: Should we abandon the use of the MDRD equation in favour of the CKD-EPI equation? Nephrol Dial Transplant 28: 1396–1403; discussion 1403.
25. Barchard KA (2012) Examining the reliability of interval level data using root mean square differences and concordance correlation coefficients. Psychol Methods 17: 294–308.
26. Atkinson G, Nevill AM (1998) Statistical methods for assessing measurement error (reliability) in variables relevant to sports medicine. Sports Med 26: 217– 238.
27. Zou GY (2007) Toward using confidence intervals to compare correlations. Psychol Methods 12: 399–413.
28. Gilchrist J (2009) Weighted 262 kappa coefficients: recommended indices of diagnostic accuracy for evidence-based practice. J Clin Epidemiol 62: 1045– 1053.
29. Burnham KP, Anderson DR, Huyvaert KP (2011) AIC model selection and multimodel inference in behavioral ecology: some background, observations, and comparisons. Behav Ecol Sociobiol 65: 23–35.
30. Wagenmakers EJ and Farrell S (2004) AIC model selection using Akaike weights. Psychon Bull Rev 11: 192–196.
31. Moons KG, Kengne AP, Grobbee DE, Royston P, Vergouwe Y, et al. (2012) Risk prediction models: II. External validation, model updating, and impact assessment. Heart 98: 691–698.
32. Bleeker SE, Moll HA, Steyerberg EW, Donders AR, Derksen-Lubsen G, et al. (2003) External validation is necessary in prediction research: a clinical example. J Clin Epidemiol 56: 826–832.
33. Ludbrook J (2010) Confidence in Altman-Bland plots: a critical review of the method of differences. Clin Exp Pharmacol Physiol 37: 143–149.
34. Royston P, Altman DG, Sauerbrei W (2006) Dichotomizing continuous predictors in multiple regression: a bad idea. Stat Med 25: 127–141. 35. Bennett ND, Croke BFW, Guariso G, Guillaume JHA, Hamilton SH, et al.
(2013) Characterising performance of environmental models. Environ Modell Softw 40: 1–20.
36. Madero M, Sarnak M (2011) Creatinine-based formulae for estimating glomerular filtration rate: is it time to change to chronic kidney disease epidemiology collaboration equation? Curr Opin Nephrol Hypertens 20: 622– 630.
37. Silveiro SP, Araujo GN, Ferreira MN, Souza FD, Yamaguchi HM, et al. (2011) Chronic Kidney Disease Epidemiology Collaboration (CKD-EPI) equation pronouncedly underestimates glomerular filtration rate in type 2 diabetes. Diabetes care 34: 2353–2355.
38. Rognant N, Lemoine S, Laville M, Hadj-Aissa A, Dubourg L (2011) Performance of the chronic kidney disease epidemiology collaboration equation to estimate glomerular filtration rate in diabetic patients. Diabetes care 34: 1320–1322.
39. Kong X, Ma Y, Chen J, Luo Q, Yu X, et al. (2013) Evaluation of the Chronic Kidney Disease Epidemiology Collaboration equation for estimating glomerular filtration rate in the Chinese population. Nephrology, dialysis, transplantation 28: 641–651.
40. Ott NT (1975) A simple technique for estimating glomerular filtration rate with subcutaneous injection of (125I)lothalamate. Mayo Clin Proc 50: 664–668. 41. Israelit AH, Long DL, White MG, Hull AR (1973) Measurement of glomerular
filtration rate utilizing a single subcutaneous injection of 125I-iothalamate. Kidney Int 4: 346–349.
42. Tessitore N, Lo Schiavo C, Corgnati A, Previato G, Valvo E, et al. (1979) 125I-iothalamate and creatinine clearances in patients with chronic renal diseases. Nephron 24: 41–45.
43. Dai S-S, Yasuda Y, Zhang C-L, Horio M, Zuo L, et al. (2011) Evaluation of GFR measurement method as an explanation for differences among GFR estimation equations. Am J Kidney Dis 58: 496–498.