UNIVERSIDADEdaMADEIRA
REMOTEPRESENCE
Supporting deictic gestures through a handheld multi-touch deviceClinton Luis Jorge
(Licenciado)
Tese Submetida à Universidade da Madeira para a
Obtenção do Grau de Mestre em Engenharia Informática
SUPERVISORS and RESEARCH PARTNERS
Supervisor: Professor Doctor Jos van Leeuwen
Haagse Hogeschool, Academie voor ICT & Media;
Former Professor of the Dep. de Matemática Engenharias da Universidade da Madeira;
Former Vice-‐president of Research and Finances, Associate Professor, Madeira-‐Interactive Technologies Institute.
Internship: Madeira-‐Interactive Technologies Institute.
Research partner: Alcatel-‐Lucent Bell Labs
Copernicuslaan 50 -‐ 2018 Antwerpen -‐ Belgium
CO-‐supervisor: Doctor Dennis Dams
Senior researcher, Visual Communications Bell Labs, Belgium.
CO-‐supervisor: Ir. Jan Bouwen
ABSTRACT
[English]
This thesis argues on the possibility of supporting deictic gestures through handheld multi-‐ touch devices in remote presentation scenarios. In [1], Clark distinguishes indicative techniques of placing-‐for and directing-‐to, where placing-‐for refers to placing a referent into the addressee’s attention, and directing-‐to refers to directing the addressee’s attention towards a referent. Keynote, PowerPoint, FuzeMeeting and others support placing-‐for efQiciently with slide transitions, and animations, but support limited to none directing-‐to. The traditional “pointing feature” present in some presentation tools comes as a virtual laser pointer or mouse cursor. [12, 13] have shown that the mouse cursor and laser pointer offer very little informational expressiveness and do not do justice to human communicative gestures. In this project, a prototype application was implemented for the iPad in order to explore, develop, and test the concept of pointing in remote presentations. The prototype offers visualizing and navigating the slides as well as “pointing” and zooming. To further investigate the problem and possible solutions, a theoretical framework was designed representing the relationships between the presenter’s intention and gesture and the resulting visual effect (cursor) that enables the audience members to interpret the meaning of the effect and the presenter’s intention.
Two studies were performed to investigate people’s appreciation of different ways of presenting remotely. An initial qualitative study was performed at The Hague, followed by an online quantitative user experiment. The results indicate that subjects found pointing to be helpful in understanding and concentrating, while the detached video feed of the presenter was considered to be distracting. The positive qualities of having the video feed were the emotion and social presence that it adds to the presentations. For a number of subjects, pointing displayed some of the same social and personal qualities [2] that video affords, while less intensiQied.
The combination of pointing and video proved to be successful with 10-‐out-‐of-‐19 subjects scoring it the highest while pointing example came at a close 8-‐out-‐of-‐19. Video was the least preferred with only one subject preferring it.
We suggest that the research performed here could provide a basis for future research and possibly be applied in a variety of distributed collaborative settings.
ABSTRACT
[Português]
Nesta tese argumenta-‐se a possibilidade de suportar gestos dêiticos por meio de dispositivos
multi-‐touch no contexto de apresentações remotas. Em [1], Clark considera duas técnicas
indicativas: ‘colocar para’ (placing-‐for)—o referente é colocado no campo de atenção do destinatário—e ‘dirigindo a’ (directing-‐to)—dirige a atenção do destinatário para o referente. Ferramentas como o Keynote, PowerPoint e FuzeMeeting suportam o ‘placing-‐for’ eQicientemente, contendo transições de slides, possibilidade de animação, entre outros, mas apresentam um suporte muito limitado da técnica indicativa ‘directing-‐to’. Relativamente ao recurso ‘apontar’, tradicionalmente disponível como ponteiro laser ou cursor de rato, artigos [12] e [13] mostram que oferecem muita pouca expressividade e não fazem justiça aos gestos comunicativos humanos. Foi desenvolvido um protótipo para iPad com o intuito de testar o conceito de ‘apontar’ em apresentações remotas. Este permitia a visualização e navegação pelos slides, assim como apontar e fazer zoom.
Para entender melhor o contexto de pesquisa, um framework teórico foi concebido para representar as relações entre a intenção do apresentador e respectivos gestos e o efeito visual resultante (cursor) que permite aos membros da audiência a possibilidade de interpretar o signiQicado do efeito e qual a intenção do apresentador. Foi também realizado um estudo qualitativo ao qual se seguiu um estudo on-‐line, mas de natureza quantitativa. Os resultados revelaram que os utilizadores reconhecem a acção de apontar como útil, tanto na concentração como na compreensão do material apresentado, enquanto que, no vídeo do apresentador foi considerada uma distracção. No exemplo da apresentação contendo ‘vídeo’, as qualidades positivas revelaram-‐se ser a emoção e presença do apresentador mais facilmente perceptivas, no entanto, essas mesmas percepções foram igualmente observadas no exemplo de apresentação que continha o gesto de apontar—consistentes com outras pesquisas—contudo longe dos resultados que o vídeo expõe. Em conclusão, o exemplo que combinava o apontar e o vídeo provou ser mais bem sucedido com dez de 19 votos, enquanto que, a apresentação ‘apontar’ obteve oito de 19 votos. Tornando assim, a menos votada, a apresentação ‘vídeo’ com apenas um utilizador a preferi-‐la.
ACKNOWLEDGMENTS
I would like to express my deepest appreciation to my thesis supervisor Dr. ir. Jos P. van Leeuwen for his support and guidance throughout the two internships and the thesis. His immense knowledge in Human-‐Computer Interaction and design, helped me realize the importance of the recognizing the details, and justifying any and all design decisions.
I would like to thank Dr. ir. Dennis Dams from Bell Labs for his friendship, guidance and unique approach to complex problems. I appreciate his abstract thinking and drive for simple, usable solutions.
In addition I would like to thank Jan Bouwen, research director at Visual Communications Bell Labs, and colleagues, for their friendship and support with the project. Their expertise and drive for research and new technologies were eye opening.
I would like to express my gratitude towards António Temes, administrator of Madeira-‐ Interactive Technologies Institute for his support in affording me the possibility of the internship.
TABLE-OF-CONTENTS
1. PRE-STUDY PHASE
1
1.1.
Introduction
1
1.2.
The SlideWorld project
1
1.3.
Initial research and exploration
2
User needs, goals and expectations 2
Interviews and Questionnaires 5
1.4.
Project constraints and initial design
5
Project Constraints 5
Persona 6
Scenarios 6
1.5.
Activity Modeling
7
Role Map 7
Role Profiles 8
Chairperson 8
Meeting Journey Map 9
Meeting phases 9
1.6.
Conceptual Architecture Map
10
1.7.
Ideal scenario
11
1.8.
Activity mapping and descriptions
11
Activity map 11
Performance map 11
Activity Modeling 12
1.9.
State-of-the-art
12
Introduction 12
Approach 13
Research Method 13
State-of-the-art analysis 16
State-of-the-art conclusion 16
Project opportunities 19
1.10. User needs study
20
Introduction 20
Why perform a User Needs study? 20
Project setting and usage context 20
User Needs analysis 22
User Needs Conclusion 22
1.11. Conclusion
23
2. INTRODUCTION
25
3. STATE-OF-THE-ART
29
3.1.
Literature review
29
Introduction to Grounding in Communication and Least Collaborative Effort Mechanisms 29
The psychology behind the pointing gesture 31
Directing-to and placing-for, two basic techniques for indicating (pointing) 32
3.2.
State-of-the-art
34
Funky wall 34
A system that explores a multimodal fusion of pen, speech and 3D gestures 34
The Effects of Remote Gesturing on Distance Instruction 35
Magnification for Distance Pointing 36
Gaze Awareness and Interaction Support in Presentations 36
Direct interaction with large-scale displays from a distance 37
Pointing Gesture Recognition based on 3D-Tracking of Face, Hands and Head Orientation 38
Keynote for iPad 39
Fuse Meeting for iPad 39
3.3.
Two representative scenarios
40
3.4.
Discussion
42
3.5.
Conclusions
42
4. RESEARCH QUESTION
43
5. THEORETICAL FRAMEWORK
45
5.1.
Introduction
45
5.2.
Overview
45
5.3.
Intent: Presenter
46
Summary 46
Approach 46
5.4.
Gesture: Presenter
46
Summary 46
Approach 46
5.5.
Effect: Computer designed
46
Summary 46
Approach 47
5.6.
Perception: Audience
47
Summary 47
Approach 47
5.7.
Conclusion
47
6. METHODOLOGY
49
7. RESEARCH ACTIVITIES
51
7.1.
The creative/design activity
51
RemotePresence Prototype 57
Second Design Iteration: Designing the cursors 59
Understanding gestures and effects 60
Initial Research Spectrum 60
SlideWorld integration and Metadata Aggregator 61
7.2.
The evaluation activity
62
User Needs 62
Research 63
Revising the Research Spectrum 63
Second Design Iteration of the User Study 65
Conference Observations 66
Intent to Gesture User Experiment 68
Final Research Spectrum Map 73
RemotePresence Theoretical Framework 74
The Hague user experiment 75
Online User Experiment 87
8. DESIGN ITERATIONS
93
8.1.
Metadata aggregator and gestures
95
8.2.
Conclusion
100
9. DISCUSSION
101
10. FUTURE WORK
103
10.1. Context and semantic aware pointer
103
10.2. Adaptive pointing
103
11. CONCLUSION
105
LIST-of-FIGURES
Figure 1. Abstraction of a slide presentation containing a presenter and audience. 3
Figure 2. High-level diagram of a live presentation representing interactions, goals and artifacts. 3
Figure 3. High-level diagram of a remote presentation (video-conferencing) representing goals and
communication channels. 4
Figure 4. Diagram displaying early brainstorming results relating to user roles. 4
Figure 5. One-to-many scenario devised for SlideWorld approached by the French team. 6
Figure 6. Many-to-many scenario devised for SlideWorld approached by the Belgium team. 7
Figure 7. Role map for SlideWorld representing the three identified actors and their roles. 7
Figure 8. Journey map of a presentation divided into phases, displaying the activities that each user
role undertakes within each phase. 9
Figure 9. Abstract architecture for the centralized repository concept for SlideWorld 10
Figure 10. Activity map for SlideWorld showing the activities that take place during a meeting. 11
Figure 11. Performance map for SlideWorld displaying the tasks associated to activities. 12
Figure 12. Activity Model for SlideWorld relating tasks to activites and activities to user roles, all divided
into the four phases of a presentation. 12
Figure 13. Example of the 7-point star feature overview map used for each analyzed state-of-the-art. 14
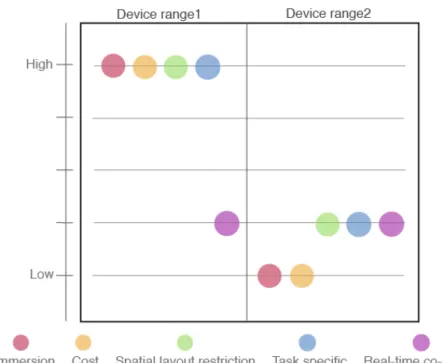
Figure 14. Example diagram representing feature and characteristic comparison of two devices ranges 16
Figure 15. Superimposing of all the analyzed state-of-the-art applications and services. 17
Figure 16. Most direct RemotePresence competitor’s overview score, side-by-side. 18
Figure17. Word Cloud map of the most prominent features and characteristics within the studied cases. 18
Figure 18. RemotePresence usage context and problem setting mapping. 21
Figure 19. State-of-the-art’s approach to some identified user needs. 22
Figure 20. Replaying: visual feedback displaying all gestures made in the presentation semitransparent on the mood board [An Interactive Support Tool to Convey the Intended Message in Asynchronous
Presentations] 34
Figure 21. Schematic of the gesture projection system [The Effects of Remote Gesturing on Distance
Instruction] 35
Figure 22. a) Linear circular magnification; b) Fish eye magnification; c) Widget magnification
[Magnification for Distance Pointing] 36
Figure 23. Left, presenter view. Right, audience view [Gaze Awareness and Interaction Support in
Figure 24. Left, a schematic of existing large display interactive systems. Right, an example of direct interaction [Direct interaction with large-scale displays using infrared laser tracking devices] 37
Figure 25. Different approaches for estimating the pointing direction [Pointing Gesture Recognition based on 3D-Tracking of Face, Hands and Head Orientation] 38
Figure 26. Left instruction screen and pointing cursor selection. Right, a slide being pointed at by the presenter (red shape) [http://www.zentropysoftware.com/ZS/Pointer.html] 38
Figure 27. A slide demonstrating Keynotes pointing feature [http://www.macworld.com/article/
151359/2011/05/ipadkeynote.html] 39
Figure 28. A slide demonstrating Fuse Meeting’s pointing feature [screen shot from Youtube video: Fuze
Meeting with Multi-Party HD Video Conferencing] 39
Figure 29. Left, presenter hold a physical laser pointer. Right, presenter is now required to point out individual referent and uses the laser pointer [screenshots from a reordered video presentation: http://
iaomt.media.fnf.nu/2/skovde_2011_me_kroniskt_trotthetssyndrom] 40
Figure 30. A closeup to the real slide projection and presenter’s laser pointer being captured by a video camera [screenshots from a reordered video presentation: http://iaomt.media.fnf.nu/2/
skovde_2011_me_kroniskt_trotthetssyndrom] 41
Figure 31. Speaker interacts directly with his content in a large multi-touch screen display [screenshot of a video presentation: http://edition.cnn.com/video/#/video/bestoftv/2011/05/03/
ac.foreman.inside.seals.cnn?iref=allsearch] 41
Figure 32. Theoretical framework for RemotePresence that represents the relationship between a presenter and the audience within a remote presentation 45
Figure 33. RemotePresence’s 6-month methodology timeline 49
Figure 34. Initial broad scope of features, concepts and ideas, that could have been pursued by
RemotePresence. 51
Figure 35. Pointing in SlideWorld, triggering attentional focusing events (e.g. enlarging bullet points). 52
Figure 36. Pointing in SlideWorld as a presenter’s tool for interacting and performing actions on content. 52
Table 1. Overview of semiotics for multi-touch gestures 53
Table 2. Overview of standardized gestures for the iPad 55
Figure 37. The user-defined gesture set. Gestures depicted as using one finger could be performed with 1-3 fingers. Gestures not depicted as occurring on top of an object are performed on the background region of the surface or full-screen object [An Interactive Support Tool to Convey the Intended
Message in Asynchronous Presentations] 56
Figure 38. Left, RemotePresence prototype zoomed in slide. Right, slide displaying visual gesture
representations 58
Figure 39. RemotePresence’s in-frame and out-frame interaction areas 59
Figure 40. Second iteration over RemotePresence pointing cursors 60
Figure 41. The research spectrum. 61
Figure 42. RemotePresence’s initial theoretical framework 62
Figure 43. RemotePresence’s research spectrum displaying indicative gestures and two new user
triggered events. 63
Figure 44. RemotePresence’s research spectrum, relating the exposure of information to the amount of
meaningful information transmitted. 64
Figure 45. Initial sketch demonstrating the design of the user experiment, the three examples and viewing
orders. 65
Figure 46. Three topics (sections of a presentation) to be shown by three examples randomly to users. 65
Figure 47. Observations by a speaker at a conference: Left, open hand indicative gesture. Right,
index-finger pointing. 67
Figure 48. Observations performed by a speaker at a conference: Left, speaker standing behind a desk where the ipad was located. Right, speaker interacting with the iPad and the pointer cursor visible
on slide projection. 67
Figure 49. Layout of the main stage of the CHI Sparks conference. Presenters used a physical laser
pointer to direct addressees attention. 68
Figure 51. Results from Marc’s user test. Left, results from slide 3. Right, results from slide 4. 69
Figure 52. Resulting overlay of the 12 subjects resulting gestures for slide 1. 70
Figure 53. Resulting overlay of the 12 subjects resulting gestures for slide 2. 71
Figure 54. Resulting overlay of the 12 subjects resulting gestures for slide 3. 71
Figure 55. Resulting overlay of the 12 subjects resulting gestures for slide 4. 72
Figure 56. Diagram displaying the cursor persistency and relating quantity of information. Research focus
represented as the white area. 73
Figure 57. Final theoretical framework diagram for RemotePresence including the notions of common
ground and least collaborative effort mechanisms. 74
Figure 58. Example of a repertory grid matrix for testing how user perceive nine different sites related to
seven constructs. 76
Figure 59. The The Hague user study process flow that each subject followed. 77
Figure 60. Just’s resulting repertory grid matrix 78
Figure 61. Repertory Grid experiment results: Highest scoring elements per’ subject divided by male and
female 79
Figure 62. Overall results of the Repertory Grid experiment for male and female combined. 80
Figure 63. Overall results for the semi-structured interview divided by male and female, displaying element preference, the usefulness of pointing, and which element was easiest to follow the
Figure 64. Overall results for male a female combined from the interview 82
Figure 65. Element results for each group 84
Figure 66. Element results for each group from the Repertory Grid technique 85
Figure 67. Online experiment results: Highest scoring elements sorted by male and female subjects. 88
Figure 68. Overall online experiment results (highest) sorted by the three examples. 88
Figure 69. Amount of undecided votes of individual constructs sorted by male and female. 89
Figure 70. The scoring of five chosen constructs, relating to each example’s influence. 90
Figure 71. RemotePresence defined gestures for the indicative techniques of directing-to and
placing-for. 93
Figure 72. RemotePresence design guidelines relating defined effects to associated effects. 94
Figure 73. Sticky cursor representation 96
Figure 74. Multiple Sticky cursor representation and contextual menu 97
Figure 75. Drag cursor representation 97
Figure 76. Touch cursor representation 98
Figure 77. Region cursor representation 98
Figure 78. Shape cursor representation 99
Figure 79. Highlight cursor representation 99
PREFACE
The following thesis combines research from two internships undertaken over a one-‐year period. The Qirst, a 3-‐month summer internship with Madeira Life project, Madeira Tecnopolo, Portugal in 2010, and another 6-‐month internship at Bell Labs Belgium and M-‐ITI in 2011. The 3-‐month summer internship as part of the Madeira Life project from Madeira Tecnopolo, started in July 2010 at Alcatel-‐Lucent Bell Labs, Belgium. For the Qirst month I was introduced to a Bell Labs’s Visual Communication’s department brand new project, entitled, SlideWorld. This was an excellent opportunity for myself to be able to follow a “real-‐life” project right from the beginning and provide some fresh-‐out-‐of-‐university knowledge in Human-‐Computer Interaction methodologies. The project was an collaborative effort between two Bell Labs departments, Visual Communications Belgium and HyperMedia France. During this time, I applied HCI methodologies for the Belgium’s part of the project. This approach and methodologies were different to how the department was used to approach new projects. SlideWorld was ideated from the desire of creating an evolution from current slideshow presentation tools, in the sense that through different technologies (face detection and tracking) “ it would be possible for remote presentations to become more engaging and less boring to the audience”.
SlideWorld was divided into two scenarios: the one-‐to-‐many scenario, approached by the French team, and the many-‐to-‐many scenario, by the Belgium team.
My role within the Belgium team was to perform initial research, state-‐of-‐the-‐art, conceptualization and user needs analysis, as a stepping stone for Bell Labs future work. At the end of my stay at Bell Labs, there was sufQicient research to continue the internship for the next 2-‐months back at M-‐ITI, Portugal.
RemotePresence was ideated from the past Internship at M-‐ITI/Bell Labs Belgium. February 2011, I returned to Bell Labs for a 6-‐month period to continue and explore a new concept or research project for SlideWorld and to be used as my masters thesis.
On arrival at Bell Labs, the project proposal (just a formality) was discarded and a series of brainstorming sessions and meetings were devised in order to discover some new and interesting (and hopefully unexplored) research area within remote slide presentations to explore.
Findings from the past internship identiQied remote presentations as lacking inter-‐participant interaction and collaboration. We argue that the iPad—a handheld multi-‐touch device—has the necessary affordances to make this activity more engaging and interactive.
After deQining abstractly the project, I led the project with assistance from two supervisors, Dr. Dennis Dams and Dr. Jos van Leeuwen.
1. PRE-STUDY PHASE
1.1.
Introduction
Evermore, companies are opting for teleconferencing as a means for performing remote meetings. As the internet becomes evermore ubiquitous and faster, a multiplicity of high quality audio and video feeds become available. Increasingly, knowledge workers work outside the traditional ofQice, and more and more teams are distributed over multiple physical locations. By employing distributed employees, companies do not need to pay employees travel fees, book hotels for meetings, etc. Company's may employ whoever they would like, where ever they are, this opens the doors for remote collaboration.
In collocated meetings, the chairperson, i.e. someone who leads the meetings, books the rooms, and invites participants. Participants, then reply to the invitation and attend physically the meeting at the scheduled date and time. At location, participants sit around a table (normally U-‐shaped) and discourse over a topic mediated by the chairperson.
As mentioned before, evermore distributed teams require distributed meetings and presentations. Participants, may now attend meetings from home, from another company, or continent. The technology for this remote communication has been available for many years now, but things get tricky when participants need to collaborate or co-‐author media in real-‐ time. One of the aspects of collaboration, could be the scenario involving a slide presentation and discussion. The common tools used for these remote presentations are very basic in nature displaying solely the slides being presented, the presenter’s voice, and in some cases a video feed of the presenter in a small box—except for high end and high cost dedicated systems and rooms for the occasion.
Participants tend to become easily bored during these remote presentations. Inter-‐participant communication is extremely limited or inexistent, managing q&a sessions during or after the presentation are difQicult to synchronize and mediate.
Queue in SlideWorld. SlideWorld is Alcatel-‐Lucent Bell Labs approach to remote presentations with the main objective of ending boring presentations, by integrating new technologies and affording a more “natural” engaging form for presenting content remotely. This pre-‐study phase chapter enumerates the approaches and contributions done towards the SlideWorld project. Throughout the project diverse methodologies, from Human-‐Computer Interaction, Human Computer Software Engineering and Service Design were applied. This ‘mix’ of methodologies afforded an interesting overview and understanding of the problem setting, and helped deQine the scenarios.
1.2.
The SlideWorld project
Some higher end dedicated systems, afford a more immersive and engaging experience, but they require speciQic rooms with high cost equipment that offer no scalability.
SlideWorld is a new project ideated from an identiQied undesirable issue that occurs in presentations especially remote distributed presentations: people get bored.
Initially, there was no deQined user target demography, thus required a broad exploration of the problem context in pursue of an interesting feasible scenario. During initial research into presentations in combination with discussions with Visual Communication department colleagues, two interesting but somewhat different scenarios where identiQied in which SlideWorld could positively make a difference:
One of the scenarios was nominated the one-‐to-‐many. This scenario was identiQied from the need that a single presenter could have while presenting to a local or remote audience. How could viewing the presentation remotely be more engaging and exciting than what is offered by current presentation tools? This scenario would be approached by the Bell Labs Villarceaux, France, Hypermedia team.
The second scenario was nominated many-‐to-‐many. This scenario considers group meetings. A collocated group presenting and discoursing with another remotely collocated group of colleagues. This scenario tends to be more interactive and engaging for the participants. Our interest resides in bringing these two groups together in a way that affords them to collaborate in real time, contribute, and share information easily. This is the scenario being elaborated in this pre-‐study phase, being approached by myself and the Bell Labs Visual Communications Team, Antwerp, Belgium.
1.3.
Initial research and exploration
The initial research consisted of closed set of semi-‐structured interviews with Alcatel-‐Lucent employees, consultation of relevant literature on public presentations, public speakers, good practices in presenting, presenter’s needs, live audiences, remote audiences, video-‐ conferencing issues and relevant tools. Further research were performed as live observations —including a full day observation of a live remote meeting between Villarceaux and Antwerp.
User needs, goals and expectations
The presenter’s main goal, is to successfully transmit his message to an audience in a simple and effective manner. IdentiQied presenter needs include: controlling the presentation, navigation through the media; being heard and seen with enough quality to be understood; as well as, necessary feedback (time and audience engagement). The feedback that the presenter receives from the audience is important to him. Looking at the audience and assessing their interest through facial expressions, body language, and gestures, provide him with the necessary feedback to be able to adjust his presentation and regain audience attention.
The audience members also have needs, goals and expectations. They attend presentations to learn more about a certain topic, to listen to an expert in a certain area transmitting his message, and to be somewhat “entertained.”
Figure 1. Abstraction of a slide presentation containing a presenter and audience.
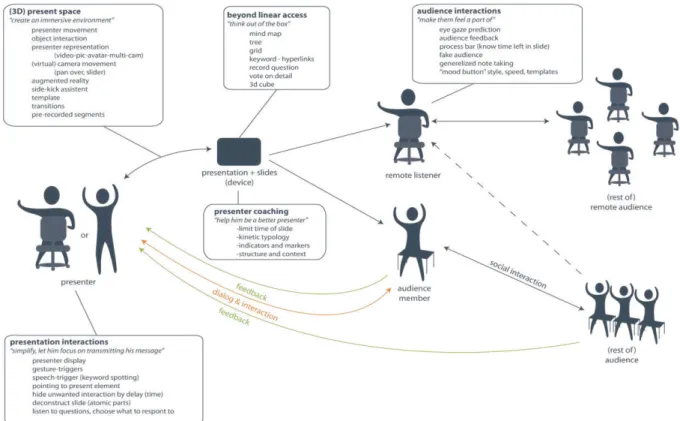
Figures 2 and 3, identify some key user needs and goals as well as how participants interact amongst themselves. BeneQits that occur in one context and not the other are highlighted in green.
Figure 2 features a summary of interactions, tools, user roles and goals for a collocated slide presentation. The presenter uses some common artifacts to transmit his message. He traverses through a preparation phase and is able to use himself as a medium for communication (deictic gestures, etc). The presenter has his own set of goals (as participants have their). At the bottom of Qigure 2, we are able to see the Qlow of information (feedback from the audience (A) to the presenter (P), the presenter then reacts accordingly).
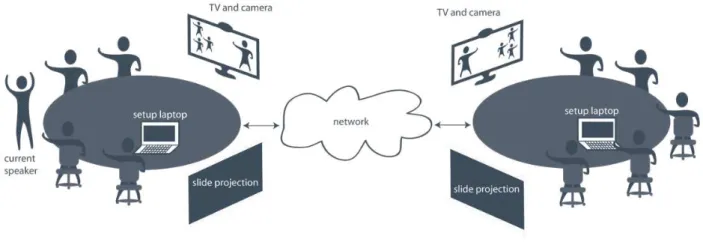
Figure 3 tries to replicate the meaning of Figure 2 this time for remote presentations. It is possible to identify the differences among them especially, when it comes to communication and feedback. Current systems or tools that support remote presentations do not offer any natural means of audience feedback. I.e. the presenter does not have an overview of every participant (for larger groups) and their interactions (personal or with other participants). Mostly, the audio channel is unidirectional, therefore it is increasingly difQicult for the presenter to get feedback from his audience about the presentation thus he does not perceive if the audience if following the presentation and allow him to perform the necessary repairs to help them understand or regain their attention.
Figure 3. High-level diagram of a remote presentation (video-conferencing) representing goals and communication channels.
Figure 4 features the results of a brainstorming session perform by the Visual Communications department—performed a week before my arrival—that was reQined, Qiltered and mapped accordingly to the role or artifact in the diagram.
Interviews and Questionnaires
The semi-‐structured interview and questionnaire’s objective was to build a persona and revise scenarios, that could help the communication between both teams (Belgium and French) and focus the research to speciQic users and settings.
Seven participants with ages between 21-‐49 working at Bell Labs as researchers responded the questionnaire:
• Demographics • Background • Current activity
• Attending presentation • Presenting material
Research results:
A typical collocated presentation was considered to be a small group of individuals were a presenter uses a laptop and projector to display a slide presentation. A “U” shaped sitting layout was the most common result, where audience members remained seated facing the presenter standing next to the screen (projection).
Most of the interviewed individuals preferred a more interactive role where they where audience members of a presentation. They disliked slide presentations that contain too much text, an inexperienced speaker or a speaker that does not interact with his presentation or audience. What they liked about presentations was the presenter’s interaction with the local audience, the presentation’s appearance, its content and the possibility to interaction with colleagues (more in small groups, less in larger groups and less with remote colleagues). When questioned about taking on a presenter role, the interviewees showed notions of good presenters practices such as: presentation story should be Qluent; well practiced; reviewing; and interaction with the audience that consists on looking more towards the audience than the screen. Using gestures to enhance presentation, adapt presentation according to feedback, Q&A, approach the person who is asking the question and pointing are key practices.
Some issues identiQied such as, slide synchronization with remote viewers, the need to edit on the Qly and the difQiculty in setting up devices and connections.
This initial research study helped identify the essential aspects of presentations providing a more concrete understanding of the ground level that we could build on.
1.4.
Project constraints and initial design
Project Constraints
The following project constraints were deQined by upper Bell Labs management:
• Presentation can be formal (CEO presentation) or informal (remote group meetings) • Presentation is live (not recorded and seen ofQline)
• Maximal inscription and minimal subscription (with minimal cultural/social
interference)
• Showcase the contribution of the project in the deQined context, as a more efQicient and
effective, bigger, faster, better, greener technology.
• BeneQits of the project as compared to existing solutions are shown through scenarios. • Aim at showcasing a working prototype, focusing on the user experience.
• Target the development for everyday devices.
• Instead of changing the user’s devices, change the way they interact with them to
afford a more natural and intuitive support to their activity.
Persona
“Bert,” our persona was based on the information obtained during the previous interviews. This would allow for a more “credible” archetype for the individuals who are working on SlideWorld and see Bert (the persona) as a possible user and design for the persona. E.g. Would Bert beneQit more from feature A or B?
More information of the persona Bert can be found in the appendix.
Scenarios
The two following scenarios (1-‐to-‐many and many-‐to-‐many), Figure 5 and 6, were reQined into these easy to read maps. These two maps were shared with the French Bell Labs team, and from them, both team were able to understand their roles and chosen scenario to work on. These maps representative of the scenarios focus more on the potential users and are still being used by Bell Labs today1. The first two scenarios (1-to-many and many-to-many) based on the
initial research and incorporate the persona can be found in the appendix
The Qirst scenario (see Figure 5) represents a formal presentation as if a CEO of a large company were to present to stakeholders while the many-‐to-‐many scenario represents a more informal, interactive, inter-‐group meeting. This is the scenario that was addressed during the M-‐ITI internship (see Figure 6).
Figure 5. One-to-many scenario devised for SlideWorld approached by the French team.
Figure 6. Many-to-many scenario devised for SlideWorld approached by the Belgium team.
1.5.
Activity Modeling
For a deeper understanding of the research context and scenarios, a Human Computer Software Engineering methodology was used, the activity modeling. Within Activity Modeling, a role map of possible SlideWorld users and their relationships can be seen in Figure 7. Users who interact with the system are referred to as actors (Participant and Staff). An Actor can subsequently play a role (or multiple roles) in multiple activities. A user role (Chairperson, Technical Facilitator, and others) is an abstraction representing a relationship between user and system. Roles represent the user-‐participant perspective within activities: needs, interests, expectations and behaviors. A role may be played by more than one actor.
A typical application involves distinct roles representing the various relationships a user can assume in interaction with the application. As seen in Figure 7, a Participant (actor) may have a multiplicity of distinct roles. He may take on the role of a Collocated participant, Remote participant, Isolated participant or Reader. Each of these roles take on different activities within the system’s context (and subsequently different Tasks). E.g. a Collocated participant may perform activities through different artifacts that differ from those performed by an Isolated participant.
Role Map
Role Profiles
User Roles are played by Actors within activities. User ProQiles include extra information about the activities. The content of this revised Role ProQile is organized under three headings: Activity, Background and Characteristics.
An Activity refers to the activity within the role is played. It is described in terms of: purpose; physical and social context; and participation (including salient artifacts).
Background refers to the background characteristics of the performers of the role. Experience, training, education, system knowledge and domain knowledge are some of the characteristics described.
Characteristics refers to performance characteristics, such as frequency, regularity, intensity, complexity and predictability of performance.
Design (the forth rubric), serves as a container for evident design implications considering the Qirst three rubrics to effectively support the role.
Below is the designed user proQile for the “Chairperson” role—for the remaining role profiles please consult the appendix.
Chairperson
Activity: The person who organizes a meeting to discuss project updates, inform colleagues, collaboration sessions, etc. He invites the participants, books the room and manages the meeting’s topics. During the meeting it is he who keeps the order—of discussion—by deciding who should speak and managing the decision making process (e.g. deciding when to vote, how to vote). The Chairperson assigns tasks to the participants, decides what topic should be emphasized, how it should be approached (e.g. Brainstorming session, group activities) and what to do during the meeting.
Background: An individual with experience in the discussed topic and at managing meetings and participants. The chairperson is comfortable with the technologies needed to perform his activities.
Place/Time: Takes place before the meeting: E.g. at his ofQice he might decide about the meeting, organizing the invites, booking the video conferencing room, gathering the initial information about the topic and during the meeting: e.g. in the meeting room where he manages the participants and tasks.
Participation: The chairperson normally decides on the need to hold a meeting or is informed of that need. Before the meeting, it is he who books a video-‐conferencing room and will take care of scheduling, inviting and informing participants of time and date as well as the topic to be discussed during that meeting. He might also provide some initial information— documents (physical or digital)—as the background or introduction to the topics. During the meeting it is he who will manage discussions, keep track of the agenda and tasks to be assigned.
Characteristics/Performance: Depending on the type of meeting or presentation the Chairperson may play his role during the entire meeting or change to a participant role.
making process by providing tools that can efQiciently transition between states (e.g. voting, polling, collaborative work, presentation, etc).
Meeting Journey Map
A User Journey Map provides designers with a visual map of the user’s intents from the initial moment they need to interact with the system or service until the end of the interaction. A journey map is a timeline augmented with user activities and possible touch-‐points (points in time where the user might interact with the system or service).
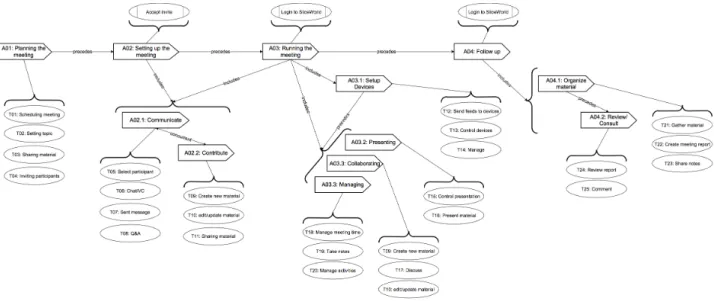
SlideWorld’s journey map (see Figure 8) displays the distinct user roles taking part in activities that occur at different moments in time (phases). This journey map allows us to identify four main phases in the ‘journey’ of holding a meeting and to visually relate user roles to key activities that are taking place during a meeting as well as in what phase these activities are being performed.
As shown in Figure 8, the Chairperson role takes part in phase 1 of the meeting, while the other roles do not. The Reader role, which may be played by various actors, interacts with the system in phase 4. These roles perform different activities and have different needs and interactions related to them.
Figure 8. Journey map of a presentation divided into phases, displaying the activities that each user role undertakes within each phase.
Meeting phases
The identiQied meeting phases are as follows:
During this phase the Chairperson decides on the need for a meeting or presentation. He checks schedules; books a room to hold the meeting, invites participants and staff and shares the meeting topic and initial information.
• Phase 2: Setting up the meeting
During this phase the participants have received their invite or notiQication to the meeting/ presentation. They, if requested, prepare material for the meeting, research about the topic, contribute, and collaborate with colleagues.
• Phase 3: Running the meeting
During this phase the meeting is ongoing. Participants collaborate and discourse over the meetings topic, the devices have been setup for remote collaboration and communication, new materials are being created and interesting ideas registered.
• Phase 4: Follow up
During this phase (that can last indeQinitely) participants can review, access and manage the information generated and shared during the passed meeting. The information can be structured as a document to be shared with others.
1.6.
Conceptual Architecture Map
Figure 9, represents conceptually how user roles could be associated to certain artifacts due to the nature of their inter-‐role interactions.
Figure 9. Abstract architecture for the centralized repository concept for SlideWorld
would be located. The information we consider is everything from slide sets, documents, multimedia, too room location, time and date of the event. One of the motivations for this was to try to minimize the usage of email (asynchronous communication) in organizing and sharing information—before and after the event.
More concretely (as seen in Figure 9, right) the central repository would be divided into meetings or presentations (events in time). For each of these events there would the a repository, list of participants and devices (depending on the room). DLNA was the technology of choice for the connection of new devices due to is wireless nature, easing the setup phase of the devices—versus the traditional: this cable is damaged! Or: Is there a cable for “device A”?
1.7.
Ideal scenario
An ideal scenario was ideated and designed. This scenario includes some initial concepts and brainstorming results into a story. The above user roles and stages (Figure 8) are present as well as the design concept from Figure 9.
The Ideal Scenario is located in the appendix.
1.8.
Activity mapping and descriptions
The above scenario, role map and the journey map, helped revise more concretely the activities and tasks performed by the user roles. This was helpful when approaching the Activity, Performance and Activity Modeling maps.
Activity map
An Activity is a collection of actions or tasks undertaken for some purpose.
An Activity Inventory identiQies the focal activities (involving the system) as well as related activities.
An Activity Map shows the interrelationships among focal and related activities.
Figure 10. Activity map for SlideWorld showing the activities that take place during a meeting.
Performance map
A Task is an action performed by an actor in interaction with the system of reference, for some goal within an activity.
Figure 11. Performance map for SlideWorld displaying the tasks associated to activities.
Activity Modeling
This model displays the performance model with the related roles associated to each task or activity. This provides us with an easy way to perceive which user roles are associated with which activities and subsequently with which tasks.
Figure 12. Activity Model for SlideWorld relating tasks to activites and activities to user roles, all divided into the four phases of a presentation.
1.9.
State-of-the-art
Introduction
Furthermore, the internship provided valuable insight into Bell Labs technologies and technological possibilities, thus introducing the Qirst project constraints and overall goals.
State-of-the-art research on software applications and web-based services
As a Qirst approach, a broad analysis of popular state-‐of-‐the-‐art software and web-‐based services were analyzed. During this initial phase the aim was to identify potential positive characteristics approached by the state-‐of-‐the-‐art, while learning and identifying undesirable features or interactions or un implemented needs.
Approach
We chose to approach the state-‐of-‐the-‐art research by identifying popular communication platforms, project and team management, productivity suites, collaborative environments, sharing and synchronization tools and web-‐based versions of the above. Through this research we intend to understand and identify what makes these applications and services popular and consequently most used and liked by users.
This was done due to the unforeseeable future directions of the project. I.e. we did not know how, when, or if we would be approaching the many-‐to-‐many scenario as part of a larger project. The state-‐of-‐the-‐art research was based on experimentation, consultation of expert application reviewer websites and by consulting written user reviews and opinions. The intent was to obtain a global knowledge of what “others” are developing and providing to users and identify why, which parts and which features or collection of features, make these applications and services popular.
This state-‐of-‐the-‐art research will also allow us to perceive which areas are not fully explored, or that lack functionalities that might enhance the overall user experience. By exploring within this global context, we should be able to identify where (if so) these applications and services achieve our set goal of inter-‐participant interaction, real-‐time collocated and remote collaboration and immersive remote presence.
From the internship and Bell Labs interests, the research will provide more accentuation to the affordances of these application on the iPhone and new iPad devices and cross-‐platform web-‐based applications and collaborative web-‐services.
From here onward we shall dub the ongoing project ‘RemotePresence.’ At this point, RemotePresence was approaching a remote CSCW context. It might seem very general but it was a good eye opener, in the sense of looking at what has been done within the CSCW community.
Research Method
For this state-‐of-‐the-‐art research we deQined our research methodology as following:
• Small introduction to the software or web-‐service with some wireframes and screen shots • A pros (+) and cons (-‐) analysis in context to RemotePresence’s goals
• A SWOT analysis highlighting interesting key features and weaknesses
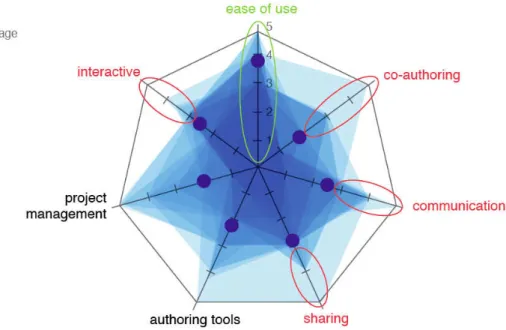
• A brief conclusion and a 7-‐point star feature overview map representing the overall score of the software or service related to RemotePresence’s focus areas
The pros (+) and cons (-‐) section, SWOT analysis and 7-‐point star feature overview map, features and characteristics analysis where relating RemotePresence’s research focus and future direction.
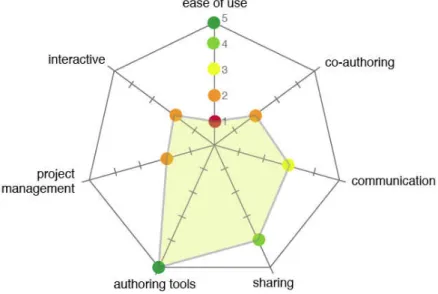
We consider this selection of features, key for focusing on the project’s context and not get sidetracked by a vast number of interesting features that do not fall into RemotePresence’s problem setting. For comparison and an easy visualization of information a 7-‐point star feature overview map (see Figure 13) was designed for each studied case.
Figure 13. Example of the 7-point star feature overview map used for each analyzed state-of-the-art.
An example of the 7-‐point star feature overview map (see Figure 13) displays the 7-‐axis key features and the speciQic value that the studied application or service was provided with for each axis. An overall rating, provided by the size and color on the polygon is created by joining the speciQic value point of each axis and the polygon’s color reQlects the overall rating color similar to the speciQic score on each axis.
The axis values represent key characteristics that RemotePresence has targeted. Rating is provided related to which features and characteristics are offered and available to users and what number of implemented features coexist and integrate.
Ease of use: How easy is it for users to perform and navigate their desired task? 1. Bad. Over complicated to use, cluttered interface, no understandable navigation 2. Poor. Unintuitive, complicated navigation, and interface cluttered
3. Fair. Simple to use, but not well organized 4. Good. Simple to use and easy to navigate
5. Excellent. Everything is well designed, organized, and works as expected
Interactive: How interactive is it for users?
1. Little. Just me, the mouse, and clickable buttons
2. Poor. The normal interaction you would expect from a GUI interface 3. Fair. The application allows me to do more than just type, point and click 4. Good. I can interact with another users or the interface itself is interactive
Project management: Does it provide the necessary tools and features to support project and product management?
1. None.
2. Poor. I just get a calendar and a message board
3. Fair. A number of features, can manage schedules, invite users 4. Good. Complete number features to support the activity
5. Excellent. Supports all the possible tasks needed for the activity
Authoring tools: Does it provide tools for content creation? 1. None.
2. Poor. Provides a basic text editor
3. Fair. Provides a complete writing tool, or features that support the context 4. Good. I can create text documents, presentations, spreadsheets
5. Excellent. I can create almost anything needed to support my activity
Co-‐authoring: Do the applications or services provide users with the possibility to simultaneously author content?
1. None.
2. Poor. I can create some basic text Qiles for others to view
3. Fair. I can create a variety of different Qiles, other may edit asynchronously 4. Good. I can create text documents, presentations, spreadsheets and collaborate
5. Excellent. Create almost anything needed to support my activity and collaborate in real time with live feedback
Communication: What is the level of communication support? 1. None.
2. Poor. Just instant messaging or email
3. Fair. A combination of messages, instant messaging and email facilities
4. Good. Synchronous communication (audio/video) with email or instant messaging
5. Excellent. I can host multi-‐user video conferences, send emails, instant messaging chat rooms, send or post messages
Sharing: Does the application allow users to share information with other users, synchronize multiple devices and centralize access?
1. No.
2. Poor. I can share documents and Qiles via email
3. Fair. I can upload document to a web-‐based storage, and send emails
4. Good. I speciQically share to a user, synchronize my information or share my screen
5. Excellent. I can share through a number of different ways, synchronize all information even on other devices, backup with version revision, send URLs pointing to Qiles, and have a centralized repository.


![Figure 20. Replaying: visual feedback displaying all gestures made in the presentation semitransparent on the mood board [ An Interactive Support Tool to Convey the Intended Message in Asynchronous Presentations ]](https://thumb-eu.123doks.com/thumbv2/123dok_br/15661389.622250/49.892.181.712.341.662/replaying-displaying-presentation-semitransparent-interactive-intended-asynchronous-presentations.webp)
![Figure 22. a) Linear circular magnification; b) Fish eye magnification; c) Widget magnification [ Magnification for Distance Pointing ]](https://thumb-eu.123doks.com/thumbv2/123dok_br/15661389.622250/51.892.92.807.619.832/figure-circular-magnification-magnification-magnification-magnification-distance-pointing.webp)
