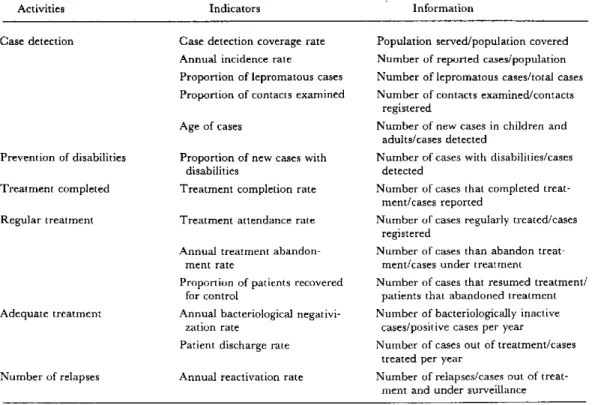
Table 1. Operational indicators for the evaluation of leprosy control programs.
Activities Indicators Information
Case detection Case detection coverage rate Population served/population covered Annual incidence rate Number of reported cases/population
Proportion of lepromatous cases Number of lepromatous cases/total cases Proportion of contacts examined Number of contacts examined/contacts
registered
Age of cases Number of new cases in children and adults/cases detected
Prevention of disabilities Proportion of new cases with Number of cases with disabilities/cases
disabilities detected
Treatment completed Treatment completion rate Number of cases that completed treat-ment/cases reported
Regular treatment Treatment attendance rate Number of cases regularly treated/cases registered
Annual treatment abandon- Number of cases than abandon
treat-ment rate ment/cases under treatment
Proportion of patients recovered Number of cases that resumed treatment/
for control patients that abandoned treatment
Adequate treatment Annual bacteriological negativi- Number of bacteriologically inactive zation rate cases/positive cases per year Patient discharge rate Number of cases out of treatment/cases
treated per year
Number of relapses Annual reactivation rate Number of relapses/cases out of treat-ment and under surveillance
Finally, to provide patients with comprehensive care, the program should include a disability prevention com-ponent. The need to find practical solutions to the pro-blem of disabilities calls for active participation at the primary level of all the pertinent elements so as to ensure that the activity is carefully planned and adapted to the conditions in each country, to the environment, and to
the patients' aptitudes and skills. The early prevention of disabilities is a real problem in Latin America, in partic-ular because of socioeconomic and cultural factors.
(Source.: Leprosy Control Program, Division of Disease Prevention and Control, PAHO.)
Dengue in Puerto Rico
Epidemic dengue type 1 occurred in Puerto Rico during the summer and fall of 1978 as part of the pandem-ic whpandem-ich affected most of the Caribbean region between 1977 and 1980. During 1979, 1980, and the first months of 1981, dengue transmission was sporadic with only a few confirmed cases occurring each month. All viruses isolated during that time were dengue 1. Beginning in late July and early August 1981, the number of reported cases of dengue-like illness began to increase, and by early
Sep-tember it was clear that an outbreak of dengue was in progress. The number of cases increased dramatically in September, peaked in October, and began to decline in November 1981 (Fig. 1). By December, few cases were being reported. Approximately 70 paired sera per week were tested for dengue infection by HI, with an average of 48 per cent confirmation. Cases were reported from all over the island, but the area of highest transmission was the southwest coast.
Figure 1. Reported dengue cases in Puerto Rico by week of onset, 1981.
u
WEEK OF ONSET
Figure 2. Dengue viruses isolated and identified in Puerto Rico, July-December 1981.
o
1-z
o
o
z
m E z
"E DENGUE 1 DENGUE 4
A total of 298 dengue viruses were isolated from pa-tients with onset of illness between 1 July and 31 Decem-ber 1981. Most (220) were identified by complement fixa-tion and/or monoclonal antibody as dengue 1. The distri-bution of these isolates was islandwide, but as might be expected, the majority were from the southwest coast.
Dengue 4 was first isolated in Puerto Rico from a pa-tient with onset in September, although serologic evidence suggested it was on the island as early as August 1981. Transmission of this serotype remained sporadic during October, increased in November, and by December, was the dominant virus isolated in Puerto Rico (Fig. 2). Dengue was reported as increasing again during the first two months of 1982. Nearly 50 per cent of these cases were from the SanJuan metropolitan area and most of the new transmission appeared to be dengue type 4.
Dengue Virus Isolation
The use of specific monoclonal antibodies greatly facili-tated the identification of dengue viruses. Although this
technique can be used to identify dengue viral antigen in mosquito brain squashes, it requires a minimum of six and preferably 12 known positive mosquitoes. This means that most isolates must be passed in mosquitoes at least once after isolation and thus delays the identification process, whether by monoclonal antibody or complement fixation. Although less sensitive, the use of mosquito cell lines to isolate dengue viruses and the subsequent use of monoclonal antibodies to type the viruses requires much less labor and allows processing of larger numbers of samples.
These procedures were initiated during the 1981 dengue epidemic in Puerto Rico. As a part of this transi-tion, three mosquito cell lines, Igarashi's clone C6/36 of Aedes albopictus, A. pseudoscutellaris (AP-61), and Toxorhyn-chites amboinensis (TRA-284) were compared for sensitivity to dengue virus and ease of handling. Cells were grown in either disposable tubes (16 x 125 mm) or in plastic flasks (25 cm2) and simultaneously inoculated with 0.05 ml each of undiluted sera collected from patients in acute phase of dengue-like illness. After a 10-day incubation period at 280C, the cells were spotted on slides, fixed with cold acetone, and processed for virus isolation and identifica-tion using a direct fluorescent antibody test (DFA) for screening and indirect (IFA) with monoclonal antibodies for identification.
The results obtained with 83 sera are shown in Table 1. The AP-61 and TRA-284 lines were most sensitive with 31 and 29 isolates, respectively. Only 25 isolates were ob-tained with the C6/36 cells. It will be noted that some of the viruses isolated in C6/36 and AP-61 cells could not be typed. This was due to the small number of cells infected and the small amount of antigen detectable by DFA but not by the monoclonal IFA. These sera have been inoc-ulated into mosquitoes for confirmation.
In addition to virus isolation rate, the three cell lines were compared with respect to the following criteria: (1) ease of handling and cultivation; (2) brightness of fluores-cence; (3) resistance of sera to toxicity; (4) growth rate in different types of culture vessels; and (5) cost/culture/ specimen. While ease of cultivation was nearly the same for all three cell lines, A. albopictus cells were the best in terms of uniform dispersal of cells (without clumping) on
Table 1. Comparative sensitivity of three mosquito cell lines for isolation of dengue viruses in Puerto Rico.
Number and types of dengue isolates Cell line No. sera
inoculated Dl D4 Unknown Total
C6/36 83 5 16 4 25
AP-61 83 8 21 2 31
TRA-284 83 9 20 0 29
All cell lines 83 9 26 2 37
spot slides. Intensity of fluorescence was similar for all cell lines, but easier to read in C6/36 because the cells were never disrupted. TRA-284 and AP-61 cells were generally more resistant to serum toxicity than A. albopictus cells. While both A. albopictus and AP-61 cells grew well on glass as well as on plastic surface, TRA-284 cells did not grow well on glass tubes. The cost of tube culture was far less expensive than that of plastic culture. These advantages
and disadvantages will be evaluated for the selection of a cell line for routine dengue virus isolation/identification.
(Source: San Juan Laboratories, Center for Infectious Diseases, Centers for Disease Control, San Juan, Puerto Rico, U.S.A.)
Diarrheal Diseases
An Overview of the Situation in the Americas
Diarrheal disease constitutes a clinical syndrome of varied etiology which includes specific infectious diseases such as shigellosis, salmonellosis, amebiasis, as well as other diseases caused by bacteria, protozoa, viruses, and helminths.
In Latin America, these diseases constitute a major public health problem, especially among children under 5 years of age. However, in most countries, it is difficult to determine the extent of the problem accurately. In both urban and rural areas, current clinical and laboratory ser-vices are not always adequate to identify these infectious agents and the etiologies of reported diarrhea episodes are often unknown. Furthermore, the number of cases and deaths reported does not reflect the magnitude of the problem caused by the diseases due to limitations of sur-veillance systems. More specifically, reliable morbidity data for diarrheal diseases are difficult to collect because of reporting constraints characteristic of many national health systems. The coverage and quality of case report-ing varies from country to country and by geographic re-gions within the same country. Other factors which in-fluence the data include the extent to which various popu-lations receive health care services and the completeness of disease surveillance by those services.
Mortality data offer more opportunities for analysis, but similar shortcomings may exist. For example, infant deaths may be underreported and the cause of death may be unknown, inaccurate, or nonspecific. Nevertheless, available mortality data provide some insight into the seriousness of the problem. In interpreting the signifi-cance of mortality data in Tables 1 and 2, it is necessary to
consider the wide variations in data compilation and reporting.
Around 1978, diarrheal diseases1 were among the first and second causes of all deaths in children less than 1 year of age in 20 of 31 countries reporting figures for children between 1 and 4 vears of age.
As shown in Table 1, around 1970 for 20 selected Latin American countries, 69,591 of the 108,627 deaths due to diarrheal diseases2 recorded in children less than 5 years of age were in children under 1, yielding age-specific death rates of 1,346.07 and 456.0 per 100,000 population, respectively.
In Table 2 for the same countries, around 1978, of 80,307 diarrheal deaths reported in children under 5 years of age, 55,672 occurred in the under 1 age group, produc-ing age-specific death rates of 290.2 and 934.0, respec-tively. These figures indicate a 26 per cent decrease in the overall age-specific mortality rate due to diarrheal dis-eases in children under 5 years of age over an eight year period. This decrease in mortality has declined by annual proportions in 18 out of the 20 countries reporting de-tailed information.
Although the 1978 age-specific diarrheal mortality rate in children under 5 was only 5.0 per 100,000 population in North America, the problem was much more acute in the Caribbean and in Central and South America, where
1 Codes 008 (Enteritis) and 009 (Other diarrheal diseases) of the Inter-national Classification of Diseases (Ninth Revision, 1975). Geneva, World Health Organization, 1977.
2
Defined according to categories of the Eighth Revision of the Interna-tional Classification of Diseases, including other salmonella infections (003), bacillary dysentery (004), amebiasis (006), enteritis (008), and other diarrheal diseases (009).
10