Relationship between food
insecurity and nutritional status
of Brazilian children under the
age of ive
Relação entre insegurança alimentar
e estado nutricional de crianças
brasileiras menores de cinco anos
Leonardo Pozza dos SantosI
Denise Petrucci GiganteI
IPostgraduate Program of Epidemiology at Universidade Federal de Pelotas –
Pelotas, RS, Brazil.
Corresponding author: Leonardo Pozza dos Santos. Programa de Pós-graduação em Epidemiologia da Universidade Federal de Pelotas. Rua Marechal Deodoro, 1160, 3° piso, CEP: 96020-220, Pelotas, RS, Brasil. E-mail: [email protected]
Source of funding: National Council of Scientiic and Technological Development (Process number 151694/2010-9)
Conlict of interests: nothing to declare.
Abstract
Objective: he aim of this study was to investi-gate the relationship between food insecurity and nutritional status of Brazilian children. Methods: he National Demographic and Health Survey 2006 database is available on the worldwide web. hus, the analyzed vari-ables were obtained in this study, includ-ing nutritional indices, food insecurity and other socioeconomic and demographic vari-ables. he height-for-age, weight-for-age and weight-for-height indices were evaluated as the z-score of the World Health Organization reference curves. Food insecurity was deined by using the Brazilian Food Insecurity Scale. Averages of three indices according to the presence of food insecurity were analyzed, including other variables. Linear regression evaluated the effect of food insecurity on the z-score of the three nutritional indices. Results: he sample included 4,817 children, out of whom 7% had deficit in height, 7% were overweight and 47% had food insecu-rity. It was found that the average of height-for-age, weight-for-age and weight-for-height were -0.31, 0.12 and 0.40, respectively, being lower among children with food insecurity. Conclusion: he regression analysis showed that children living with some level of food insecurity have worse rates of height-for-age, even controlling for demographic and socio-economic factors.
Resumo
Objetivo: O objetivo foi veriicar a relação entre insegurança alimentar e estado nutri-cional de crianças brasileiras. Métodos: O banco de dados da Pesquisa Nacional de Demograia e Saúde de 2006 está disponível na internet. Assim, foram obtidas as variá-veis analisadas no presente estudo, incluindo índices nutricionais, insegurança alimentar e outras variáveis socioeconômicas e demo-gráficas. Os índices estatura-para-idade, peso-para-idade e peso-para-estatura foram avaliados como escore z, por meio das cur-vas de referência da Organização Mundial de Saúde. A insegurança alimentar foi deinida pelo uso da Escala Brasileira de Insegurança Alimentar. Foram analisadas as médias dos três índices segundo a presença de insegu-rança alimentar e das demais variáveis. O efeito da insegurança alimentar sobre o escore z dos três índices foi avaliado utilizando regressão linear. Resultados: Das 4.817 crianças, 7% tinham déicit de estatura, 7% tinham excesso de peso e 47% apresentaram insegurança ali-mentar. As médias de estatura-para-idade, peso-para-idade e peso-para-estatura foram -0,31; 0,12 e 0,40, respectivamente e meno-res em crianças com insegurança alimentar. Conclusão: A análise de regressão mostrou que crianças vivendo com algum grau de insegurança alimentar têm piores índices de estatura-para-idade, mesmo controlando para fatores de confusão.
Palavras-chave: Segurança alimentar e n u t r i c i o n a l . E s t a d o n u t r i c i o n a l . Desenvolvimento infantil. Transição Nutricional. Estatura. Antropometria.
Introduction
Child malnutrition is expressed in dif-ferent ways, by means of low height-for-age, low weight-for-height or low weight-for-age1. Even though it is a major challenge for low income countries, recent estimates suggest that malnutrition is decreasing in most countries, being replaced by problems related to exces-sive weight2.
Considering that child nutritional status is closely related to the socioeconomic condi-tion of the child, there are diferences in this relationship between countries. While nutri-tional deicits are more prevalent in developing nations and in the lower social classes of these countries3, the relationship between socio-economic level and excessive weight is more complex. Even though the prevalence of exces-sive weight among children is higher in high income countries, in the past two decades the medium and low income countries presented increased proportions of this condition4. In the adult population of Brazil, studies point out that there is a direct association between socioeconomic level and obesity among men, while for women obesity is related to poverty5,6. As to children, this relationship is not so clear, but national estimates suggest that the preva-lence of excessive weight is discreetly higher in the most favored social classes7.
Besides nutritional status, other indica-tors are also related to the socioeconomic level of a family. One of these indicators is food insecurity, since some studies sug-gest that this condition is associated with low income, low schooling, high home agglomeration, among others8,9. Besides, several studies point to the direct relationship between food insecurity and damages on child nutritional status10-14.
of deficit13,14. On the other hand, other investigations suggest that food insecurity can increase the risk of obesity in the child population12,15. However, recent findings of a study conducted with the Brazilian child population suggest that a situation of food insecurity does not increase the risk of overweight among the studied children16. Studies that measure the relationship between food insecurity and nutritional status among children are mostly conducted in developed nations, and, therefore, they frequently assess the effect over excessive weight or obesity. here are still only a few investigations in medium or low income countries, where such relationship can be more complex because of several factors, such as social inequity, poverty, among others. herefore, he objective of this study was to verify the relationship between food insecu-rity an nutritional status of Brazilian children aged less than ive years old, analyzed in the National Demographic and Health Survey (PNDS) of 2006.
Methodology
Data in this study were obtained in the last PNDS survey performed between 2006/07 in Brazil, which aimed at studying maternal and child health of women at reproductive age and children aged less than ive years old7.
This survey included a probability sam-ple with national representativeness and cross-sectional design. Ten sample strata based on the combination of five Brazilian geographic macroregions and on the urban and rural areas were defined in the first stage of the sampling process. In each of these strata, two other stages were selected: primary units, which are the census sec-tors, and secondary units, which are the private households, with or without occu-pation, identified within the census sectors. This complex sampling process requires the expansion of the sample with house-hold adjustment inside each census sector. This adjustment, as well as calibration according to estimates of the official Brazilian population from the Brazilian Institute of
Geography and Statistics (IBGE)17, pub-lished in 2007, considered the losses that took place during data collection and the proportion of women at reproductive age found in each household. More information about this sampling process can be found in the PNDS report7.
Data were collected in the selected house-holds, by interviewers who were trained to use the instruments containing demographic, socioeconomic and health information of women and children aged less than five years old. he latter included data on life-style, nutrition, medication, food security and anthropometry of the interviewees. he collection of anthropometric measures was in accordance with the recommendations by the World Health Organization (WHO)18, and two weight and height measures were obtained for each individual, using the arith-metic mean to calculate the z score. The weight measure was obtained by using the portable electronic scale by Dayhome®, for up to 150 kg and 0.1 kg precision. Among children aged less than two years old, height was obtained by measuring length, with the child lying down, in an infantometer. Among children aged two years old or more and women, the measure was taken in the stand-ing position, in a device called stadiometer. Portable infantometers and stadiometers were developed especially for PNDS – 2006 in the Laboratory of Nutritional Assessment of Populations (LANPOP), of the Nutrition Department of Universidade de São Paulo. he former was 110 cm long and had 0.1 cm precision; the latter was 210 cm long and had 0.1 cm precision, respectively. All of the equipment was calibrated in the beginning and in the end of each work day.
Household food insecurity was deined by the Brazilian Scale of Food Insecurity (EBIA), validated for the Brazilian scenario between 2003 and 200418. All of the questions of this scale referred to a reminiscent period of three months prior to the interview, and each airmative answer received value “1”.
item of the scale (1 point for “yes” and 0 point for “no” or “do not know”) and to the age composition of the household. For house-holds with no participants aged less than 18 years old, it was only possible to apply eight questions. Therefore, the highest pos-sible score was eight. For households with people aged less than 18 years old, the full questionnaire was applied and accounted for 16 points. The score and cutoff point criteria of EBIA enables the division in 4 categories and 3 levels of intensity: food security (FS), mild, moderate and severe food insecurity, which are distributed according to the pres-ence or abspres-ence of people aged less than 18 years old. The validity of the scale and the adaptation of the adopted cutoff points was confirmed by the high internal validity of the scale (Chrombach’s α = 0.91)19.
The main exposure of this study was defined by the classification of the inter-viewed families according to the presence of food insecurity and their diferent levels of severity. Therefore, mild food insecurity was considered when households accounted from 1 to 5 points; moderate, for households that had 6 to 10 points; and severe food insecu-rity for 11 to 16 points. he situation of food security was deined for those families with negative answers for all of the questions.
In this study, the outcome was deined based on the height-for-age, weight-for-age and weight-for-height indices, assessed as z score by means of WHO reference curves20. he distribution of z score means of the three indices according to demographic and socio-economic variables was observed, with the objective of detecting diferences between groups, especially concerning those dif-ferences that would not be noticed in case the variables were in dichotomous format. Therefore, extreme values were ruled out (lower than z scores -5 and -6 higher than z scores +5 and +6 for weight and height, respectively), according to WHO18.
The other variables used in this analysis were: household macroregion (North, Northeast, Southeast, South, Center-West), situation of the household (urban, rural), receiving the Bolsa Família Program (PBF), number of people in
the household (2 to 4, 5 or more), household income quartiles (≤ 340, 350 – 520, 525 – 980, ≥ 1000 reais in the month prior to the interview), age of the mother (15 – 19, 20 – 35, 36 – 49 years old), skin color of the mother (white, black/ mulatto, other), child’s age (0 – 12, 13 – 24, 25 – 36, 37 – 48, 49 – 59 months) and gender (male, female).
Descriptive analyses include the distri-bution of sociodemographic variables (gen-der, household macroregion, situation of the household, household income quartiles, age of the mother, skin color of the mother, and child’s age) and food insecurity according to z scores means for height-for-age, weight-for-age and weight-for-height. Linear regression was used in the analysis to assess the crude and adjusted efect of food insecurity over the z score of the three nutritional indices. Confusion factors were those variables with p < 0.2 in the crude analysis. herefore, results are presented by regression coeicient (beta) and its respective 95% conidence intervals (95%CI). Analysis were performed in the statistical software Stata, version 11.0, and all of the estimates were pondered, consider-ing the design effect, as well as calibration according to the estimates of the Brazilian population, by means of the svy command in Stata.
his study presents no real, potential or apparent conlict of interest by none of the authors, and was approved by the Research Ethics Committee of the Medical School of Universidade Federal de Pelotas.
Results
he distribution of this population, consid-ering the sample design, reveals that almost half of them lived in the Southeast region of the country (42%), and most of them lived in the urban zone (81%). In relation to PBF, about 1 out of 4 families received this ben-eit, and 38% of the studied children lived in households with 5 or more inhabitants. As to maternal age, while 11% of the children had adolescent mothers (15 to 19 years old), 76% had mothers aged from 20 to 35 years old, and 13% had mothers aged more than 35 years old, and more than half of the mothers reported their skin color as nonwhite.
he nutritional status classiication shows that the prevalence of height-for-age deicit was of 7.6% (95%CI 6.7 – 8.5) among the children included in this study. For weight-for-age and weight-for-height deicits, these proportions did not reach 2.5%, which would be expected in population with normal distribution. On the other hand, 6.6% (95%CI 5.5 – 7.8) of the children were classiied with excessive weight in relation to height. Concerning the house-hold food situation, it was observed that half of the children (45.6%) lived in a household with some level of food insecurity.
he mean values of the z scores for height-for-age, weight-for-age and weight-for-height were, respectively, -0.31 (± 0.04), 0.12 (± 0.03) and 0.40 (± 0.03). he means for these three indices in relation to exposure variables are presented in Table 1.
It is possible to observe that the mean z score for height-for-age was signiicantly lower among children living in the North region of the country. On the other hand, higher z score means for this index were found in children who did not receive PBH, living in households with two to hour inhabit-ants with higher income. Besides, the analysis suggests that female children present with higher z score mean for height-for-age (p = 0.05). With regard to children’s age, a positive mean, close to zero, was observed in those aged up to 12 months old. In relation to older children, these means were negative. Concerning food insecurity, negative z score means were observed for height-for-age, regardless of the classiication level. However,
for children living in households classiied as secure, this mean was signiicantly higher when compared to the other groups (Table 1). In Table 1, it is observed that the z score mean for weight-for-age was equally lower among children in the North region of the country, those receiving PBF and the ones living in households with more inhabitants (ive or more). Inversely, these means were significantly higher for younger children, living in households with food security and coming from families with higher income.
With regard to weight-for-height, unlike what has been observed for height-for-age, z score means were positive, regardless of demographic, socioeconomic of food insecurity level charac-teristics. Children coming from more developed regions of the country (South and Southeast) and who did not receive the PBF presented sig-niicantly higher means for this index. Besides, it was observed that the higher the number of people living in the same household as the child, the lower the income and the more severe the food insecurity situation, therefore, the z score mean for weight-for-height was lower (Table 1).
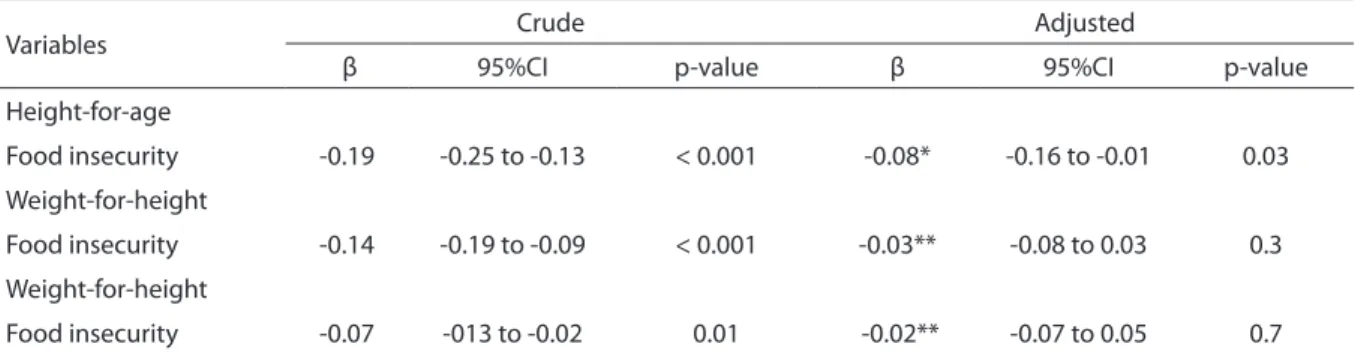
In the regression analysis, it was observed that the more severe the food insecurity level, the lower the z score of the three nutritional indices, being height-for-age the one that mostly suffers negative influence from the food situation. However, it was observed that only the height-for-age index was associated with the food insecurity situation after the control for confusion factors included in this analysis (Table 2).
Discussion
Table 1 -Mean and 95% conidence interval of the z scores for height-for-age, weight-for-age and weight-for-height according to demographic and socioeconomic characteristics of children studied. Brazil, 2006 (n = 4,496)#.
Tabela 1 - Média e intervalo de coniança de 95% do escore Z de estatura-para-idade, peso-para-idade e peso-para-estatura de acordo com as características demográicas e socioeconômicas das crianças estudadas. Brasil, 2006 (n = 4.496)#.
Variables Height-for-age Weight-for-age Weight-for-height
n Mean 95%CI p-value Mean 95%CI p-value Mean 95%CI p-value
Macroregion < 0. 001 < 0. 001 0. 001
North 988 -0. 76 -0. 89 to -0. 64 -0. 19 -0. 31 to -0. 07 0. 35 0. 27 to 0. 42 Northeast 882 -0. 37 -0. 55 to -0. 18 0. 02 -0. 10 to 0. 15 0. 28 0. 18 to 0. 38 Southeast 893 -0. 21 -0. 35 to -0. 08 0. 21 0. 12 to 0. 30 0. 45 0. 34 to 0. 57 South 835 -0. 22 -0. 35 to -0. 09 0. 23 0. 11 to 0. 34 0. 50 0. 38 to 0. 62 Center-west 898 -0. 19 -0. 30 to -0. 08 0. 21 0. 12 to 0. 30 0. 45 0. 35 to 0. 54 Household
situation 0. 3 0. 06 0. 08
Urban 2.944 -0. 29 -0. 37 to -0. 21 0. 15 0. 09 to 0. 21 0. 42 0. 35 to 0. 49 Rural 1.552 -0. 42 -0. 66 to -0. 19 -0. 01 -0. 15 to 0. 14 0. 31 0. 21 to 0. 41 Receive
bolsa família 0. 004 < 0. 001 < 0. 001
Yes 1.334 -0. 50 -0. 66 to -0. 35 -0. 15 -0. 27 to -0. 04 0. 18 0. 06 to 0. 30 No 3.159 -0. 25 -0. 34 to -0. 17 0. 21 0. 15 to 0. 27 0. 47 0. 41 to 0. 54 People in the
household 0. 006 < 0. 001 0. 002
2 to 4 2.300 -0. 25 -0. 34 to -0. 15 0. 21 0. 14 to 0. 28 0. 47 0. 39 to 0. 54 5 or more 2.196 -0. 42 -0. 53 to -0. 32 -0. 03 -0. 11 to 0. 06 0. 29 0. 20 to 0. 38
Income quartiles < 0. 001 < 0. 001 < 0. 001
1st quartile
(lower) 902 -0. 67 -0. 81 to -0. 53 -0. 24 -0. 37 to -0. 11 0. 19 0. 07 to 0. 30 2nd quartile 943 -0. 36 -0. 57 to -0. 15 0. 07 -0. 06 to 0. 20 0. 34 0. 21 to 0. 48
3rd quartile 848 -0. 16 -0. 27 to -0. 05 0. 32 0. 21 to 0. 44 0. 59 0. 46 to 0. 71
4th quartile
(higher) 999 -0. 11 -0. 27 to 0. 05 0. 31 0. 19 to 0. 43 0. 48 0. 36 to 0. 61 Age of the
mother 0. 3 0. 13 0. 3
15 –19 386 -0. 51 -0. 74 to -0. 27 -0. 07 -0. 23 to 0. 09 0. 30 0. 09 to 0. 51 20 – 35 3.543 -0. 28 -0. 37 to -0. 19 0. 15 0. 08 to 0. 21 0. 41 0. 34 to 0. 47 36 – 49 567 -0. 34 -0. 54 to -0. 14 0. 12 -0. 02 to 0. 26 0. 44 0. 31 to 0. 57 Skin color of
the mother 0. 5 0. 4 0. 7
White 1.499 -0. 24 -0. 35 to -0. 13 0. 17 0. 08 to 0. 29 0. 44 0. 34 to 0. 54 Black/
Mulatto 2.711 -0. 33 -0. 44 to -0. 23 0. 08 0. 01 to 0. 15 0. 37 0. 29 to 0. 44 Others 234 -0. 48 -0.70 to -0.25 0. 23 0. 03 to 0. 42 0. 54 0. 36 to 0. 72
Gender 0. 05 0. 2 0. 9
Male 2.311 -0. 38 -0.47 to -0. 28 0. 09 0. 01 to 0. 16 0. 40 0. 33 to 0. 47 Female 2.185 -0. 24 -0. 35 to -0. 14 0. 15 0. 08 to 0. 23 0. 40 0. 31 to 0. 48
Child’s age 0. 002 0. 04 0. 2
0 – 12 993 0. 01 -0.15 to 0.17 0. 19 0. 07 to 0. 31 0. 27 0. 13 to 0. 40
13 – 24 896 -0. 40 -0. 60 to -0. 20 0. 11 -0. 01 to 0. 23 0. 39 0. 26 to 0. 52
25 – 36 901 -0. 50 -0.60 to -0.39 0. 14 0. 05 to 0. 23 0. 55 0.46 to 0. 64 37 – 48 885 -0. 40 -0.53 to -0.26 0. 12 0. 00 to 0. 23 0. 52 0.41 to 0.62
49 – 59 821 -0.34 -0.48 a -0.19 0.00 -0.11 to 0.12 0.28 0.17 to 0.40
Global data about nutritional indices of children aged less than ive years old show that the mean for height-for-age decreases with age, and it is always lower when compared to weight-for-age and weight-for-height indices21. Likewise, the height-for-age mean in this study was lower (-0.31) than weight-for-age (0.12) and weight-for-height means (0.40), and also decreased with age.
he height mean was below expected for all of the analyzed children, since a mean z score value of zero would be expected from a normal distribution population. However, it was observed that such values were even lower for those living with some level of food
insecurity. Besides, after the adjusted analysis, food insecurity remained negatively related to their height, together with income and, to a lower degree, to the household macroregion (data not shown). his shows that this relation-ship has been connected to the socioeconomic level of the children, since these determiners are closely related.
Despite the low prevalence of excessive weight, with regard to weight-for-height it was observed that the mean values of this index were high, regardless of the food insecurity situation. However, these values were higher in the group living with food security, and food insecurity did not have any inluence on this index.
#Estimates were weighted taking into account the complex sample design; The largest number of missing values was to the weight-for-height index ; FI: Food insecurity.
#Estimativas foram ponderadas levando em conta o complexo desenho da amostra; O maior número de valores perdidos foi para o índice peso-para-estatura;
FI: insegurança alimentar.
Variables Height-for-age Weight-for-age Weight-for-height
n Mean 95%CI p-value Mean 95%I p-value Mean 95%CI p-value
Food
situation < 0. 001 < 0. 001 0. 01
Food security 2.170 -0.17 -0.28 to -0.06 0. 21 0.14 to 0.29 0. 44 0.36 to 0.51 Mild FI 1.242 -0.36 -0.47 to -0.25 0. 12 0.02 to 0.22 0. 44 0.33 to 0.54 Moderate FI 604 -0.52 -0.69 to -0.35 -0. 08 -0.22 to 0.07 0. 30 0.14 to 0.46 Severe FI 480 -0.77 -0.97 to -0.57 -0. 23 -0.41 to -0.04 0. 17 0.00 to 0.34 Table 1 -Continuation.
Tabela 1 - Continuação.
Table 2 - Multivariate linear regression model of the relationship between z scores for height-for-age, weight-for-height and weight-for-age and level of food insecurity. Brazil, 2006#.
Tabela 2 - Modelo de regressão linear multivariada da relação entre escore Z de estatura-para-idade, peso-para-estatura e peso-para-idade e nível de insegurança alimentar. Brasil, 2006#.
#Estimates were weighted taking into account the complex sample design; *Adjusted by income quartile, region of housing, transfer income, household
density, sex and children’s age; **Adjusted by income quartile, region of housing, household situation, transfer income, household density, mother’s age, sex and children’s age; ***Adjusted by income quartile, region of housing, household situation, transfer income, household density and children’s age. #Estimativas foram ponderadas levando em conta o complexo desenho da amostra; *Ajustado para quartil de renda, macrorregião de moradia, recebimento
do PBF, densidade domiciliar, sexo e idade da criança; **Ajustado para quartil de renda, macrorregião de moradia, situação do domicílio, recebimento do PBF, densidade domiciliar, idade da mãe, sexo e idade da criança; ***Ajustado para quartil de renda, macrorregião de moradia, situação do domicílio, recebimento do PBF, densidade domiciliar e idade da criança.
Variables Crude Adjusted
β 95%CI p-value β 95%CI p-value
Height-for-age
Food insecurity -0.19 -0.25 to -0.13 < 0.001 -0.08* -0.16 to -0.01 0.03
Weight-for-height
Food insecurity -0.14 -0.19 to -0.09 < 0.001 -0.03** -0.08 to 0.03 0.3
Weight-for-height
his situation, in which the height mean was below expected and weight mean was above expected, suggests that excess weight problems can be present in these children. In the last Survey of Household Budgets (POF) of 2008/09, it was mainly observed in children aged from 5 to 9 years old, once about one third of them presented with excessive weight22.
The effect of food insecurity on nutri-tional status has been investigated by other national studies that used the PNDS database14,16,23.
The first study indicated that children with food insecurity can show worse anthro-pometric indicators. However, there was no comparison between the means of nutritional indices of those living with food insecurity and the means of the individuals who did not experience such situation, and the main objective of the study was to investigate the association between food insecurity and health and nutrition indicators of children14. he other two investigations aimed at observ-ing the relationship between food insecurity and excessive weight among children16 and women23. The first one also analyzed the child population of PNDS and observed simi-lar results to those of this study, and found no relationship between these two health indicators. However, the authors did not present results for the height-for-age index, and included diferent variables in relation to this study in the analysis model. On the other hand, the study conducted with women23 suggested that moderate food insecurity can lead to excessive weight.
Considering international studies that assessed the relationship between food inse-curity and nutritional status, it is observed that the results are not similar when considering the development stage of the location of the study. herefore, in high income countries, most studies relates food insecurity with overweight/obesity, since in these places the frequency of excessive weight among children is twice as high as the one found in developing countries, so problems related to nutritional deicit are rare10,11,24,25. hese studies present the efects of mild, moderate or severe food inse-curity on the prevalence of excessive weight,
showing that such condition is sometimes more common among children with food insecurity, and sometimes more common among those who do not experience this situ-ation. In this study, in which the prevalence of excessive weight for height was lower in comparison to the aforementioned studies (6.6%), it was observed that children with severe food insecurity had weight-for-height means signiicantly lower in comparison to children with food security. Besides, weight-for-height means were always higher in groups with of higher socioeconomic level (children in the urban zone, without PBH, in households with fewer people and higher income), which is opposed to the hypothesis of association between these two health conditions.
With regard to low and medium income countries, most studies associate the situ-ation of household food insecurity to the possible nutritional deficits it can cause13,14,26. In this study, it was observed that food insecurity is negatively related to all of the nutritional indices, especially the height-for-age index. Besides, regardless of the food security situation lived by the house-hold, for children older than 12 months old, the means of this index were always negative, reaching almost -1 z score among those with moderate and severe insecurity. Similarly, studies conducted in different South America countries showed that chil-dren in households with food insecurity had more prevalence of height deficit13,26. However, none of the studies conducted in these locations has national representa-tiveness, thus not presenting a population overview of this relationship.
location. Studies conducted in high income countries reported that children living with food insecurity present more consumption of energy, sugar and fat and less consumption of fruits, meat and dairy products28,29. Likewise, a nationally representative study about food consumption showed that Brazilian children, despite living in a country going through a long nutritional transition process, presented higher intake of sugar and fat and lower intake of fruits, vegetables and meat30. Even though the food consumption of Brazilian children is similar to that of children in developed countries, the diference in the relationship of food insecurity with overweight/obesity can be explained by the fact that, in Brazil, obesity levels began to increase recently, and still afect richer children, while in developed countries the problem of child obesity is older, reaching all social levels.
he main advantage of this study refers to the complex design of the sample selection that enabled the evaluation of the food insecurity efect on the nutritional indices of children aged less than ive years old living in the ive Brazilian macroregions, both in the urban and rural contexts. he methods applied by PNDS7, like the standardization of data col-lection, including a rigorous training of the interviewers and the quality control during the period of ield work, can be considered as other positive aspects of this study. On the other hand, the use of EBIA relects a relative measure of the situation experienced by all of the individuals living in the same house-hold; therefore, it is not an individual mea-sure of food insecurity. However, despite this limitation, it is known that when a household experiences this situation, consequently, all of the inhabitants are afected9.
To understand the relationship of food insecurity with child nutritional status is very important to develop policies and health and nutrition programs that can fight both food insecurity and nutritional issues. In this study, it was observed that the height-for-age mean was below expected among children with medium or severe food insecurity. hese indings assume that these children are more exposed to the risk of malnourishment, which has serious conse-quences for their physical and mental devel-opment. Some studies report that problems related to food insecurity are not only nutritional, since there can be emotional, behavioral and mental development problems31,32. Such ind-ings conirm the importance to promote proper nourishment in terms of quantity and quality, not only to prevent nutritional disorders, but also for the children to reach their full growth and development potential.
Conclusion
Food insecurity has been negatively related to the height-for-age index at all ages, even controlling for some demographic and socioeconomic factors, such as household location, income, number of inhabitants of the household, skin color of the mother, among others. However, this relationship seems to be connected to the socioeconomic level of these Brazilian children, being strongly con-nected to the monthly income of the family and location of the household.
Acknowledgements
he authors thank the National Council of Scientiic and Technological Development for the inancial support for this study.
References
1. Waterlow JC. Note on the assessment and classification of protein-energy malnutrition in children. Lancet 1973; 2(7820): 87-9.
3. World Health Organization, Department of Nutrition for Health and Development. WHO global database on child growth and malnutrition. Disponível em: http:// www.who.int/nutgrowthdb/database/en/ (Acessado em 5 de agosto de 2011).
4. de Onis M, Blössner M, Borghi E. Global prevalence and trends of overweight and obesity among preschool children. Am J Clin Nutr 2010; 92: 1257-64.
5. Monteiro CA, Conde WL, Popkin BM. Income-specific trends in obesity in Brazil: 1975-2003. Am J Public Health 2007; 97(10): 1808-12.
6. Santos, LM. Obesity, poverty, and food insecurity in Brazilian males and females. Cad. Saúde Pública 2013; 29(2): 237-9.
7. Brasil. Ministério da Saúde. Pesquisa Nacional de Demografia e Saúde da Criança e da Mulher - PNDS 2006. Brasília: Ministério da Saúde; 2008.
8. Panigassi G, Segall-Corrêa AM, Marin-León L, Pérez-Escamilla R, Sampaio MFA, Maranha LK. Insegurança alimentar como indicador de iniqüidade: análise de inquérito populacional. Cad Saúde Pública 2008; 24(10): 2376-84.
9. Bickel GW, Nord M, Price C, Hamilton W, Cook J. Measuring food security in the United States. Guide to measuring household food security. Revised 2000. Alexandria: United States Department of Agriculture; 2000.
10. Rose D, Bordor JN. Household food insecurity and overweight status in young school children: results from the Early Childhood Longitudinal Study. Pediatrics. 2006; 117(2): 464-73.
11. Gundersen C, Garasky S, Lohman BJ. Food insecurity is not associated with childhood obesity as assessed using multiple measures of obesity. J Nutr 2009; 139(6): 1173-8.
12. Hernádez LO, Gutiérrez MNA, Pérez AEN, Fonseca NP, Gómez YR. Em escolares de la Ciudad de México lá inseguridad alimentaria se associó positivamente com el sobrepeso. Rev Invest Clin 2007; 59(1): 32-41.
13. Hackett M, Melgar-Quiñonez H, Álvarez MC.
Household food insecurity associated with stunting and underweight among preschool children in Antioquia, Colombia. Rev Panam Salud Publica 2009; 25(6): 506-10.
14. Reis M. Food insecurity and the relationship between household income and children’s health and nutrition in Brazil. Health Econ 2011; 21(4): 405-27.
15. Bronte-Tinkew J, zaslow M, Capps R, Horowitz A, Mcnamara M. Food insecurity works through depression, parenting, and infant feeding to influence overweight and health in toddlers. J Nutr 2007; 137(9): 2160-65.
16. Kac G, Schlüssel MM, Pérez-Escamilla R, Velásquez-Melendez G, Silva AA. Household food insecurity is not associated with BMI for age or weight for height among Brazilian children aged 0-60 months. PLoS ONE 2012; 7(9): e45747.
17. Instituto Brasileiro de Geograia e Estatística. Pesquisa nacional por amostra de domicílio: 2006. 27th vol. Rio de Janeiro: Instituto Brasileiro de Geograia e Estatística; 2007.
18. World Health Organization. Physical Status: the use and interpretation of anthropometry. Report of a WHO Expert Committee. Technical Report Series. n. 854. Geneva: World Health Organization; 1995.
19. Perez-Escamilla R, Segall-Correa AM, Maranha LK, Sampaio MFA, Marin-Leon L, Panigassi G. An adapted version of the U.S. Department of Agriculture Food Insecurity module is a valid tool for assessing household food insecurity in Campinas, Brazil. J Nutr 2004; 134(8): 1923-8.
20. World Health Organization. WHO Multicentre Growth Reference Study Group. WHO child growth standards: length/height-for-age, weight-for-age, weight-forlength, weight-for-height and body mass index-for-age: methods and development. Geneva: World Health Organization, 2006.
21. Victora CG, de Onis M, Hallal PC, Blössner M, Shrimpton R. Worldwide timing of growth faltering: revisiting implications for interventions. Pediatrics 2010; 125(3): e473-80.
22. Instituto Brasileiro de Geografia e Estatística. Pesquisa de Orçamentos Familiares 2008-2009: Antropometria e estado nutricional de crianças, adolescentes e adultos no Brasil. Rio de Janeiro: Instituto Brasileiro de Geografia e Estatística; 2010.
23. Velásquez-Melendez G, Schlüssel MM, Brito AS, Silva AAM, Lopes-Filho JD, Kac G. Mild but not light or severe food insecurity is associated with obesity among Brazilian women. J Nutr 2011; 141(5): 898-902.
24. Kaiser LL, Melgar-Quiñonez HR, Lamp CL, Johns MC, Sutherlin JM, Harwood JO. Food security and nutritional outcomes of preschool-age Mexican-American children. J Am Diet Assoc 2002; 102(7): 924-9.
25. Casey PH, Simpson PM, Gosset JM, Bogle ML, Champagne CM, Cornell C et al. The association child and household food insecurity with childhood overweight status. Pediatrics 2006; 118(5): 1406-13.
26. Bolzán A, Mercer R. Seguridad alimentaria y retardo crónico del crecimiento en niños pobres del norte argentino. Arch Argent Pediatr 2009; 107(3): 221-8.
27. Dinour LM, Bergen D, Yeh MC. The food insecurity-obesity paradox: a review of the literature and the role food stamps may play. J Am Diet Assoc 2007; 107(11): 1952-61.
28. Matheson DM, Varady J, Varady A, Killen JD. Household food security and nutritional status of Hispanic children in the fifth grade. Am J Clin Nutr 2002; 76(1): 210-7.
30. Bortolini GA, Gubert MB, Santos LMP. Consumo alimentar entre crianças brasileiras com idade de 6 a 59 meses. Cad Saúde Pública 2012; 28(9): 1759-71.
31. Belsky DW, Moffitt TE, Arseneault L, Melchior M, Caspi A. Context and sequelae of food insecurity in children’s development. Am J Epidemiol 2010; 172(7): 809-18.
32. zaslow M, Bronte-Tinkew J, Capps R, Horowitz A, Moore KA, Weinstein D. Food security during infancy: implications for attachment and mental proficiency in toddlerhood. Matern Child Health J 2009; 13(1): 66-80.