Prevalence of overweight and obesity among
Costa Rican elementary school children
Hilda Patricia Núñez-Rivas,
1Rafael Monge-Rojas,
1Hania León,
2and Marlen Roselló
1Objective. Given that excessive body weight during childhood influences the development of several chronic diseases in adulthood, this study was conducted to determine the prevalence of overweight and obesity in urban and rural Costa Rican elementary school children.
Methods. The study was carried out from July 2000 to April 2001. A total of 1 718 stu-dents ages 7–12 were selected from 34 schools in the capital city of San José and in other nearby urban and rural areas. Both younger children (ones aged 7 through 9 years) and older children (ones aged 10 through 12 years) with a body mass index (BMI) at or above the sex-specific 85th percentile were considered overweight. The younger children were classified as being obese if their triceps skinfold was greater than or equal to the 85th percentile for age and sex using the percentiles by age for children in the United States of America as normative standards. The older children were considered obese if they had a BMI at or above the sex-specific 85th per-centile and both the triceps and subscapular skinfold thickness at or above the 90th perper-centile.
Results. The prevalence of overweight was 34.5%. Children aged 7–9, boys, children from urban areas, and children of a higher socioeconomic status had a higher prevalence of overweight. The prevalence of obesity was 26.2%. A higher prevalence of obesity was found among children aged 7–9, boys, children from urban areas, and children of middle socioeconomic status.
Conclusions. Given the high prevalence of obesity that we found in the Costa Rican chil-dren, primary and secondary prevention measures are needed in order to reduce the proportion of deaths due to chronic nontransmissible diseases among Costa Rican adults in the coming decades.
Child, body mass index, obesity, risk factors, Costa Rica.
ABSTRACT
The prevalence of obesity is increas-ing worldwide at an alarmincreas-ing rate in both developed and developing
coun-tries (1). The current lack of consis-tency and agreement among different studies in the classification of over-weight and obesity in children and adolescents makes it difficult to give an overview of the global prevalence of overweight and obesity in younger age groups. Nevertheless, irrespective of the classification system used, most studies of overweight and obesity dur-ing childhood and adolescence have
reported that the prevalence of both has increased.
Generally, excessive body weight during childhood influences the devel-opment of coronary heart disease, hy-pertension and stroke, type 2 diabetes mellitus, certain types of cancer, and other diseases in adulthood (2–5). This is of particular concern in developing countries such as Costa Rica, which has a “delayed” model of
epidemio-Key words
1 Costa Rica, Ministry of Health, Costa Rican
Insti-tute for Research and Education on Nutrition and Health (INCIENSA), Tres Ríos, Cartago, Costa Rica. Send correspondence and reprint requests to: Hilda Patricia Núñez-Rivas, INCIENSA, Apdo. 4, Tres Ríos, Cartago, Costa Rica; telephone: (506) 279-9911; fax: (506) 279-5546.
2 National University School of Sports Sciences,
logic transition, where chronic and in-fectious diseases coexist (6).
Life expectancy in developing coun-tries has increased; however, the pos-sibility of improving it will depend not only on a decrease in infant mortality, but also on a decrease in chronic non-transmissible diseases associated with premature mortality (6). A decrease in the prevalence of overweight and obe-sity early in life could contribute to-wards achieving this goal. As has been widely demonstrated (1), it is possible to reduce the proportion of deaths due to chronic disease, and furthermore, prevent the occurrence of new cases by applying strategies directed to the mod-ification of lifestyle risk factors.
Because of their public health impor-tance, excessive body weight and obe-sity in childhood should be closely monitored. This offers the best hope for preventing progression of the dis-ease and its associated morbidities into adulthood. This report is the first to describe the prevalence of overweight and obesity in urban and rural Costa Rican elementary school children.
METHODS
Sample
The sample was selected from the Greater Metropolitan Area (GMA) of Costa Rica and its bordering rural dis-tricts. The GMA itself includes the cen-tral cantons of four provinces: the province of San José (which includes the capital city of San José) plus the three nearby provinces of Alajuela, Heredia, and Cartago. The GMA and the neighboring rural areas have the country’s greatest concentration of ele-mentary school children.
A total of 1 780 children ages 7–12 were selected from 34 schools; 68% of the children were from urban areas, and 32% were from rural areas. The schools were selected with probability pro-portional to size from a list of schools in the study area. In each school, 50 students—half of them boys and half of them girls—were selected at random.
Schools were classified as either ur-ban or rural according to the
socio-demographic characterization of the geographic-population areas of Costa Rica, as has been defined by the Na-tional Department of Statistics (7).
Procedure
Permission for the study was ob-tained from the Ethics Committee of the Costa Rican Institute for Research and Education on Nutrition and Health. Consent to participate in the study was obtained from the head or principal of each school. Written pa-rental consent was required for chil-dren to participate in the study.
Anthropometric measurements
Height, weight, and triceps and sub-scapular skinfold measurements were obtained according to the guidelines established by Lohman et al. (8). Weight was measured without shoes and heavy outer clothing. Height was measured with the student shoeless and facing away from the scale. Stand-ing height was measured to the near-est 0.1 cm, and weight was measured to the nearest 0.1 kg. Independent du-plicate measurements were obtained for height and weight, and the average of both readings—required to be within ± 0.5 cm or 0.5 kg, respectively—was used in the data analyses. Body mass index (BMI) was calculated as weight (kg) divided by height (m) squared.
Triceps skinfold (TRSK) (posterior upper arm, halfway between the el-bow and acromion) and subscapular skinfold (SSK) (1 cm below the sca-pula’s lower tip) were measured using a Lange skinfold caliper (Cambridge Scientific Industries, Cambridge, Mary-land, United States of America) to the nearest 1.0 mm. Each skinfold was measured two times on the left side of the body, with it done a third time if the difference between the first two measures exceeded 4 mm.
Younger children (the students aged 7 through 9 years) and older children (the students aged 10 through 12 years) with BMI at or above the sex-specific 85th percentile were
consid-ered overweight.3 In the absence of
other data specifying optimum cutoff values for BMI in younger and older children, the BMI values by age for children in the United States were used, as recommended by the World Health Organization (WHO) Expert Committee on Physical Status (9).
Younger children were classified as obese if their triceps skinfold was greater than or equal to the 85th per-centile for age and sex, using the percentiles by age for United States children as normative standards, as recommended by the WHO (9). This criterion was chosen because the tri-ceps skinfold has generally been found to be the best predictor of fat in chil-dren (10, 11). An additional considera-tion was the need to compare our re-sults with those from other studies. In most studies in Canada and in the United States, children are defined as obese based on the measurement of triceps skinfold (12, 13).
Older children with a BMI value at or above the sex-specific 85th per-centile and both triceps skinfold and subscapular skinfold thickness at or above the 90th percentile were consid-ered obese, as has been suggested by the WHO (9).
The subscapular/triceps index (STI), which measures the body fat distribu-tion pattern, was calculated as SSK/ TRSK (10). An STI value between 0.76 and 0.99 was considered indicative of high risk of central fat distribution, and a value ≥1 as an indicator of ab-dominal obesity (14).
Sociodemographic information
The survey included 12 sociodemo-graphic items. Of the 12, the ones we used for our analysis were: age, gen-der, area (urban, rural), educational level (years of formal education) of parents, familial structure (nuclear,
3 Some organizations, including the World Health
matriarchal, extended), homeowner-ship, and having such services or household amenities as the Internet, cable TV, a hot water system, or a mi-crowave oven. Possession of the par-ticular services or amenities was used to determine an index of socioeco-nomic status according to the method-ology described by Madrigal (15). That methodology uses weighting for each service or household amenity so as to obtain a score that has a high, positive correlation with family income. The resulting scores were categorized in order to classify the population by so-cioeconomic status (SES): a score < 5, low SES; 5–15, middle SES; and > 15, high SES.
Statistical analyses
Data were examined with SPSS 10.0 for Windows computer software (SPSS
Inc., Chicago, Illinois, United States), using analyses of variance as appro-priate for continuous variables and chi-square tests for categorical data. Logistic regression models were de-veloped concurrently to test the effects of seven independent variables on overweight and obesity. Gender and area were included as dummy vari-ables. Age, socioeconomic index, num-ber of family memnum-bers, and parents’ educational level (years) were in-cluded as continuous variables. After examining bivariate relationships be-tween variables, multivariate back-ward conditional models were initially used to identify which of the corre-lated variables provided the best model with a particular dependent variable. Collinearity was minimized by this approach, and correlation coef-ficients between independent vari-ables included in the logistic regres-sion models did not exceed 0.3. A level of P< 0.05 was considered statistically significant.
RESULTS
Of the 1 780 eligible children, the parents of 1 718 of them (96.5%) con-sented to their participation in the study. The sample consisted of 839 males and 879 females; 53% were aged 7 through 9 years, and 47% were aged
10 through 12 years. All the school-children were from the same ethnic background, mestizo. Table 1 shows the demographic characteristics of the study population. Table 2 shows the percentiles for BMI of the study popu-lation by gender and age, and Table 3 shows similar data for triceps and sub-scapular skinfold thickness.
As defined by the 85th percentile of BMI, the prevalence of overweight was 34.5% (Table 4). Children aged 7–9, boys, children from urban areas, and children of high socioeconomic status had a higher prevalence of overweight. No statistically significant differences were found in the prevalence of over-weight when parents’ education and familial structure were analyzed.
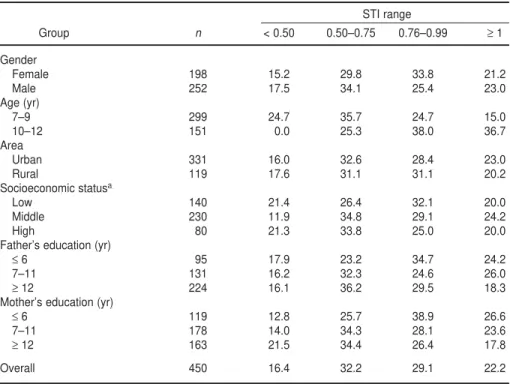
The prevalence of obesity was 26.2% (Table 4). A higher prevalence of obe-sity was found among children aged 7–9, boys, children from urban areas, and children of middle socioeconomic status. Likewise, a greater prevalence of obesity was found among children whose fathers had ≥ 12 years of edu-cation and whose mothers had 7–11 years of education. There were no im-portant differences in obesity preva-lence among types of familial structure. Around 22% of obese schoolchild-ren presented abdominal obesity (STI
≥1) (Table 5). On the other hand, 29% of children had an STI ranging from 0.76 to 0.99 (high risk of central fat
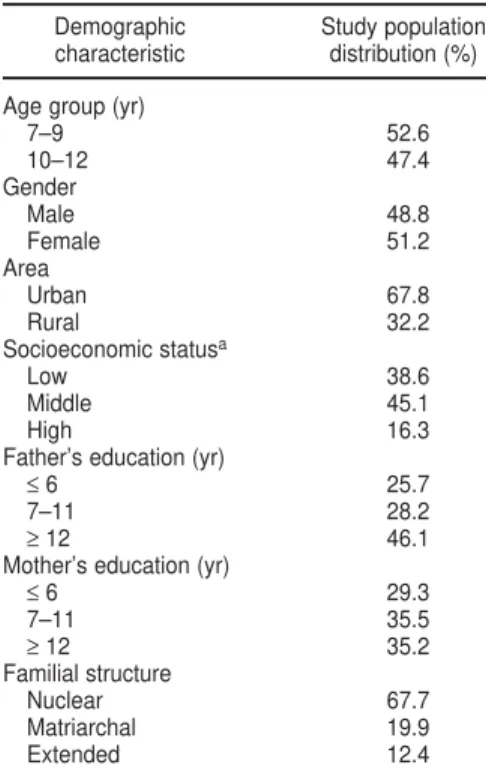
dis-TABLE 1. Distribution (%) of the study pop-ulation (n= 1 718) by demographic charac-teristics, study of prevalence of overweight and obesity among elementary school chil-dren, Costa Rica, 2000–2001
Demographic Study population characteristic distribution (%)
Age group (yr)
7–9 52.6
10–12 47.4
Gender
Male 48.8
Female 51.2
Area
Urban 67.8
Rural 32.2
Socioeconomic statusa
Low 38.6
Middle 45.1
High 16.3
Father’s education (yr)
≤6 25.7
7–11 28.2
≥12 46.1
Mother’s education (yr)
≤6 29.3
7–11 35.5
≥12 35.2
Familial structure
Nuclear 67.7
Matriarchal 19.9
Extended 12.4
aSocioenomic status was determined according to the methodology described by Madrigal (15).
TABLE 2. Percentiles of body mass index (BMI) for Costa Rican elementary school children in study of prevalence of overweight and obesity, 2000–2001
BMI value for the respective subgroup
Gender/Age (yr) n 5th 15th 50th 85th 95th
Males
7 148 14.25 14.99 17.09 19.89 22.50
8 142 14.38 15.46 17.88 22.35 24.85
9 144 15.06 15.61 17.48 21.05 23.96
10 173 14.78 15.91 18.15 23.10 25.15
11 126 15.51 16.19 19.64 24.45 27.61
12 106 15.21 16.12 18.53 22.35 25.04
Females
7 165 14.38 15.16 16.77 19.50 22.11
8 146 14.58 15.07 17.10 21.73 24.13
9 160 14.76 15.39 17.52 21.52 33.92
10 162 14.52 15.71 18.72 22.83 26.02
11 137 14.69 15.99 18.99 23.94 25.78
tribution). The prevalence of abdomi-nal obesity (STI ≥1) was higher in the older obese children (aged 10–12) than in the younger ones (aged 7–9) (P <
0.001). Table 5 shows the distribution of 450 obese school children by STI ranges.
The results of the logistic regression analyses are shown in Table 6. The odds of being overweight or obese were higher in boys than in girls. Older children had less risk of being either overweight (odds ratio (OR) = 0.88) or obese (OR = 0.75). In addition, higher socioeconomic status (OR = 1.03) was associated with being over-weight. At a 95% confidence level, the area and the other variables (parental education and number of family mem-bers) in the models had ORs that were not significantly different from 1.0.
DISCUSSION
The prevalence of overweight and obesity that we found in Costa Rican schoolchildren is alarming. Over-weight and obesity confer immediate psychosocial risk, such as social isola-tion, distorted body image, and social rejection in childhood. However, the most serious problems are heightened risk of persistent overweight and as-sociated long-term health risks (1–5, 16, 17). According to the Child and Adolescent Trial for Cardiovascular Health (CATCH), both excess weight and fatness are associated with ad-verse lipoprotein profiles, including in-creased total and apolipoprotein-B cholesterol and decreased HDL cho-lesterol (18). (Sponsored by the Na-tional Heart, Lung and Blood Institute
of the United States, CATCH was a field trial among elementary school children that was intended to test a program to reduce risk factors for heart disease). In addition, body fat-ness was significantly associated with increased blood pressure in the Bo-galusa Heart Study. (That study is a long-term epidemiological study cen-tered in a rural community in the state of Louisiana, which is in the southern part of the United States; the study has investigated critical questions con-cerning the early natural history of atherosclerosis (19).
In our study in Costa Rica, the prevalence of obesity was lower in the group over 9 years of age, which could reflect the maturing and developmen-tal processes that are typical of this age (9). However, it is likely that many
TABLE 3. Percentiles of triceps and subscapular skinfold thickness (mm) among Costa Rican elementary school children in study of preva-lence of overweight and obesity, 2000–2001
Skinfold/Gender/Age Skinfold thickness (mm) for the respective subgroup
(yr) group n 5th 10th 25th 50th 75th 85th 90th 95th
Triceps Males
7 148 6.00 7.00 9.00 11.00 15.00 17.00 18.00 20.77
8 142 6.50 7.00 10.00 12.91 16.25 21.00 23.00 25.00
9 144 7.00 8.00 10.00 12.25 17.37 19.62 21.75 24.75
10 173 7.00 8.00 10.00 13.50 18.33 21.90 24.00 27.30
11 126 8.00 8.85 10.41 14.00 20.87 24.00 25.30 28.00
12 106 7.14 8.00 10.00 12.00 15.62 17.95 18.65 21.00
Females
7 165 8.00 9.00 10.00 12.50 15.50 17.84 20.04 22.49
8 146 8.00 9.04 10.91 13.50 17.00 21.00 22.00 24.00
9 160 9.00 10.00 12.00 14.00 17.47 20.28 22.00 25.47
10 162 8.50 10.00 12.00 15.00 20.08 23.00 26.00 29.00
11 137 9.00 10.00 12.00 15.50 19.00 21.00 24.00 27.04
12 109 8.20 9.00 12.00 15.00 18.25 20.00 21.00 24.00
Subscapular Males
7 148 4.00 4.00 5.00 6.00 8.00 11.00 13.10 18.55
8 142 4.00 4.00 5.00 6.50 12.00 15.84 20.00 30.00
9 144 4.00 5.00 5.00 6.96 11.00 14.12 16.00 22.37
10 173 4.50 5.00 5.50 8.00 15.00 18.95 22.60 26.60
11 126 4.00 5.00 6.00 9.00 17.16 20.97 24.30 31.65
12 106 4.87 5.00 6.00 7.08 10.25 13.93 16.00 19.12
Females
7 165 4.50 4.60 5.26 6.50 10.00 12.00 17.00 23.70
8 146 4.50 5.00 5.95 7.91 12.00 15.00 18.30 21.65
9 160 4.50 5.00 6.00 8.00 14.00 17.21 19.00 22.00
10 162 4.50 5.00 7.00 10.66 16.00 22.00 25.00 28.00
11 137 5.00 6.00 7.00 10.50 16.00 21.00 23.00 28.00
overweight or obese children will go on to become overweight or obese adults (17). The CATCH study sug-gests that the ability to predict future obesity can begin with children as young as 6–9 years old (18). It has been shown that the relative risk of an obese child becoming an obese adult is six to seven times greater than that of his/her nonobese peers (16, 20). Sev-eral studies suggest that approxi-mately 42%–63% of obese schoolchild-ren become obese adults (16).
The prevalence of overweight and obesity that we found among the chil-dren in Costa Rica and the likelihood that those children will also be over-weight or obese as adults suggest there will be an increased need for treatment of associated morbidities in
the future. This is particularly impor-tant when we consider the high per-centage (29.1%) of obese children with a high risk of central fat distribution (subscapular/triceps index between 0.76 and 0.99). Observations in the Bo-galusa Heart Study (21, 22) show that adverse concentrations of triacylglyc-erol, LDL cholesttriacylglyc-erol, HDL choles-terol, and insulin are significantly as-sociated with a central or abdominal distribution of body fat in children and adolescents.
Abundant evidence shows that ab-dominal obesity increases the risk of developing insulin resistance and the metabolic syndrome (hyperinsuline-mia, dyslipide(hyperinsuline-mia, glucose intoler-ance, and hypertension) that links obe-sity with cardiovascular disease (1).
This appears to be quite important in Costa Rica, where coronary heart dis-ease (CHD) is the leading cause of death among adults and where the prevalence of type 2 diabetes mellitus in adults is increasing (23).
Several studies note that the central distribution of fat is genetically deter-mined and can be present from child-hood, although it is more clearly man-ifested during puberty (1), as was evidenced in this study. In addition, the available evidence points out the relationship between central obesity and type 2 diabetes mellitus (24). Therefore, our data for Costa Rica sug-gest that over 35% of the obese chil-dren aged 10–12 years may be at risk of suffering type 2 diabetes mellitus. Traditionally, type 2 diabetes mellitus
TABLE 4. Prevalence (%) of obesity and overweight among elementary school children in Costa Rica according to various demographic characteristics, 2000–2001
Obesity (%)
Overweight (%) Triceps ≥85th
aor BMI ≥
85th and triceps and
Demographic characteristic n BMI ≥85th Pvalue subscapular ≥90thb Pvalue
Gender 0.049 0.002
Female 879 32.3 22.5
Male 839 36.8 30.0
Age group (yr) 0.007 < 0.001
7–9 905 37.5 33.0
10–12 813 31.2 18.5
Area 0.006 < 0.001
Urban 1 164 36.7 28.4
Rural 554 30.0 21.5
Socioeconomic statusc < 0.001 < 0.001
Low 663 27.9 21.2
Middle 776 37.2 29.4
High 279 42.7 28.7
Father’s education (yr) 0.166 0.012
≤6 442 31.2 21.5
7–11 485 34.1 26.9
≥12 791 36.5 28.3
Mother’s education (yr) 0.118 0.002
≤6 505 31.3 21.6
7–11 610 35.6 29.2
≥12 603 36.2 27.0
Familial structure 0.189 0.117
Nuclear 1 162 33.6 26.2
Matriarchal 341 38.7 29.3
Extended 215 33.0 21.4
Overall 1 718 34.5 NAd 26.2 NAd
aYounger children (ages 7–9) were classified as obese if their triceps skinfold was greater than or equal to the 85th percentile for age and sex, using the percentiles by age for United States children as normative standards.
bOlder children (ages 10–12) with a BMI value at or above the sex-specific 85th percentile and both triceps skinfold and subscapular skinfold thickness at or above the 90th percentile were considered obese.
has been considered an adult disease and rare in pediatric populations. However, over the last decade, there has been a disturbing trend of
increas-ing numbers of type 2 diabetes cases in children in North America, particu-larly adolescents (24–26), mirroring the increasing rates of obesity in this
age group (26). Currently, type 2 dia-betes among youth is an emerging public health problem in several coun-tries, including Canada and the United States (24, 26, 27).
Different factors have been associ-ated with the development of obesity (1). For example, some authors point to an inverse relationship between so-cioeconomic status and obesity among adults and adolescents in industrial-ized countries, with socioeconomic status (SES) acting as a powerful influ-ence on the adoption of a healthy lifestyle (28). More-educated parents are better informed about proper health behaviors and adopt them, which is expected to lower the risk that their children will become obese. However, our findings in Costa Rica do not concur with those observations; on the contrary, our findings show a direct relationship between socioeco-nomic level and the prevalence of obe-sity. This association appears to be a typical behavior for a country in an economic transition (29). BMI distribu-tion varies significantly according to the stage of economic development reached (1). In the early stages of the economic transition, the wealthier sec-tion of the society shows an increase in the proportion of people with a high BMI. This tends to change in the later phases of the transition, with an in-crease in the prevalence of high BMI among the poor (1).
The direct relationship between SES and obesity that we found is remark-ably evident in the case of boys, with the obesity rate increasing from 21.9% in the low SES to 36.7% in the high SES (Table 7). This trend was also observed, although less strongly so, with both urban and rural children. However, the obesity rate tended to be similar— around 22%—among girls in the differ-ent social strata. This situation with girls is difficult to explain, but it could be argued that from an early age most girls tend be influenced by a social en-vironment that strongly suggests that a thin body image is ideal or socially acceptable.
On the other hand, the obesity rate that we found was remarkably higher in urban males than in their rural
TABLE 5. Distribution (%) of 450 obese Costa Rican elementary school children by sub-scapular/triceps index (STI) ranges, study of prevalence of overweight and obesity, 2000– 2001
STI range
Group n < 0.50 0.50–0.75 0.76–0.99 ≥1
Gender
Female 198 15.2 29.8 33.8 21.2
Male 252 17.5 34.1 25.4 23.0
Age (yr)
7–9 299 24.7 35.7 24.7 15.0
10–12 151 0.0 25.3 38.0 36.7
Area
Urban 331 16.0 32.6 28.4 23.0
Rural 119 17.6 31.1 31.1 20.2
Socioeconomic statusa
Low 140 21.4 26.4 32.1 20.0
Middle 230 11.9 34.8 29.1 24.2
High 80 21.3 33.8 25.0 20.0
Father’s education (yr)
≤6 95 17.9 23.2 34.7 24.2
7–11 131 16.2 32.3 24.6 26.0
≥12 224 16.1 36.2 29.5 18.3
Mother’s education (yr)
≤6 119 12.8 25.7 38.9 26.6
7–11 178 14.0 34.3 28.1 23.6
≥12 163 21.5 34.4 26.4 17.8
Overall 450 16.4 32.2 29.1 22.2
aSocioeconomic status was determined according to the methodology described by Madrigal (15).
TABLE 6. Logistic regression models using overweight and obesity as dependent variables, study of prevalence of overweight and obesity among Costa Rican elementary school chil-dren, 2000–2001
Variablea Odds ratio 95% confidence interval
Overweight
Gender (male)b 1.236 1.009–1.513
Age 0.878 0.825–0.933
Area (urban)c 1.119 0.868–1.442
Number of family members 0.963 0.909–1.021
Socioeconomic status index 1.027 1.013–1.042
Father’s education (yr) 0.991 0.943–1.041
Mother’s education (yr) 0.973 0.919–1.030
Obesity
Gender (male) 1.530 1.224–1.913
Age 0.751 0.701–0.805
Area (urban) 1.285 0.969–1.703
Number of family members 0.947 0.777–1.783
Socioeconomic status index 1.012 0.888–1.010
Father’s education (yr) 1.012 0.997–1.027
Mother’s education (yr) 0.970 0.959–1.069
aAge, socioeconomic index, number of family members, and parents’ educational levels were included as continuous variables.
counterparts (35% and 20%, respec-tively; data not shown), as has also been reported for adults in Costa Rica (30). This finding is probably due to differences in lifestyle. While some rural children walk long distances to attend school and spend more time in activities demanding high energy such as agricultural work or walking in hilly areas, urban children take the bus to school and spend around three hours per day watching TV (31). In ad-dition, it has been reported recently that the prevalence of sedentarism among Costa Rican urban boys aged 13–18 years is double the rate ob-served among their rural counterparts (43% and 20%, respectively) (32). The prevalence of cardiovascular diseases tends to be higher in men and in urban areas; therefore, reducing risk factors in these population groups from an early age could contribute to lower mortality rates.
It is difficult to compare our results to those reported in other countries be-cause a variety of criteria are used for overweight. However, a few compar-isons can be made from reports that have applied the same cutoff point as ours. Based on the 85th percentile, the 34.5% overweight prevalence that we found was more than 10 percentage points higher than the 22% figure re-ported by the Third National Health and Nutrition Examination Survey (NHANES III, 1988 to 1991) for United States children of the same ages as those included in this study (33). The 33% prevalence rate for obesity that we found in children under 10 years old was also some 10 percentage points higher than the 22% found in
the CATCH population in the United States (18). However, in the CATCH study, obesity was defined as a triceps skinfold thickness above the 85th percentile, whereas we also included children with triceps skinfolds at the 85th percentile. The 26.2% prevalence of obesity that we found in Costa Ri-can schoolchildren was also approxi-mately 10 percentage points higher than the 13% reported for Canadian children 7–12 years old (12), with the same criteria used in both countries.
Having used such a sensitive crite-rion to determine obesity in the older children (BMI at or above the sex-spe-cific 85th percentile and both triceps and subscapular skinfold thickness at or above the 90th percentile) limits the possibility of comparing our data. That is because, so far, no other studies are available that have used the same criterion. In any case, the prevalence of overweight and obesity evidenced in Costa Rican schoolchildren is consid-erably higher than what has been found in other countries, in spite of our having used such strict criteria.
Using the United States population as the reference standard has been pro-posed as a benchmark to facilitate com-mon definitions and communications (9). Upon comparison of the 50th per-centile of triceps and subscapular skin-folds, it is evident that Costa Rican children exhibit values remarkably higher than those of the United States reference standard. For example, at the triceps, the 50th percentiles for 7-year-old and 9-year-7-year-old Costa Rican males were 11.00 mm and 12.25 mm, respec-tively. The mean triceps measurements for the United States reference
popula-tion were 8.59 mm and 8.96 mm, re-spectively (9). At the subscapular, the 50th percentiles for 10-year-old and 12-year-old Costa Rican females were 10.66 mm and 10.00 mm, respectively. Measurements for the United States reference population were 6.4 mm and 7.7 mm, respectively (9). The BMI data for the Costa Rican children yielded the same pattern of higher values than those reported for the United States reference population. Our findings of a high adiposity level are consistent with a recent report on Costa Rica (34).
Various explanations are possible for the large differences between the mean values found for Costa Rican children and the ones for the United States reference population. The fac-tors may include differences between the populations in terms of genetics or in the pace of sexual maturation. Or, the reason might be the increasing trend towards obesity among Costa Ricans in recent decades. For example, in 1996 the prevalence of obesity in adult Costa Rican women was 46%, approximately 10% higher than the prevalence observed in 1982 (35).
Our BMI and body composition data for the Costa Rican children clearly suggest the need to implement short-term strategies to decrease the prevalence of obesity in the country. Evidently, Costa Rica is facing a seri-ous public health issue, which could have a marked effect on its economy. Although there are no data from Costa Rica, studies on the economic costs of obesity in other countries have shown that these costs account for between 2% and 7% of total health care ex-penses (1). The inclusion of costs asso-ciated with overweight would sub-stantially increase the attributed cost because the number of overweight in-dividuals in a community is generally three to four times greater than the number of those who are obese (1).
The health burden attributable to excess weight gain in Costa Rica and in other societies in transition is likely to be huge. This is because of the ab-solute numbers at risk, the large re-duction in life expectancy, and the fact that the problem particularly affects young individuals, who have a key
TABLE 7. Obesity rate (%) among Costa Rican elementary school children, by socioeco-nomic status and other variables, 2000–2001
Low Middle High
socioeconomic socioeconomic socioeconomic
Variable status status status Pvalue
Male 21.9 34.1 36.7 0.004
Female 20.1 25.2 21.8 0.062
Urban 23.8 30.8 28.8 0.046
Rural 19.1 27.6 27.6 0.003
role in promoting economic develop-ment. In developing countries, a large proportion of deaths associated with chronic diseases linked to overweight and obesity occur in the productive middle years of life, at ages much younger than those seen in developed countries (1). The results of our study
suggest that primary and secondary prevention measures, such as the ones suggested by the World Health Orga-nization (1), are needed in other to reduce the proportion of deaths due to chronic nontransmissible diseases among Costa Rican adults in the com-ing decades.
Acknowledgments. The authors
thank Dr. Jesús Rodríguez, M.D., M.S., for his constructive and helpful sug-gestions as well the staff at the Child Health Section of the Costa Rican In-stitute of Social Security (CCSS) for their support.
1. World Health Organization. Obesity: prevent-ing and managprevent-ing the global epidemic. Ge-neva: WHO; 2000. (WHO Technical Report Series 894).
2. Rössner S. Childhood obesity and conse-quences. Acta Paediatr 1998;87:1–5.
3. Nieto FJ, Szklo M, Comstock GW. Childhood weight and growth rate as predictors of adult mortality. Am J Epidemiol 1992;136:201–213. 4. Must A, Jacques PF, Dallal GE, Bajema CJ,
Dietz WH. Long-term morbidity and mortal-ity of overweight adolescents: a follow-up of the Harvard Growth Study of 1922 to 1935. N Engl J Med 1992;327:1350–1355.
5. DiPietro L, Mossberg HO, Stumkard AJ. A 40-year history of overweight children in Stock-holm: life-time overweight, morbidity, and mortality. Int J Obes 1994;18:585–590. 6. Frenk J, Frejka T, Bobadilla JL, Stern C,
Lozano R, Sepúlveda J, et al. La transición epi-demiológica en América Latina. Bol Oficina Sanit Panam 1991;111(6):485–495.
7. Costa Rica, Dirección General de Estadística y Censos. División territorial administrativa. San José: Ministerio de Economía, Industria y Comercio; 1996.
8. Lohman TG, Roche AS, Martorell R, eds. An-thropometric standardization reference man-ual. Champaign, Illinois, United States: Hu-man Kinetics; 1988.
9. World Health Organization. Physical status: the use and interpretation of anthropometry. Geneva: WHO; 1995. (WHO Technical Report Series 854).
10. Deurenberg P, Pieters JJL, Hautvast JGA. The assessment of the body fat percentage by skin-fold thickness measurements in childhood and young adolescents. Brit J Nutr 1990;63: 293–303.
11. Sarria A, Moreno LA, Garcia-Llop LA, Fleta J, Morellon MO, Bueno M. Body mass index, tri-ceps skinfold and waist circumference in screening for adiposity in male children and adolescents. Acta Paediatr 2001;90:387–392. 12. Limbert J, Crawford S, McCargar LJ. Estimates
of the prevalence of obesity in Canadian chil-dren. Obesity Research 1994;2:321–327. 13. Gortmaker SL, Dietz WH, Sobol AM, Wehler
CA. Increasing pediatric obesity in the United States. Am J Dis Child 1987;141:535–540.
14. Martínez E, Devesa M, Bacallao J, Amador M. Índice subescapular/tricipital: valores per-centilares en niños y adolescentes cubanos. Arch Latinoam Nutr 1993;43:199–203. 15. Madrigal J. La construcción de índices. San
José, Costa Rica: Editorial de la UCR; 1997. 16. Serdula MK, Ivery D, Coates RJ, Freedman
DS, Williamson DF, Byers T. Do obese chil-dren become obese adults? A review of the lit-erature. Prev Med 1993;22:167–177.
17. Guo SS, Roche AF, Chumlea WC, Gardner JC, Siervagel RM. The predictive value of child-hood body mass index values for overweight at age 35. Am J Clin Nutr 1994;59:810–819. 18. Dwyer J, Stone E, Yang M, Feldman H,
Web-ber L, Must Perry CL, et al. Predictors of over-weight and overfatness in a multiethnic pedi-atric population. Am J Clin Nutr 1998;67:602– 610.
19. Webber L, Wattigney W, Srinivasan S, Beren-son G. Obesity studies in Bogalusa. Am J Med Sci 1995;310(suppl 1):S53–S61.
20. Abraham S, Collins G, Nordisiek M. Relation-ship of childhood weight status to morbidity in adults. Publ Health Rep 1971;85:273–284. 21. Freedman D, Srinivasan S, Burke G, Shear C,
Smoak C, Harsha D, et al. Relation of body fat distribution to hyperinsulinemia in children and adolescents: the Bogalusa Heart Study. Am J Clin Nutr 1987;46:403–410.
22. Freedman DS, Serdula MK, Srinivasan SR, Berenson GS. Relation of circumferences and skinfold thickness to lipid and insulin concen-tration in children and adolescents: the Bo-galusa Heart Study. Am J Clin Nutr 1999;69: 308–317.
23. Morice AC. Situación de las enfermedades crónicas no transmisibles en Costa Rica. Tres Ríos, Costa Rica: Instituto Costarricense de In-vestigación y Enseñanza en Nutrición y Sa-lud; 1998. (Monografía 24).
24. Fagot-Campagna A, Pettitt D, Engelgan M, Burrows N, Geis L, Valdez R, et al. Type 2 di-abetes among North American children and adolescents: an epidemiologic review and a public health perspective. J Pediatr 2000;136: 664–672.
25. Arslanian SA. Type 2 diabetes mellitus in chil-dren: pathophysiology and risk factors. J Pe-diatr Endocrinol Metab 2000;13:1385–1394.
26. Fagot-Campagna A. Emergence of type 2 dia-betes mellitus in children: epidemiological evidence. J Pediatr Endocrinol Metab 2000;13: 1395–1402.
27. Dabela D, Pettitt DJ, Jones KL, Arslanian SA. Type 2 diabetes mellitus in minority children and adolescents. An emerging problem. En-docrinol Metab Clin North Am 1999;28:709– 729.
28. Kaplan G, Keil J. Socioeconomic factors and cardiovascular disease: a review of the litera-ture. Circulation 1993;88:1973–1998. 29. Peña M, Bacallao J. La obesidad en la pobreza:
un problema emergente en las Américas. In: Organización Panamericana de la Salud. La obesidad en la pobreza: un nuevo reto para la salud pública. Washington, D.C.: OPS; 2000. Pp. 3–12. (Publicación Científica No. 576). 30. Campos H, Mata L, Siles X, Vives M, Ordovas
JM, Schaefer EJ. Prevalence of cardiovascular risk factors in rural and urban Costa Rica. Cir-culation 1992;85:648–658.
31. Fernández H, Pearson G, Moncado J, Salas R, González C. Evaluación de la salud física de estudiantes de la educación general básica. San José, Costa Rica: Programa de Medición y Evaluación Educativa (Convenio Universidad de Costa Rica-Ministerio de Educación Pú-blica); 1997.
32. Monge R, Beita O. Prevalence of coronary heart disease risk factors in Costa Rican ado-lescents. J Adolesc Health 2000;27:210–217. 33. Troiano R, Flegal K, Kuczmarski RJ, Campbell
SM, Johnson CL. Overweight prevalence and trends for children and adolescents. Arch Pe-diatr Adolesc Med 1995;149:1085–1091. 34. Irwig M, Siles X, Gotto AM, Rifai N, Campos
H. Plasma lipids and other cardiovascular risk factors in Costa Rican adolescents. Rev Panam Salud Publica 2000;8:234–241.
35. Costa Rica, Ministerio de Salud. Encuesta na-cional de Nutrición. Fascículo 1: antro-pometría. San José: Ministerio de Salud; 1996.
Manuscript received 15 February 2002. Revised version accepted for publication on 4 October 2002.
Objetivo.Dado que el peso corporal excesivo durante la niñez influye en el desarrollo de varias enfermedades crónicas en la adultez, se llevó a cabo este estudio en escolares de nivel primario de áreas urbanas y rurales de Costa Rica, para determinar la prevalencia del sobrepeso y la obesidad.
Métodos. El estudio se llevó a cabo de julio de 2000 a abril de 2001. Se seleccionó un total de 1 718 estudiantes de 7 a 12 años de edad de 34 escuelas de la capital (San José) y de áreas rurales y urbanas cercanas. Se consideró que tenían sobrepeso tanto los niños menores (de 7 a 9 años) como los mayores (de 10 a 12 años) cuyo índice de masa corporal era igual o mayor al del 85% de los niños, según sexo. Se consideraron obe-sos a los niños menores si el pliegue cutáneo de sus tríceps era igual o mayor al del 85% de los niños estadounidenses de la misma edad y sexo, como estándares norma-tivos. Se consideraron obesos a los niños mayores si su índice de masa corporal era igual o mayor al del 85% de los niños del mismo sexo y el espesor del pliegue cutá-neo, tanto de tríceps como subescapular, era igual o mayor al del 90%.
Resultados.La prevalencia de sobrepeso fue del 34,5%. Niños de 7 a 9 años, los varones, niños de áreas urbanas y los niños de nivel socioeconómico más alto tenían mayor prevalencia de sobrepeso. La prevalencia de obesidad fue del 26,2%. Se en-contró mayor prevalencia de obesidad entre niños de 7 a 9 años, varones, los niños de áreas urbanas, y aquéllos de nivel socioeconómico mediano.
Conclusiones. Dada la alta prevalencia de obesidad que se encontró en los niños costarricenses estudiados, es necesario aplicar medidas primarias y secundarias para reducir la proporción de muertes atribuibles a enfermedades crónicas no transmisi-bles entre adultos costarricenses en los próximos decenios.
RESUMEN
Prevalencia del sobrepeso
y la obesidad entre escolares
de nivel primario
en Costa Rica
La salud a través de la historia
En 2002 la Organización Panamericana de la Salud publicó una colección de citas que se tituló sen-cillamente Salud. El prefacio invita a los lectores a que contribuyan a próximas ediciones, sobre todo con aportes de escritores latinoamericanos. Nos han sugerido las siguientes citas del prócer cubano, José Martí (1853–1895)...
“En las selvas de nuestra América abundan remedios para todas las enfermedades que en nuestro suelo se producen”.
“En estos tiempos de ansiedad de espíritu, urge fortalecer el cuerpo que ha de mantenerlo”.
“La verdadera medicina no es la que cura, sino la que precave: la Higiene es la verdadera medicina”.
y de la trayectoria geohistórica del mosquito que hace el ilustre Dr. Carlos J. Finlay (1833–1915) en su famoso “El mosquito hipotéticamente considerado como agente de transmisión de la fiebre amarilla”…