A
rt
igo
Brazilian Journal of Pharmacognosy 18(4): 549-556, Out./Dez. 2008 Received 3 September 2008; Accepted 3 October 2008
Analysis of a Brazilian green propolis from Baccharis
dracunculifolia by HPLC-APCI-MS and GC-MS
Roberto Chang,
1Dorila Piló-Veloso,
2Sérgio A. L. Morais,
1Evandro A. Nascimento*
,11Instituto de Química, Universidade Federal de Uberlândia, Av. João Naves de Ávila, 2160,
38400-902 Uberlândia-MG, Brazil,
2Departamento de Química, Universidade Federal de Minas Gerais, Av. Antônio Carlos, 6627, 31270-901
Belo Horizonte-MG, Brazil,
RESUMO:“Análise de uma própolis verde brasileira da Baccharis dracunculifolia por CLAE-ICPA-EM e CG-EM”.Os extratos em etanol e diclorometano de uma própolis verde de Baccharis dracunculifolia foram analisados por CLAE-ICPA-EM e CG-EM, respectivamente. A técnica de CLAE-EM-ICPA, no modo positivo, forneceu uma completa e inequívoca composição química da amostra de própolis verde. Ela serve como impressão digital para amostras diferentes de própolis. A composição do extrato em etanol consistiu fundamentalmente de ácido cinâmico e derivados, fl avonóides, ácido benzóico e alguns benzoatos, aromáticos não hidroxilados, e ácidos e ésteres alifáticos, os quais são normalmente ignorados na literatura porque não absorvem luz UV. Os constituintes principais do extrato em diclorometano foram compostos prenilados, alcanos e terpenóides.
Unitermos:Baccharis dracunculifolia, Asteraceae, própolis, própolis verde, CLAE-EM-IQPA, CG-EM.
ABSTRACT: Ethanol and dichloromethane extracts of a Brazilian green propolis from Baccharis dracunculifolia were analyzed by APCI-MS and GC-MS, respectively. The HPLC-APCI-MS technique, at the positive mode, furnished a complete and unequivocal chemical composition of the green propolis sample. It serves as fi ngerprint for different propolis samples.
The composition of the ethanol extract consisted mainly of cinnamic acid and derivatives, fl avonoids, benzoic acid and a few benzoates, non-hydroxylated aromatics, and aliphatic acids and esters, which are normally not reported in the literature because they do not absorb UV light. The main constituents of the dichloromethane extract were prenylated compounds, alkanes and terpenoids.
Keywords:Baccharis dracunculifolia, Asteraceae, propolis, green propolis, HPLC-APCI-MS,
GC-MS.
INTRODUCTION
Propolis is a resinous material produced by honeybees from vegetable resins, exudates, wax, pollen, leaf pieces, and self-secretion. It is used to seal and to protect the hive against heat, cold, wind, water, insects and microorganisms. (Ghisalberti, 1979; Rohwedder and Hausteen, 1987; Neto et al., 2002).
Propolis ethanol extracts have been used in the popular medicine for different purposes (Niraldo, et al., 2006; Soares et al., 2006; Tavares et al., 2006; Lemos et al., 2007; Missima and Sforcin, 2008; Simões et al., 2008). Flavonoids contained in European propolis were considered the constituents that had the benefi cial action on the human organism. However in the last recent years many propolis other than the European ones have demonstrated therapeutic properties and they do not
contain or contain insignifi cant amount of fl avonoids (Park et al., 2000; Pereira et al., 2002; Longhini et al., 2007; Sousa et al., 2007).
Review publications report that over a hundred compounds were already identifi ed in propolis (Greenaway et al., 1991; Marcucci, 1996; Lustosa et al., 2008). The propolis analysis is a very diffi cult task because their composition changes according to the region, season and existing fl ora in addition to the inherent diffi culties associated to analysis of complex mixtures from vegetal sources. In spite of that, various researchers demonstrated that Baccharis dracunculifolia
2008).
By means of derivatization with BSTFA, GC-MS analysis and a lot of reference compounds, over a hundred compounds could be identifi ed in a propolis sample (Greenaway et al., 1991). The limitations of this technique reside on a more complex mixture after derivatization, the need of many rare reference compounds and the presence of non-volatile or underivatizable compounds that cannot be detected accordingly. Even using high temperatures (near 400
oC), this technique has limitations (Neto et al., 2002)
Actually the tedious work on column fractionations and isolation of unknown compounds is giving place to high performance liquid chromatography (HPLC), which can provide a quickly separation of the components, quantifi cation and information related to its UV spectrum. When coupled to Infrared (IR), Nuclear Magnetic Resonance (NMR) or Mass Spectrometry (MS), the HPLC can expand much more its analysis range. Especially the HPLC-MS technique is very useful because it avoids the limitations imposed by the UV detection while detecting also the molecules that do not absorb in the UV region. Today the HPLC-MS can use modern revolutionary techniques like ESI (electrospray ionization), APCI (atmospheric pressure chemical ionization), MALDI (matrix-assisted laser desorption/ ionization), etc. that volatilize organic molecules of low and high molecular weights having medium to high polarity (Hoffmann and Stroobant, 2001).
Some of these new techniques were recently employed on propolis analysis (Valcic et al., 1999; Midorikawa et al., 2001; Pietta et al., 2002; Kumazawa et al., 2003).
Due to the broad use in the medicine, actually
the propolis investigation work is focused on ethanol extracts. Many model compounds were used to investigate samples of Brazilian propolis by HPLC-ESI-MS at the negative mode (Midorikawa et al., 2001). Based on the retention times and mass spectra of forty-one standards, these authors identifi ed a lot of components in the propolis samples. Sawaya and collaborators also used the HPLC-ESI-MS at negative mode to identify eight markers in Brazilian propolis from different origins (Sawaya et al., 2004). Finally, using the same technique and others procedures, Kumazawa and collaborators compared propolis ethanol extracts from fourteen different countries (Kumazawa et al., 2004).
In the present work an attempt to expand the range of identifi cation of the constituents of a propolis ethanol extract is presented. HPLC-APCI-MS at the positive mode was used and the identifi cation was based on mass spectrometry, standards, UV spectrum, retention times, Kovat’s indexes (Adams, 2001), the publications cited above and others (Nascimento and Bezzan, 2001; Neto et al., 2002; Nascimento et al., 2003a; Nascimento et al., 2003b; Nascimento et al., 2008; Negri et al., 2003).
Finally, a GC-MS investigation of the dichloromethane extract of the same propolis was also carried out in order to complement the data acquired from HPLC-APCI-MS.
MATERIAL AND METHODS
Propolis sample
The Santa Barbara Apiary located in the State of Minas Gerais supplied the sample of green propolis.
Retention time
(min) Compound
18.3 ethyl cinnamate
20.2 benzyl caffeate
22.1 cinnamyl caffeate
24.0 cinnamyl coumarate
25.8 dihydrocinnamyl ferulate
27.1 pinobanksin 29.6 kaempferol
32.8 2,2-dimethyl-6-cromene-6-propenoic acid,3-prenyl-p-coumaric acid
34.0 methyl 2,2-dimethyl-6-chromene-propenoate
34.6 diprenyl coumarate and n.i. (λ 238, 318 nm)
35.5 pinobanksin-3-acetate, kaempferide, dihydrokaempferide
36.0 ermanin
36.6 capillartemisin A
37.3 (E)-3-[2,3-dihydro-2-(1-methylethenyl)-7-prenyl-5-benzofuranyl]-2-propenoic acid 38.2 (E)-3-[2,3-dihydro-2-(1-hydroxy-1-methylethyl)-7-prenyl-5-benzofuranyl]-2-propenoic acid
38.9 artepillin C
41.0 n.i. ( λ 220, 286 nm) and n.i. (λ 235, 278 nm) 41.9 n.i. (λ262, 318 nm)
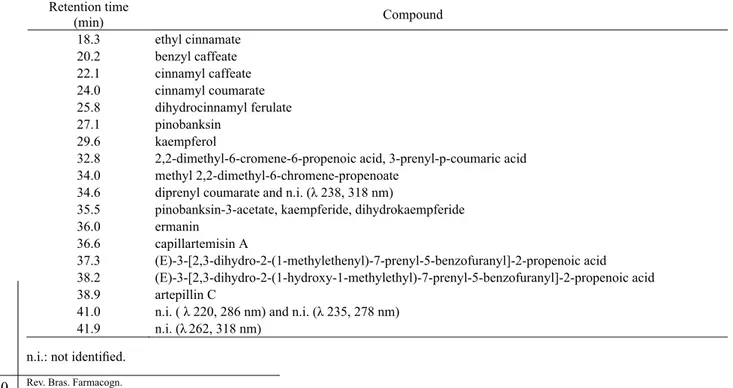
Table 1. Components of the EEP related to Figure 1.
It was collected in October and is representative of green propolis from Baccharis dracunculifolia as comproved by several analyses of green propolis samples from different regions. The ethanol extract of propolis (EEP) was obtained by mixing 3.00 g of sample with 10.0 mL of ethanol (Vetec brand, analytical grade, 95 %). The mixture was stirred for 24 hours away from light and then
fi ltered and put into a freezer to separate the wax. A new
fi ltration gave the studied extract. The dichloromethane extract of propolis (DEP) was obtained using another 3.00 g sample as above, except on that it was not put into the freezer for wax separation.
Gas chromatography coupled to mass spectrometry (GC-MS)
The analysis was performed in a gaseous chromatograph by Shimadzu, model GC-17A, equipped with a DB-5 30 meters capillary column, 0.25 mm of i.d., 0.25 m of fi lm thickness, coupled to a mass spectrometer of same brand, model GCMS-QP5000, equipped with database of 330.000 mass spectra. The runs were performed under the following conditions: initial column temperature: 60 oC, injector at 220 oC
and interface at 240 oC; column program: 60-240 oC
at 3 oC/min, 20 min at 240 oC. 1 μL of the sample of
was injected under helium as carrier gas. The mass spectrometer worked under impact energy of 70 eV and the mass detection included molecules from 40 to 450 Da.
High performance liquid chromatography coupled to mass spectrometry (HPLC-MS)
The HPLC runs were performed on a Shimadzu Class VP series liquid chromatograph equipped with diode array detector (PDA) and a reversed-phase CLC-ODS 30 cm column. The gradient conditions used were methanol HPLC grade and water/formic acid (0.5%), starting with methanol 20% and after 40 minutes, 100% methanol, in a 60 minutes run. The injected volume was 20 μL.
The high performance liquid chromatography coupled to atmospheric pressure chemical ionization and mass spectrometry (HPLC-APCI-MS) analysis, at the positive mode, was carried out in a Quattro LC-Micromass Mass Spectrometer. The chromatogram presented in this work (Figure 2) is the Total Ions Chromatogram, TIC.
Identifi cation of the propolis constituents
The identifi cation of the propolis components was based on a long and tedious work with standards, mass spectra library (Wiley 7), private UV spectra library, retention times, Kovat’s indexes, and literature. As the compounds were not isolated and directly
compared with standards, it is not warranted that they really are the assigned ones.
RESULTS AND DISCUSSION
Figure 1 presents the HPLC chromatogram of EEP. Low retention time components (less than 15 minutes), as chlorogenic, gallic, benzoic and caffeic acids, and vanillin are practically absent. This is not in agreement with HPLC results reported by Park and collaborators (Park et al., 2004) as well as Midorikawa and collaborators (Midorikawa et al., 2001). Both groups worked with ethanol extracts of green propolis
Figure 1. HPLC chromatogram of the ethanol extract of propolis.
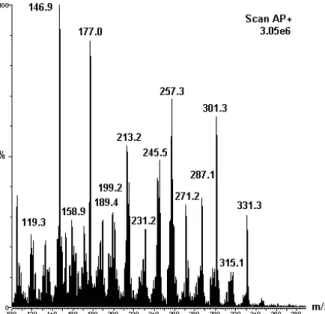
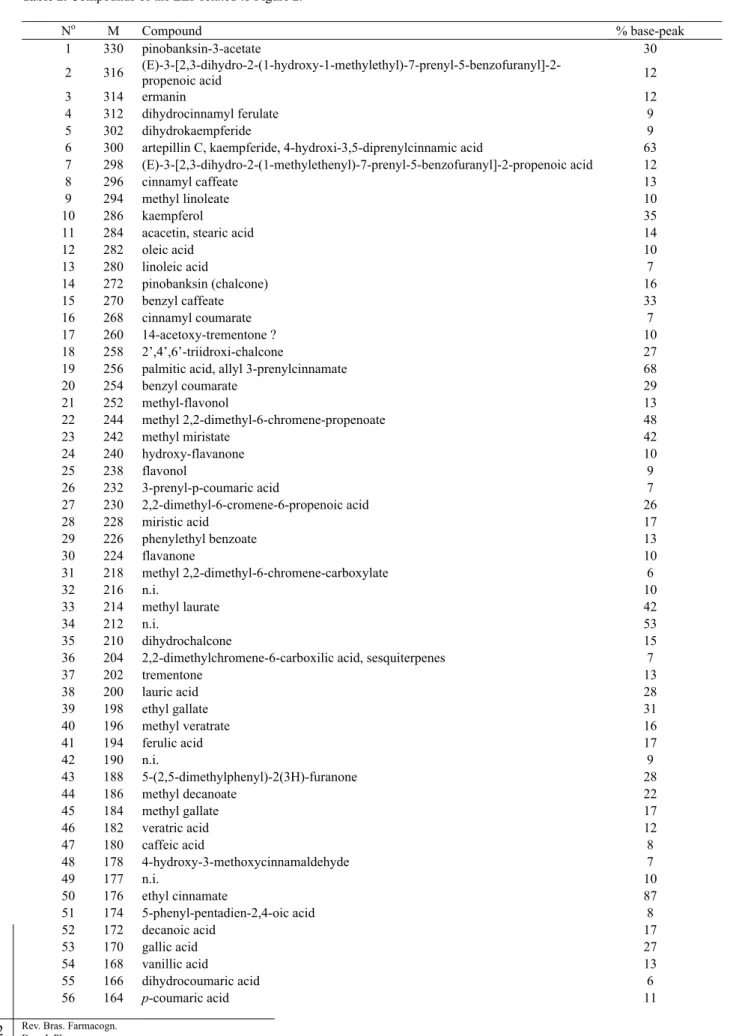
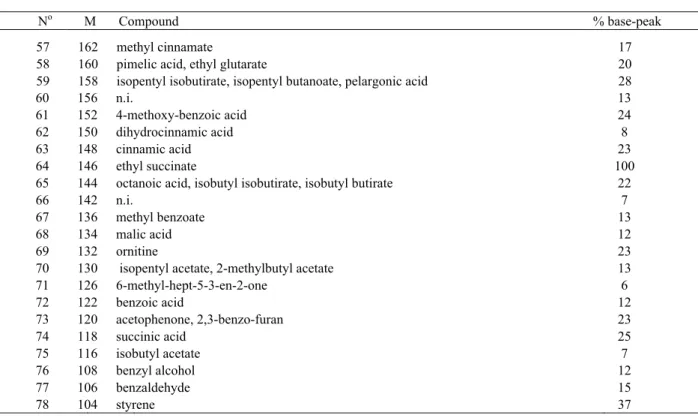
Figure 2. APCI-MS chromatogram of the ethanol extract of propolis.
No M Compound % base-peak
1 330 pinobanksin-3-acetate 30
2 316
(E)-3-[2,3-dihydro-2-(1-hydroxy-1-methylethyl)-7-prenyl-5-benzofuranyl]-2-propenoic acid 12
3 314 ermanin 12
4 312 dihydrocinnamyl ferulate 9
5 302 dihydrokaempferide 9
6 300 artepillin C, kaempferide, 4-hydroxi-3,5-diprenylcinnamic acid 63
7 298 (E)-3-[2,3-dihydro-2-(1-methylethenyl)-7-prenyl-5-benzofuranyl]-2-propenoic acid 12
8 296 cinnamyl caffeate 13
9 294 methyl linoleate 10
10 286 kaempferol 35
11 284 acacetin, stearic acid 14
12 282 oleic acid 10
13 280 linoleic acid 7
14 272 pinobanksin (chalcone) 16
15 270 benzyl caffeate 33
16 268 cinnamyl coumarate 7
17 260 14-acetoxy-trementone ? 10
18 258 2’,4’,6’-triidroxi-chalcone 27
19 256 palmitic acid, allyl 3-prenylcinnamate 68
20 254 benzyl coumarate 29
21 252 methyl-flavonol 13
22 244 methyl 2,2-dimethyl-6-chromene-propenoate 48
23 242 methyl miristate 42
24 240 hydroxy-flavanone 10
25 238 flavonol 9
26 232 3-prenyl-p-coumaric acid 7
27 230 2,2-dimethyl-6-cromene-6-propenoic acid 26
28 228 miristic acid 17
29 226 phenylethyl benzoate 13
30 224 flavanone 10
31 218 methyl 2,2-dimethyl-6-chromene-carboxylate 6
32 216 n.i. 10
33 214 methyl laurate 42
34 212 n.i. 53
35 210 dihydrochalcone 15
36 204 2,2-dimethylchromene-6-carboxilic acid, sesquiterpenes 7
37 202 trementone 13
38 200 lauric acid 28
39 198 ethyl gallate 31
40 196 methyl veratrate 16
41 194 ferulic acid 17
42 190 n.i. 9
43 188 5-(2,5-dimethylphenyl)-2(3H)-furanone 28
44 186 methyl decanoate 22
45 184 methyl gallate 17
46 182 veratric acid 12
47 180 caffeic acid 8
48 178 4-hydroxy-3-methoxycinnamaldehyde 7
49 177 n.i. 10
50 176 ethyl cinnamate 87
51 174 5-phenyl-pentadien-2,4-oic acid 8
52 172 decanoic acid 17
53 170 gallic acid 27
54 168 vanillic acid 13
55 166 dihydrocoumaric acid 6
56 164 p-coumaric acid 11
No M Compound % base-peak
n.i.: not identifi ed.
60 156 n.i. 13
61 152 4-methoxy-benzoic acid 24
62 150 dihydrocinnamic acid 8
63 148 cinnamic acid 23
64 146 ethyl succinate 100
65 144 octanoic acid, isobutyl isobutirate, isobutyl butirate 22
66 142 n.i. 7
67 136 methyl benzoate 13
68 134 malic acid 12
69 132 ornitine 23
70 130 isopentyl acetate, 2-methylbutyl acetate 13
71 126 6-methyl-hept-5-3-en-2-one 6
72 122 benzoic acid 12
73 120 acetophenone, 2,3-benzo-furan 23
74 118 succinic acid 25
75 116 isobutyl acetate 7
76 108 benzyl alcohol 12
77 106 benzaldehyde 15
78 104 styrene 37
57 162 methyl cinnamate 17
58 160 pimelic acid, ethyl glutarate 20
59 158 isopentyl isobutirate, isopentyl butanoate, pelargonic acid 28
but the ethanol concentration was 80 %, which allows better dissolution of more hydrophilic compounds.
The peaks observed at the chromatogram belong practically to cinnamic acid derivatives and fl avonoids (Table 1) and are in good agreement with the results obtained elsewhere (Pietta et al., 2002; Midorikawa et al., 2001). The prenylated compounds are very important constituents of green propolis (Vasconcelos, 2006; Pereira et al., 2202, Bankova et al., 1999).
Figure 1 is a good example for the HPLC technique constraints. Even using diode array detector the number of detected components is relatively low. This is due to different absorbance of the constituents (the apparatus is automatically calibrated according to the higher absorbance), no detection of compounds that do not absorb UV light, and peak overlapping.
Figure 2 presents the APCI-MS chromatogram of the EEP. Using the positive mode, the molecular ions appear as [M + 1]. Comparing Figure 2 with Figure 1, it is evident that this new technique gives much more information about the extract than the HPLC does. The number of detected compounds is incomparably greater and includes much more molecules, which absorb or not UV light. This chromatogram is the best indirect view of the extract composition and can be used as fi ngerprint of it. Certainly an APCI-MS chromatogram of another propolis ethanol extract will be different.
In Figure 2, the detected mass range goes from circa 100 Da to 350 Da, confi rming the absence of chlorogenic acids and other high molecular weight compounds as dimeric coniferyl acetate (M=442),
propolis benzofurans A (M=454) and B (M=438), (E)-3-(2,3-dihydro-2-(1-methyethenyl)-7-prenyl-5-benzofuranyl-2-propenoic acid (M=448), etc. and also the insignifi cant presence of small molecules (Midorikawa et al., 2001).
Table 2 shows the identifi ed and not identifi ed compounds corresponding to Figure 2, with the respective percentage (TIC). Only the compounds whose concentration was greater than 5 % of the base peak were took in account.
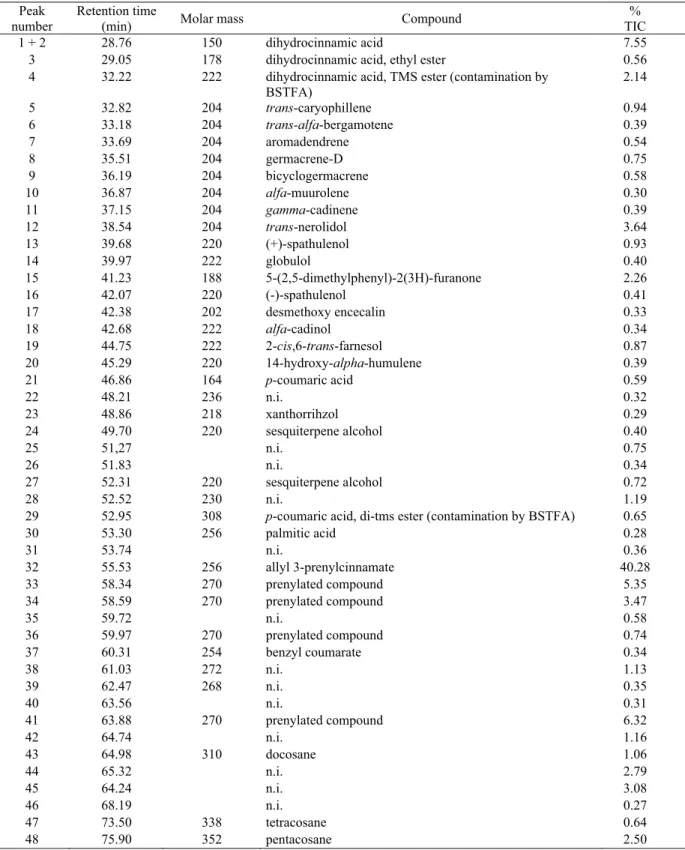
For the fi rst time a complete table showing the compounds present in the propolis ethanol extract is shown. The main constituents were cinnamic acid and derivatives, fl avonoids, benzoic acid and a few benzoates, non-hydroxylated aromatics, and aliphatic acids and esters. The aliphatic compounds are normally not reported in the literature because they do not absorb UV light. It is very important to note that the presence of compounds that do not absorb UV light is signifi cant. All of the compounds of Table 2 have already been reported in the propolis literature but a lot of them were not reported in ethanol extracts. Allyl 3-prenylcinnamate, which was isolated from chloroform extract of Baccharis dracunculifolia green propolis (Negri et al., 2003), has been recently proposed as chemical marker for this kind of propolis (Nascimento et al., 2008).
Peak number
Retention time
(min) Molar mass Compound
% TIC
1 + 2 28.76 150 dihydrocinnamic acid 7.55
3 29.05 178 dihydrocinnamic acid, ethyl ester 0.56
4 32.22 222 dihydrocinnamic acid, TMS ester (contamination by
BSTFA)
2.14
5 32.82 204 trans-caryophillene 0.94
6 33.18 204 trans-alfa-bergamotene 0.39
7 33.69 204 aromadendrene 0.54
8 35.51 204 germacrene-D 0.75
9 36.19 204 bicyclogermacrene 0.58
10 36.87 204 alfa-muurolene 0.30
11 37.15 204 gamma-cadinene 0.39
12 38.54 204 trans-nerolidol 3.64
13 39.68 220 (+)-spathulenol 0.93
14 39.97 222 globulol 0.40
15 41.23 188 5-(2,5-dimethylphenyl)-2(3H)-furanone 2.26
16 42.07 220 (-)-spathulenol 0.41
17 42.38 202 desmethoxy encecalin 0.33
18 42.68 222 alfa-cadinol 0.34
19 44.75 222 2-cis,6-trans-farnesol 0.87
20 45.29 220 14-hydroxy-alpha-humulene 0.39
21 46.86 164 p-coumaric acid 0.59
22 48.21 236 n.i. 0.32
23 48.86 218 xanthorrihzol 0.29
24 49.70 220 sesquiterpene alcohol 0.40
25 51,27 n.i. 0.75
26 51.83 n.i. 0.34
27 52.31 220 sesquiterpene alcohol 0.72
28 52.52 230 n.i. 1.19
29 52.95 308 p-coumaric acid, di-tms ester (contamination by BSTFA) 0.65
30 53.30 256 palmitic acid 0.28
31 53.74 n.i. 0.36
32 55.53 256 allyl 3-prenylcinnamate 40.28
33 58.34 270 prenylated compound 5.35
34 58.59 270 prenylated compound 3.47
35 59.72 n.i. 0.58
36 59.97 270 prenylated compound 0.74
37 60.31 254 benzyl coumarate 0.34
38 61.03 272 n.i. 1.13
39 62.47 268 n.i. 0.35
40 63.56 n.i. 0.31
41 63.88 270 prenylated compound 6.32
42 64.74 n.i. 1.16
43 64.98 310 docosane 1.06
44 65.32 n.i. 2.79
45 64.24 n.i. 3.08
46 68.19 n.i. 0.27
47 73.50 338 tetracosane 0.64
48 75.90 352 pentacosane 2.50
Table 3. Components of the DEP having concentration ≥ 0.27% (related to Figure 3).
n.i.: not identifi ed.
to the green propolis. Allyl 3-prenylcinnamate is longer the more abundant and until today was detected only in the Baccharis dracunculifolia resin and therefore was proposed as chemical marker for this kind of propolis (Nascimento et al., 2008).
Taking in account that the ethanol and
that are not volatile. However, the analysis of volatile molecules by GC is very important to classify the aroma and plant sources of the propolis. Actually, the analysis of both extracts, EEP and DEP, are complementary for a better propolis chemical investigation.
CONCLUSION
The HPLC-APCI-MS technique, at the positive mode, provided a complete and unequivocal chemical composition of a green propolis sample. It serves as
fi ngerprint for different propolis samples. The main constituents of the 95 % ethanol extract of the green propolis from Baccharis dracunculifolia were cinnamic acid and derivatives, fl avonoids, benzoic acid and a few benzoates, non-hydroxylated aromatics, and aliphatic acids and esters. The main constituents of the dichloromethane extract were prenylated compounds, alkanes and terpenoids. By means of this technique it was possible to detect the showed aliphatic compounds which are normally not reported in the literature because they do not absorb UV light.
ACKNOWLEDGMENTS
To Prof. Dr. Edson Rodrigues Filho (DQ-UFSCAR - São Carlos, Brazil) for the HPLC-APCI-MS analysis and discussion.
REFERENCES
Adams RP 2001. Identifi cation of Essential Oil Components by Gas Chromatography/Quadrupole Mass Spectroscopy Allured Publishing Corp., Illinois. Bankova V, Krasteva GB, Sforcin JM, Frete X, Kujumgieev A,
Rodella RM, Popov S 1999. Phytochemical evidence for the plant origin of Brazilian propolis from São Paulo State. Z Naturforsch 54c: 401-405.
Bastos EM, Oliveira VDC, Soares AEE 2000. Characterization of the green propolis produced in Minas Gerais State, Brazil.Honeybee Sci21: 179-180.
Ghisalberti EL 1979. Propolis: a review. Bee World 60: 59-84.
Greenaway W, May J, Scaysbrook T, Whatley FR 1991. Identification by gas chromatography-mass spectrometry of 150 compounds in propolis. Z Naturforsch 46c: 111-121.
Hoffmann E, Stroobant V 2001. Mass Spectrometry: Principles and Applications. John Wiley & Sons, Chichester. Kumazawa S, Yoneda M, Shibata I, Kanaeda J, Hamasaka T,
Nakayama T 2003. direct evidence for the plant origin of Brazilian propolis by the observation of honeybee behavior and phytochemical analysis. Chem Pharm Bull 51: 740-742.
Kumazawa S, Hamasaka T, Nakayama T 2004. Antioxidant activity of propolis of various geographic origins. Food Chem 84: 329-339.
Lemos M, Barros MP, Sousa JPB, Silva Filho AA, Bastos JK, Andrade SF 2007. Baccharis dracunculifolia, the main botanical source of Brazilian green propolis,
displays antiulcer activity. J Pharm Pharmacol 59: 603-608.
Longhini R, Raksa SM, Oliveira ACP, Svidzinski TIE, Franco SL 2007. Obtenção de extratos de própolis sob diferentes condições e avaliação de sua atividade antifúngica. Rev Bras Farmacogn 17: 388-395. Lustosa SR, Galindo AB, Nunes LCC, Randau KP, Rolim
Neto PJ 2008. Própolis: atualizações sobre a química e a farmacologia. Rev Bras Farmacogn 18: 447-454. Marcucci MC 1996. Propriedades biológicas e farmacêuticas
dos constituintes da própolis. Quim Nova 19: 529-536.
Midorikawa K, Banskota AH, Tezuka Y, Nagaoka T, Matsushige K, Message D, Huertas AAG, Kadota S 2001. Liquid chromatography-mass spectrometry analysis of propolis. Phytochem Anal 12: 366-373. Missima F, Sforcin JM 2008. Green Brazilian propolis action
on macrophages and lymphoid organs of chronically stressed mice. Evid-Based Compl Alt Med 5: 71-75. Nascimento EA, Bezzan LCF 2001. Estudo da própolis
do Triângulo Mineiro. Parte 1: Identifi cação dos constituintes solúveis em metanol/acetato de etila por CG-EM. Mensagem Doce 63: 7-15.
Nascimento EA, Morais SAL, Bezzan LCF, Chang R 2003a. Análise do resíduo insolúvel de uma própolis marrom do Triangulo Mineiro. Cie & Eng 37: 84-87. Nascimento EA, Bezzan LCF, Chang R, Morais SAL, Vallejo
MCG 2003b. Comparação entre os constituintes da própolis e da resina de eucalipto provenientes do cerrado. Cie & Eng 12: 15-18.
Nascimento EA, Chang R, Morais SAL, Piló-Veloso D, Reis DC 2008. Um marcador químico de fácil detecção para a própolis de alecrim-do-campo (Baccharis dracunculifolia). Rev Bras Farmacogn 18: 379-383. Negri G, Salatino MLF, Salatino A 2003. Green propolis:
unreported constituents and a novel compound from chloroform extracts. J Apic Res42: 39-41.
Neto FRA, Pereira, AS, Nascimento EA 2002. Lupeol alkanoates in Brazilian Propolis. Z Naturforsch 57c: 721-726.
Niraldo P, Teixeira C, Martins R, Scremin A, Dirsch VM, Vollmar AM, Abreu SRL, Solange SL, Marcucci MC 2006. Evaluation of the analgesic and anti-infl ammatory effects of a Brazilian green propolis. Planta Med 72: 899-906.
Park YK, Ikegaki M, Alencar SM, Moura FF 2000. Evaluation of Brazilian propolis by both physicochemical methods and biological activity. Honeybee Sci 21: 85-90.
Park YK, Paredes-Guzmán J, Aguiar CL, Fujiwara F 2003. Estudo das própolis que contém Artepillin C. Mensagem Doce 74: 9-16.
Park YK, Paredez-Guzman JF, Aguiar CL, Alencar SM, Fujiwara FY 2004. Chemical constituents in Baccharis dracunculifolia as the main botanical origin of southeastern Brazilian propolis. J Agr Food Chem 52: 1100-1103.
Park YK, Fukuda I, Ashida H, Nishiumi S, Yoshida KI, Daugsch A, Sato HH, Pastore GMJ 2005. Suppressive effects of ethanol extracts from propolis and its main botanical origin on dioxin toxicity. J Agr Food Chem 53: 10306-10309.
de pesquisa e suas perspectivas futuras. Quim Nova 25: 321-326.
Pietta PG, Gardana C, Pietta AM 2002. Analytical methods for quality control of propolis. Fitoterapia 73 (Suppl 1): S7-S20.
Rohwedder D, Havsteen HB 1987. Propolis. Taschenbuch Verlags GmbH, Berlin.
Sawaya ACHF, Tomazela DM, Cunha IBS, Bankova VS, Marcucci MC, Custódio AR, Eberlin MN 2004. Electrospray ionization mass spectrometry fi ngerprinting of propolis. Analyst129: 739-744. Simões CC, Araújo DB, Araújo RPC 2008. Estudo in vitro e ex
vivo da ação de diferentes concentrações de extratos de própolis frente aos microrganismos presentes na saliva de humanos. Rev Bras Farmacogn 18: 84-89. Soares AKA, Carmo GC, Quental DP, Nascimento DF, Bezerra
FAF, Moraes MO, Moraes MEA 2006. Avaliação da segurança clínica de um fi toterápico contendo Mikania glomerata, Grindelia robusta, Copaifera officinalis, Myroxylon toluifera, Nasturtium offi cinale, própolis e mel em voluntários saudáveis. Rev Bras Farmacogn 16: 447-454.
Sousa JPB, Furtado NAJC, Jorge R, Soares AEE, Bastos JK 2007. Perfi s físico-químico e cromatográfi co de amostras de própolis produzidas nas microrregiões de Franca (SP) e Passos (MG), Brasil. Rev Bras Farmacogn 17: 85-93.
Tavares JP, Martins IL, Vieira AS, Lima FAV, Bezerra FAF, Moraes MO, Moraes MEA 2006. Estudo de toxicologia clínica de um fi toterápico a base de associações de plantas, mel e própolis. Rev Bras Farmacogn 16: 350-356.
Valcic S, Montenegro G, Mujica AM, Avila G, Franzblau S, Singh MP, Maiese WM, Timmermann BN,1999. Phytochemical, morphological, and biological investigations of propolis from Central Chile. Z Naturforsch 54c: 406-416.