Vol. 6, No. 1, 2002 Photoacoustic and Transmission Studies of SiC Polytypes 47
Materials Research, Vol. 6, No. 1, 47-49, 2002. © 2002
*e-mail: [email protected]
Photoacoustic and Transmission Studies of SiC Polytypes
A.C. de Oliveiraa*, J.A. Freitas Jr.b, W.J. Mooreb, A. Ferreira da Silvac, I. Pepec, J. Souza de Almeidac,e, G.C.B. Bragad, J.M. Osório-Guillene, C. Perssone, R. Ahujae
aInstituto de Física, Universidade de Brasília, 70919-970 Brasília - DF, Brazil
bNaval Research Laboratory, Washington, D.C. 20375, USA
cInstituto de Física, Universidade Federal da Bahia, 40210-340 Salvador - BA, Brazil
dCorpo de Bombeiros Militar do Distrito Federal, Brasília - DF, Brazil
eDepartment of Physics, Uppsala University, SE-75121, Uppsala, Sweden
Received: January 02, 2002; Revised: September 30, 2002
The optical bandgap energies (OBGE) of 3C, 15R, 6H and 4H-SiC have been investigate experimentally by transmission and photoacoustic spectroscopies. The measurements were per-formed on 470 µm thick wafers. The OBGE obtained from both spectroscopies for different polytypes show very good agreement. In order to have a better understanding of these materials calculations of eletronic band structure were performed by the full-potential linearized augmented plane wave (FPLAPW) method. For the OBGE the results are compared to the measurements agreeing closely over the energies of those polytypes.
Keywords: SiC Polytypes, optical bandgap energies, plane wave method
1. Introduction
In the past decade techniques have been developed for the fabrication of bulk and epitaxial films of various SiC polytypes1. These developments have revived the
possibil-ity of SiC system applications in high temperature, high power, and high-speed electronics devices2,3. In this work
we will discuss the use of photoacustic spectroscopy, a contactless thermal technique, as well as the transmission, to monitor the optical properties of the 3C-SiC, 4H-SiC, 6H-SiC and 15R-SiC polytypes.
Photothermal spectroscopy has achieved great develop-ments in the last two decades, and it has been successfully applied to semiconductors samples in case of powders, non-polished samples, crystalline, polycrystalline or amorphous thin films, multilayered structure, etc. One of the principal advantage of photoacoustic spectroscopy over other optical measurements, e.g. optical absorption, is that produce similar spectra, and may provide direct information of the nonradiative recombination process and, consequently, com-pliments the absorption and the photoluminescence spectroscopy. In the present work we will investigate the bandgap energies both experimentally and theoretically.
Theoretically by the full potential linearized augmented plane wave (FPLAPW) method.
2. Experimental Technique
Photoacoustic spectroscopy (PAS) is directly related to the periodic heat generated in a sample due to the absorp-tion of modulated light. Generally the PAS experimental set up consists of a sample enclosed in a sealed cell at at-mospheric pressure coupled to a sensitive microphone. Therefore the temperature of the encapsulated gas is modu-lated at the excitation frequency and the microphone de-tects the resulting dynamic pressure. The signal generated by this process depends on the amount of heat generated in the sample due to its optical absorption coefficient, the non-radioactive processes efficiency, and the thermal diffusiv-ity. The study of the dependence of the sample absorption coefficient on the light source wavelength allows one to determine optical and electronic properties of opaque and transparent materials4.
48 Oliveira et al. Materials Research
with uv-quartz windows. The space between the walls was filled with air at atmospheric pressure. The internal cell cavity was gold plated in order to minimize unwanted ra-diation absorption. Air was used as coupling media between the sample and the microphone. A 1/2-inch condenser mi-crophone (Bruel and Kjær, model 3547) was used to moni-tor the change in the pressure inside the cell. A 150 Watts Xe lamp, with a ellipsoidal reflector, couple to a 0.22 m double monocromator (Spex model 1680) was used as vari-able wavelength light source. The light was chopped at a frequency of 5 Hz, to improve the signal/noise ratio. The system was computer controlled. The schematic of the ex-perimental setup is shown in Fig. 1. All the PAS spectra of the samples were normalized to the spectra of a highly ab-sorbing film. PAS has been used to measure the bandgap energy of the polytypes.
The transmission measurements were performed placing the sample, attached to a holder with a 1 mm × 2 mm aper-ture, in front of the exit slit of the variable wavelength light source used in the photoacustic experiments. The intensity of the transmitted light was monitored with a Si-photodiode. All the sample transmission spectra were normalized to the spectra of the light transmitted through the sample holder without the sample. The transmission experiment was car-ried out in the same set of sample studied by PAS.
3. Computation Method
The computational method, for the calculation of the bandgap, full potential linearized augmented plane wave (FPLAPW) method within the density-functional theory and local-density approximation (LDA) and using the correla-tion potential of Perdew and Wang (PW) 5. The LDA is known
to underestimate the bandgap energy Eg for semiconductors6.
Because of the incorrect bandgap, one cannot guarantee that the calculations yield an accurate dielectric function. However, it has been shown by Del Sole and Girlanda7 that
the LDA combined with the scissors-operator approxima-tion describes the optical spectrum rather well. We have therefore made an estimate of the correction ∆g to the
bandgap by using a quasi-particle method proposed by Bechstedt and Del Solo8. Their model for the correction is
based on the difference in self-energies obtained from the LDA and the W approximation. The correction is given by6,8
Figure 1. Schematic Experimental Setup.
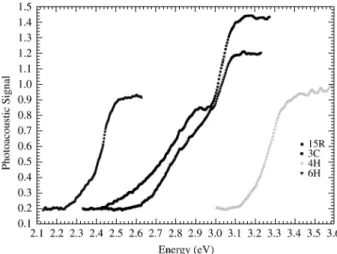
Figure 2. Photoacoustic signals as a function of energy for SiC polytypes. ) 1 1 1 1 ) 0 ( 2 2 0 2 2 + + − − =
∆
∫
∞ α απε t (( )f(q A ) ( )f(q A ) dt q
e r t
p t
r p
g TF TF
TF 7 . 1 4 ; ) 1 ( 3 / 10 1 )
( 2 6
4 2 ⋅ = = + + − = π a r r x x x x
f A B
In the equation above qTF is the Thomas-Fermi wave number, ε(0) is the static dielectric function, αp the polarity of the interatomic interaction8 calculated to be 7.67, and a
is the lattice constant for each of the polytypes5.
We have employed experimental values for the lattice dielectric function. For 3C-(6H-) SiC ε(0) = 9.72 (9.78). The dielectric constant for 6H-SiC are the geometric average values of the transverse and longitudinal components:
ε(0)⊥ = 9.66 and ε(0)||= 10.03,
3 ) 0 ( ) 0 ( 2 ) 0
( = ε +ε ||
ε ⊥
Furthermore, 4H-SiC and 15R-SiC are presumed to have the same lattice dielectric function as 6H-SiC.
4. Experimental Results
In Figs. 2 and 3, we show the room temperature photoacoustic and transmission spectra respectively. The optical bandgap energies derived from these results are shown (1a)
Vol. 6, No. 1, 2002 Photoacoustic and Transmission Studies of SiC Polytypes 49
Figure 3. Transmission signal as a function of energy for SiC polytypes.
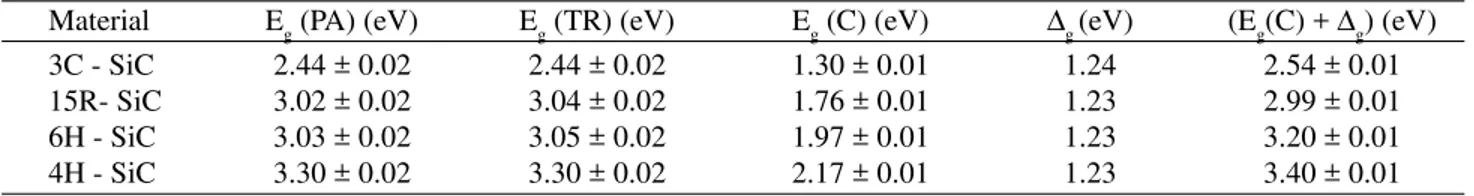
Table 1. Obtained values of the bandgap energies for Photoacoustic (PA) and Transmission (TR) measurements. The calculated Eg (C) and quasi-particle correction ∆g are shown.
Material Eg (PA) (eV) Eg (TR) (eV) Eg (C) (eV) ∆g (eV) (Eg(C) + ∆g) (eV)
3C - SiC 2.44 ± 0.02 2.44 ± 0.02 1.30 ± 0.01 1.24 2.54 ± 0.01
15R- SiC 3.02 ± 0.02 3.04 ± 0.02 1.76 ± 0.01 1.23 2.99 ± 0.01
6H - SiC 3.03 ± 0.02 3.05 ± 0.02 1.97 ± 0.01 1.23 3.20 ± 0.01
4H - SiC 3.30 ± 0.02 3.30 ± 0.02 2.17 ± 0.01 1.23 3.40 ± 0.01
in Table 1 together with the calculated values. The results are compared to the measurements agreeing closely over the en-ergies of those polytypes. They are also shown in Fig. 4.
5. Conclusion
We have measured the optical bandgap energies of 3C-, 4H-, 6H- and 15R-SiC, using photoacoustic and trans-mission spectroscopies. The results are in good agreement with our full-potential calculations.
Acknowledgements
This work was financially supported by the Brazilian agencies CNPq and FAP-DF, Swedish agencies TFR, NFR and SSF, and work at the Naval Research Laboratory by the Office of Naval Research.
Reference
1. Davis, R.F. Proc. of 5th. SiC and Related Materials Conf., Washington (1993), Inst. Phys. Conf. Ser., v. 137 p. 1, 1994.
2. Morelli, D.; Heremans, J.; Beetz, C.; Woo, W.S.; Harris, G.; Taylor, C. Proc. of 5th. SiC and Related Materials Conf., Washington (1993), Inst. Phys. Conf. Ser., v. 137, p. 313, 1994.
3. Mokoç, H.; Strite, S.; Gao, G.B.; Lin, M.E.; Sverdlov, B.; Burns, M. J. Appl. Phys., v. 76, p. 1363, 1994. 4. Silva, L.A.; de Andrade, J.B.; Moysés, Araújo, C.;
Nakamura, D.; da Silva, A.F.; Massunaga, M.S.O.; Vargas, H.; Phys. Chem. Chem. Phys., v. 3, p. 4800, 2001. 5. Persson, C.; Lindefelt, U. Phys. Rev. B, v. 54, p. 10257,
1996; J. Appl. Phys., v. 82, p. 5496, 1997.
6. Persson, C.; da Silva, A.F.; Ahuya, R.; Johansson, B. J. Cryst. Growth, v. 235, p. 397, 2001; J. Phys.: Condens. Matter, v. 13, p. 8945, 2001.
7. Del Sole, R.; Girlanda, R. Phys Rev B, v.48, p. 11789, 1993. 8. Bechstedt, F.; Del Sole, R. Phys. Rev B, v. 38, p. 7710, 1998.