ISSN 0104-6632 Printed in Brazil
www.abeq.org.br/bjche
Vol. 31, No. 03, pp. 815 - 820, July - September, 2014 dx.doi.org/10.1590/0104-6632.20140313s00002623
Brazilian Journal
of Chemical
Engineering
MEASUREMENT AND CORRELATION OF
ISOBARIC VAPOR-LIQUID EQUILIBRIUM FOR
THE BINARY SYSTEM OF CYCLOPENTANE
AND TETRAHYDROFURAN
Yumei Li
1,21Department of Chemistry, Dezhou University, Dezhou 253023, PR China. 2
Key Laboratory of Coordination Chemistry and Functional Materials in Universities of Shandong, (Dezhou University), Dezhou 253023, PR China.
E-mail: [email protected]
(Submitted: March 21, 2013 ; Revised: June 25, 2013 ; Accepted: July 31, 2013)
Abstract - Isobaric vapor-liquid equilibrium (VLE) data for the cyclopentane and tetrahydrofuran (THF) system were measured at 101.3 kPa by using an equilibrium still. Thermodynamic consistency of the experimental data was confirmed by means of the Herington method. The experimental data were correlated and calculated by the Margules, Van Laar and Wilson activity-coefficient models, respectively. The Wilson and Van Laar activity-coefficient models are better than the Margules activity-coefficient model based on the average absolute deviations of temperature and the vapor-phase composition. For the Wilson and Van Laar activity-coefficient models the average absolute deviations between the experimental and the calculated values were 0.24 K and 0.23 K for the boiling point, and 0.0040 for vapor-phase composition, respectively. These agree well with the experimental data. Therefore, it was shown that the Wilson and Van Laar activity-coefficient models satisfactorily correlate the experimental results of the cyclopentane and tetrahydrofuran system.
Keywords: Cyclopentane; Tetrahydrofuran; Vapor-liquid equilibrium.
INTRODUCTION
In industrial production processes, solvent recovery is one of the problems that needs to be solved urgently due to environmental protection and production costs (Slater et al., 2012). Currently, dis-tillation is extensively used for the separation of a great number of liquid mixtures and clearly domi-nates separation processes, accounting for more applications than all of the other solvent separation processes such as extraction, adsorption, filtration and membrane technologies (Humphrey, 1995; Ramzan
et al., 2008; Mohsen-Nia and Memarzadeh, 2010). For the correct design of separation processes, it is essential to obtain accurate and quantitative
informa-tion on the phase equilibrium of binary or multicom-ponent mixtures (Aucejo et al., 2006; Ovejero et al., 2007).
with the Margules (Margules, 1895), Van Laar (Van Laar, 1910) and Wilson (Wilson, 1964) activity-coefficient models.
MATERIALS AND METHODS
Materials
Chemicals used: all the reagents were analytical pu-rity grade. Cyclopentane was purchased from Tianjin University Ke Wei Company and tetrahydrofuran was purchased from Tianjin Chemical Reagent Third Plant. The purity of the chemicals was checked by gas chromatography (>0.997 mass %), so no further purification was needed. The water content in the chemicals was determined using a Karl-Fischer titration method (<0.03 mass %). The purity of the chemicals was further confirmed by comparing the experimental densities, the refractive indexes and the normal boiling points with those reported (Ma, 2005; Cheng, 2007), as listed in Table 1. The accuracies in
density, and refractive index measurements are ±2.0×10⁻⁵ g/cm3 and ±0.00001, respectively.
Apparatus and Procedure
An equilibrium still, the same as in the previous work (Li and Bai, 2012; Li et al., 2013), was em-ployed to measure isobaric VLE data at 101.3 kPa and is shown in Figure 1. The temperature was con-trolled by a small voltage adjuster. A mercury ther-mometer calibrated by Shanghai Metrology Institution was used for temperature measurement within an ac-curacy of ±0.01 °C.
The temperature uncertainties in this work, com-bining both the errors from calibration and re-peatability of the measurements, are not higher than ±0.06 K. The actual atmospheric pressure was meas-ured by a mercury barometer with an accuracy of ±0.1 kPa. Since the atmospheric pressure changed slightly during the experiments, the boiling tempera-tures at the actual pressure were corrected to 101.3 kPa according to the literature (Hiaki and Kawai, 1999).
Table 1: Densityρ, normal boiling point Tb, and refractive index nDof the pure components
ρ (293.15K)/(g cm⋅ −3) Tb(101.3KPa)/°C nD(293.15K)
Component
Experimental Literaturea Experimental Literatureb Experimental Literaturea
Cyclopentane 0.74497 0.74536 49.15 49.26 1.40613 1.40645
tetrahydrofuran 0.88975 0.8892 66.47 67 1.40706 1.4073
a
Taken from Ref. (Cheng, 2007). b
Taken from Ref. (Ma, 2005).
1. Heating mantle 2. Boiling chamber 3. Thermometer
4. Liquid phase sampling port/Liquid mixture input
5. Equilibrium chamber 6. Condenser
7. Vapor phase sampling port 8. Equilibrium tube
9. Mixing chamber.
Measurement and Correlation of Isobaric Vapor-Liquid Equilibrium for the Binary System of Cyclopentane and Tetrahydrofuran 817
The analytical work was carried out using a gas chromatograph (SP-6890) equipped with a thermal conductivity detector (TCD) connected to a data acquisition system. The TCD was repeatedly cali-brated by introducing known amounts of each pure compound through a syringe into the injector of the gas chromatograph. Taking into account the uncer-tainties due to calibrations and dispersions of the analyses (at least five for each sample), the resulting uncertainties in vapor and liquid mole fractions are estimated to be 0.0001 in mole fraction.
The still was operated at constant pressure until equilibrium was reached. When constant temperature and pressure were obtained for 30 min or longer, it was assumed that the vapor and liquid phases had achieved balance. To verify the equilibrium condi-tions, we analyzed the vapor until the variation of the mole fraction of the vapor phase composition was less than 0.0001. Then, samples of liquid and con-densate were taken for analysis.
Verification of the Apparatus
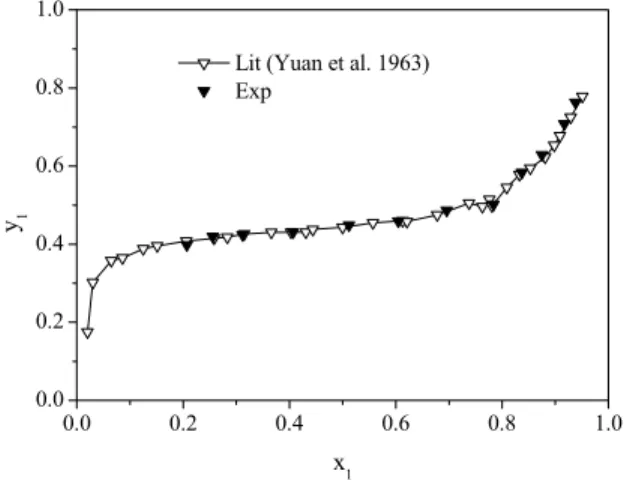
In order to verify the reliability of the device, the atmospheric VLE data of the cyclohexane + ethanol binary system were measured by this device and compared with literature data (Yuan et al., 1963) as shown in Figure 2. As can be seen from Figure 2, the measured VLE data were in good agreement with the literature data, so the device can be used to measure the VLE of the binary system cyclopentane and tetrahydrofuran at 101.3 kPa.
0.0 0.2 0.4 0.6 0.8 1.0 0.0
0.2 0.4 0.6 0.8 1.0
y1
x1 Lit (Yuan et al. 1963) Exp
Figure 2: Isobaric VLE diagram for the binary system of ethanol(1) + cyclohexane(2) at 101.3 kPa.
RESULTS AND DISCUSSION
Experimental Data
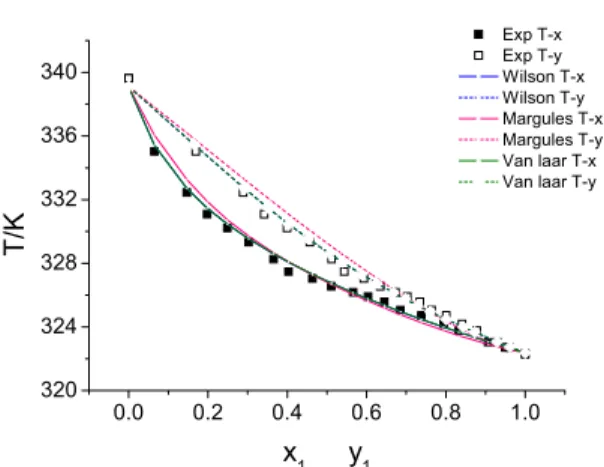
Table 2 shows the values of the quantities that characterize the equilibrium states of the liquid and vapor phases, xi, yi and T at a pressure of p= 101.3 kPa. The corresponding phase diagram is shown in Figure 3 and Figure 4. As can be seen from Figure 3, there is no intercrossing point between the bubble point curve and the dew point curve over the entire composition range, which reveals that no azeotrope exists in the cyclopentane + THF binary system.
Table 2: VLE data and correlation results for the cyclopentane+THF system at 101.3 kPa.
Margules Van Laar Wilson
1
x y1 T K/
T
Δ Δy ΔT Δy ΔT Δy
1 1 322.30 0.07 0 0.07 0 0.07 0
0.9493 0.9598 322.71 0.08 0.0014 0.04 0.0017 0.04 0.0017
0.9065 0.9296 323.05 0.25 0.0043 0.08 0.0007 0.08 0.0007
0.8325 0.8776 323.78 0.33 0.0061 0.11 0.0051 0.11 0.0051
0.7944 0.8408 324.19 0.42 0.0041 0.20 0.0027 0.21 0.0026
0.7382 0.8008 324.73 0.46 0.0056 0.25 0.0003 0.26 0.0004
0.6858 0.7638 325.06 0.29 0.0070 0.10 0.0035 0.11 0.0035
0.6446 0.7344 325.58 0.39 0.0085 0.22 0.0058 0.23 0.0058
0.6036 0.7025 325.91 0.29 0.0122 0.15 0.0055 0.15 0.0055
0.5659 0.6727 326.18 0.15 0.0158 0.03 0.0050 0.03 0.0049
0.5113 0.6347 326.55 0.12 0.0147 0.20 0.0097 0.20 0.0095
0.4635 0.5932 327.04 0.23 0.0205 0.27 0.0060 0.27 0.0058
0.4033 0.5439 327.48 0.61 0.0220 0.60 0.0054 0.59 0.0051
0.3653 0.5119 328.26 0.40 0.0221 0.34 0.0049 0.33 0.0046
0.3024 0.4571 329.32 0.39 0.0192 0.22 0.0044 0.22 0.0041
0.2492 0.3996 330.21 0.52 0.0220 0.24 0.0040 0.24 0.0042
0.1979 0.3419 331.08 0.81 0.0199 0.39 0.0097 0.40 0.0097
0.1469 0.2888 332.45 0.80 0.0041 0.24 0.0036 0.25 0.0036
0.0652 0.1697 335.02 1.03 0.0163 0.40 0.0029 0.40 0.0031
0 0 339.62 0.51 0 0.51 0 0.51 0
a exp cal
y y y
Δ = − . b exp cal
T T T
0.0 0.2 0.4 0.6 0.8 1.0 320
324 328 332 336 340
T/K
x1 y1
Exp T-x Exp T-y Wilson T-x Wilson T-y Margules T-x Margules T-y Van laar T-x Van laar T-y
0.0 0.2 0.4 0.6 0.8 1.0 0.0
0.2 0.4 0.6 0.8 1.0
y 1
x1
Exp Wilson Margules Van laar
Figure 3: Vapor-liquid equilibrium phase diagram for the cyclopentane+THF system at 101.3 kPa
Figure 4: y−x diagram for the cyclopentane+THF system at 101.3 kPa.
Thermodynamic Consistency Verification
Thermodynamic consistency of the experimental results was checked by means of two tests: (1) the point-to-point van Ness method (Van Ness et al., 1973) and (2) the Herington method (Herington, 1951).
The thermodynamic consistency of the experi-mental results was checked using the van Ness method, described by Fredenslund et al. (1977) using a third-order Legendre polynomial for the excess free energies. According to this test, experimental data are considered to be consistent if the average deviation in y (Δy) is smaller than 0.01. All the experimental data are consistent, as one can see in Table 3.
Table 3: Results of the thermodynamic consis-tency test. Average deviations of ΔPand Δy.
System Δya ΔPb (KPa)
cyclopentane+ THF 0.0063 0.43
a
Mean absolute deviation in the vapor phase composition. b
Mean absolute deviation in pressure.
Experimental errors may cause deviations of the activity coefficients obtained from the experimental VLE data via the Gibbs-Duhem equation (Smith et al., 2001). Therefore, the Herington method was used to check the thermodynamic consistency.
100
I D= ×
∑ , J 150 Tmin
θ
= ×
where 1
1 2 1 0ln( / )
I =
∫
γ γ dx , , 11 2 1 0ln( / )dx
∑ =
∫
γ γ .max min
T T
θ = − , Tmax and Tminwere the highest and the lowest boiling point in the system, respectively, in K. According to the Herington method, the experimental data are consistent if Herington’s (D−J) was less than 10. The calculation result was
that D−J =4.81 10< , which indicated that all experimental data were in accordance with thermodynamic consistency.
Correlation of the Binary Vapor-Liquid Equilib-rium
The activity coefficients were calculated from the equation
i i
i s s i i i
y p
x p
φ γ =
φ (1)
At low pressure, the assumption of ideal behavior is adopted for the vapor (Chen, et al. 1993). The fugacity coefficients φi and φis are equal to unity. Therefore, Eq. (1) can be simplified to
s i i i i
py =p γ x (2)
where γi is the activity coefficient of component i.
Measurement and Correlation of Isobaric Vapor-Liquid Equilibrium for the Binary System of Cyclopentane and Tetrahydrofuran 819
log ( )
( )
sat i
B p kPa A
T K C
= −
+ (3)
where A, B, and C are Antoine constants and T is the temperature in Kelvin. The Antoine constants for cyclopentane and THF were obtained from the literature (Ma, 2005), and are presented in Table 4.
Table 4: Basic properties of pure substances.
Antoine constants Component
A B C
Temperature range/T
THF 6.12023 1202.394 -46.883 296-373
cyclopentane 6.06783 1152.57 -38.64 236-348
Because the experiment was carried out at 101.3 kPa, the vapor phase could be regarded as an ideal gas, and the boiling point difference between cyclopentane and THF was not more than 30 K, so the parameters of the activity-coefficient models could be regarded as constant values. In order to find parameters of the equations, the activity coefficients were correlated with the Margules, Van Laar and Wilson equations. Estimation of the parameters of the equations was based on minimization of the following objective function (OF):
exp 2 (ln ical ln i )k k i
OF=
∑∑
γ − γ (4)where k is the number of data points and i the number of components in the mixture. The experimental and calculated values are denoted by the superscripts ‘exp ’ and ‘cal’, respectively. γiexp
is calculated with Equation (1) and γical is calculated with the Margules, Van Laar and Wilson equations. The parameters of the activity-coefficient models obtained through a simplex search are shown in Table 4. These were then used to calculate y1cal and
cal
t under the corresponding liquid compositions and pressure (101.3 kPa). The temperatures and vapor-phase compositions obtained from the theoretical calculations using the three activity-coefficient models were compared with the experimental data. The comparative results are shown in Table 2. The average absolute deviations of temperature and the vapor-phase compositions between the experimental and the calculated values obtained from the Margules, Van Laar and Wilson models, together
with the correlated interaction parameters, are shown in Table 5.
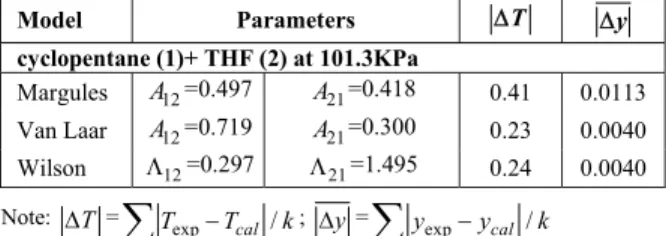
It can be seen from Table 5 that the average absolute deviations between the experimental and the calculated values using the Wilson and Van Laar activity-coefficient models were 0.24 K and 0.23 K for the boiling point and 0.0040 for vapor-phase composition, respectively. However, by the Margules activity-coefficient models the average absolute deviations of temperature and the vapor-phase com-positions were 0.41 and 0.0113. When these results are compared, it can be seen that the Wilson and Van Laar activity-coefficient model is better than the Margules activity-coefficient model based on the average absolute deviations of Δy and ΔT .
Table 5: Margules, Van Laar, Wilson and NRTL parameters and mean deviations for the binary system.
Model Parameters ΔT Δy
cyclopentane (1)+ THF (2) at 101.3KPa
Margules A12=0.497 A21=0.418 0.41 0.0113
Van Laar A12=0.719 A21=0.300 0.23 0.0040
Wilson Λ12=0.297 Λ21=1.495 0.24 0.0040
Note: ΔT =
exp cal /
T −T k
∑
; Δy=exp cal /
y −y k
∑
k: number of data pointsCONCLUSIONS
REFERENCES
Aucejo, A., Loras, S., Martinez-Soria, V., Isobaric vapor-liquid equilibria for the binary mixtures of styrene with ethylbenzene, o-xylene, m-xylene, and p-xylene. Journal of Chemical & Engineering Data, 51, 1051-1055 (2006).
Chen, Z. X., Gu, F. Y., Hu, W. M., Chemical Ther-modynamics Program. Chemical Industry Press, Beijing, (1993).
Cheng, N. L., Solvent Handbook. Chemical Industry Publishing House, Beijing, (2007).
Fredenslund, A., Gmehling, J., Rasmussen, P., Vapor Liquid Equilibria Using UNIFAC: A group-Con-tribution Method. Elsevier, Amsterdam, 68-73 (1977).
Herington, E. F. G., Tests for the consistency of experimental isobaric vapor-liquid equilibrium data. Journal of Institute of Petroleum., 37, 457-470(1951).
Hiaki, T., Kawai, A., Vapor-liquid equilibria deter-mination for a hydrofluoroether with several alco-hols. Fluid Phase Equilibria, 158, 979-989 (1999). Humphrey, J. L., Separation processes: Playing a
critical role. Chemical Engineering Progress, 91, 31-41 (1995).
Li, Y. M., Bai, P., Isobaric vapour-liquid equilibrium for binary system of trifluoroacetic acid and acetone. Asian Journal Chemistry, 24, 1861-1863 (2012).
Li, Y. M., Bai, P., Zhuang, Q. H., Isobaric vapor– liquid equilibrium for binary system of methanol and acetonitrile. Fluid Phase Equilibria, 340, 42-45 (2013).
Ma, P. S., Chemical Engineering Thermodynamics. Chemical Industry Publishing House, Beijing (2005).
Margules, M. S., Akad. B. Wien., Math-Naturwiss. KI. II, 104, 1234-1239 (1895).
Mohsen-Nia, M., Memarzadeh, M. R., Isobaric vapor- liquid equilibria of heptane+ 1-butanol and heptane+ 1-pentanol systems at (53.3 and 91.3) kPa. Journal of Chemical & Engineering Data, 55, 2140-2144 (2010).
Ovejero, G., Romero, M. D., Díez, E., Lopes, T., Díaz, I., Isobaric vapor-liquid equilibrium for the binary systems pentanol+cyclohexane and 1-pentanol+n-hexane at low alcohol compositions. Journal of Chemical & Engineering Data, 52, 1984-1987 (2007).
Ramzan, N., Degenkolbe, S., Witt, W., Evaluating and improving environmental performance of HC's recovery system: A case study of distillation unit. Chemical Engineering Journal, 140, 201-213 (2008).
Slater, C. S., Savelski, M. J., Moroz, T. M., Raymond, M. J., Pervaporation as a green drying process for tetrahydrofuran recovery in pharma-ceutical synthesis. Green Chemistry Letters and Reviews, 5, 55-64 (2012).
Smith, J. M., Van, N. H. C., Abbott, M. M., Intro-duction to Chemical Engineering Thermody-namics. 6th Ed. McGraw-Hill, New York (2001). Van Laar, J. J., The vapor pressure of binary mix-tures. Zeitschrift Fur Physikalische Chemie-International Journal of Research in Physical Chemistry & Chemical Physics, 72, 723-751 (1910). Van Ness, H. C., Byer, S. M., Gibbs, R. E., Vapor-liquid equilibrium: Part I. An appraisal of data reduction methods. AIChE Journal, 19, 238-244 (1973).
Wilson, G. M., Vapor -liquid equilibrium. XI. A new expression for the excess free energy of mixing. Journal of the American Chemical Society, 86, 127-130 (1964).