ISSN 0104-6632 Printed in Brazil
www.abeq.org.br/bjche
Vol. 26, No. 02, pp. 299 - 306, April - June, 2009
*To whom correspondence should be addressed
Brazilian Journal
of Chemical
Engineering
COMPARATIVE STUDY OF HYDRODYNAMIC
BEHAVIOR OF LIQUID EXPANDED BED
ADSORPTION: MATHEMATICAL AND
SHORT-CUT METHODS
M. Jahanshahi
1*, A. A. Ghoreishi
1, E. Vasheghani-F
2, M. Khavarpour
3and A. Abedijaber
41Nanobiotechnology Research Lab., Faculty of Chemical Engineering,
Phone/Fax: +98(0)111-3234204, Babol University of Technology, Iran. E-mail: [email protected], [email protected]
2Department of Chemical Engineering, Faculty of Engineering, Tarbiat Modarres University, Tehran, Iran. 3Islamic Azad University, Department of Chemical Engineering, Ayatollah Amoli Branch, Iran. 4Department of Chemical & Biomolecular Engineering, University of Tennessee, Knoxville, USA.
(Submitted: December 18, 2007 ; Revised: June 30, 2008 ; Accepted: August 13, 2008)
Abstract - Liquid fluidized/expanded bed adsorption (LF/EBA) is a novel chromatography technique for capturing target biomolecules directly from crude feedstock in downstream processing. To widely extend the LF/EBA technology in biological industries, a better understanding of the expanded-bed behavior is necessary to maximize its efficient applications. In this study, streamline adsorbent was loaded into the column and the bed was subjected to physical and hydrodynamical experiments. Hydrodynamic characteristics of the bed
(e.g., Daxl and Bo) with different settled bed height (SBH=5,6,7,8,9,10,11,12cm) along with a variety of
column diameters (1,1.6,2.5 cm) have been investigated based on exact mathematical as well as approximate short-cut methods. It was found that the increasing column diameter promoted bed mixing, which was undesirable, and the optimal values for the bed expansion and SBH based on minimal liquid mixing were 80%-130% and 8-10 cm, respectively. However, exploiting the short-cut method for the bed hydrodynamic assessments also demonstrated results as good as the mathematical method. Hydrodynamic behavior of liquid fluidized bed adsorption and the generic application of the short-cut method and its potential as a simple method for study of hydrodynamic performance is discussed.
Keywords: Fluidized bed adsorption; Bed mixing; Settled bed height; Bed expansion; Mathematical method; bioseparation.
INTRODUCTION
Generally, standard purification techniques for protein recovery involve the use of a packed bed column after broth clarification, concentration, and filtration steps. The requirement of several sequential operations prior to the initial capturing of proteins increases processing time and cost. The overall yield of purified proteins is also reduced. Therefore, a reduction in the number of purification steps is
beneficial for the biotechnology and pharmaceutical industries. Expanded-bed adsorption is a relatively new technique for the primary recovery of proteins starting from unclarified broths (Amersham, 1998., Jahanshahi et al, 2003., Jahanshahi et al,2004).
Clemmitt et al, 2002., Ferreira et al, 2000., Jahanshahi, 2004., Jahanshahi et al, 2005., Jahanshahi et al, 2006., Thommes et al, 1995., Ujam et al, 2003). This process combines clarification, concentration, and initial capturing in a single step. This technique offers the potential advantages of both higher packed bed and fluidized bed. The upward flow through the bed of adsorbents provides the higher void fraction within the bed, which allows the particulate materials to pass through whilst the target bioproduct is adsorbed onto the solid phase (Tong and Sun, 2002).
The hydrodynamic behavior of fluidized beds/expanded beds applied to chromatographic adsorption is different from that of conventional liquid-solid fluidized beds. From the conventional chemical engineering viewpoint, a fluidized bed is one in which there is a significant degree of mixing, in both the solid and fluid phases, e.g., in gas-fluidized systems (Levenspiel, 1972). In many applications, mixing of the solid phases is desirable, but the mixing in liquid fluidized systems is not as severe as in gas-fluidized systems. In a packed bed, the adsorbent beads are stationary and liquid flow through the bed approximates to plug flow. Thus, the number of theoretical equilibration stages (conventionally referred to as plates) is maximized, which results in good adsorption and chromatographic performance. It is highly desirable to minimize the degree of mixing in order to mimic the adsorption characteristics found in a packed bed contactor with respect to capacity and resolution (Jahanshahi et al, 2002., Thommes,1997). Therefore, in order to maximize the adsorption efficiency of EBA, it is necessary to investigate its hydrodynamic behavior properly.
The work herein presents comparative tests of physical and hydrodynamical performance of
LF/EBA. For the purpose of demonstration of the principle, the effect of column diameter, settled bed height and bed expansion are investigated by RTD mathematical method and compared with the result of a short-cut method.
EXPERIMENTAL Material
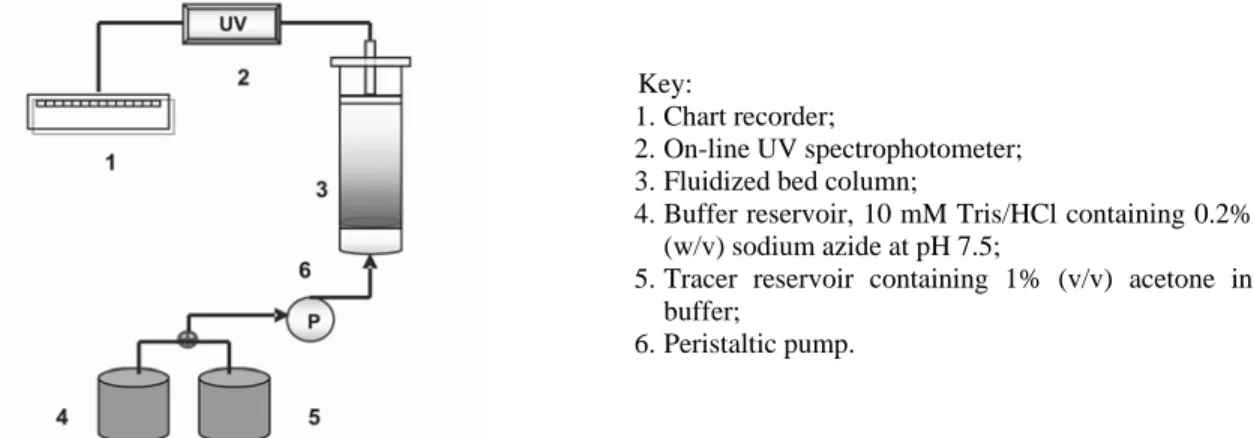
Streamline Quartz Base Matrix, adsorbent, was purchased from Amersham Biosciences. Streamline™ 40 columns of 1-cm i.d were also purchased from Amersham Biosciences. A dilute acetone solution (1% v/v) was used as the input tracer to the column. 10 mM Tris/HCl at pH 7.5 was used to expand the bed. Figure 1shows the expanded bed setup.
Measurement of the Hydrodynamic Performance
The bed expansion characteristics of the adsorbent were determined in an expanded bed operated with buffer A (10 mM Tris/HCl containing 0.2% (w/v) sodium azide at pH 7.5). The adsorbent was repeatedly washed prior to use with equilibration buffer A and filtered until pH and conductivity reached equilibration values. A given amount of adsorbent particles was transferred to the column (in an Amersham Bioscience contactor; 1 cm inner diameter) and allowed to sediment uniformly. Bed expansion of adsorbent was measured and recorded with increasing liquid superficial velocity through the inlet of the column. The superficial flow velocity was subsequently plotted against bed expansion defined as the percentage ratio of expanded and settled bed heights.
Key:
1.Chart recorder;
2.On-line UV spectrophotometer;
3.Fluidized bed column;
4.Buffer reservoir, 10 mM Tris/HCl containing 0.2%
(w/v) sodium azide at pH 7.5;
5.Tracer reservoir containing 1% (v/v) acetone in
buffer;
6.Peristaltic pump.
Comparative Study of Hydrodynamic Behavior of Liquid Expanded Bed Adsorption 301
Brazilian Journal of Chemical Engineering Vol. 26, No. 02, pp. 299 - 306, April - June, 2009
Residence Time Distribution (RTD) measurements were performed by using a negative step signal method (Amersham Bioscience, 1998, Levenspiel,1972). A bed of the adsorbent particles was fully expanded using buffer A at the test flow rate. A dilute acetone solution (1% v/v) was used as the input to the column in a system fluidised with buffer A. The UV absorbance of the acetone was measured spectrophotometrically at 280 nm in the exit stream from the column using a UV monitor.
Theory and Method
The relationship between liquid superficial velocity (U) and bed voidage (ε) in a fluidised bed can be described by the classical correlation first postulated by Richardson and Zaki (1954):
U = Utεn (1)
The Richardson – Zaki coefficient (n) can be calculated from correlations available in the literature. The model of Shiller and Naumann is commonly used for the prediction of terminal velocity of a spherical particle:
Ga = 18 Ret + 2.7 Ret1.687 3.6 < Ga < 105 (2)
where
3
p p
a 2
.( ).g.d
G =ρ ρ − ρ
μ (3)
and
p t t
.d .U
Re =ρ
μ (4)
The model of Shiller and Naumann has been successfully used to estimate the particle terminal velocity.
The Bodenstein number (Bo) and axial dispersion
coefficient (Daxl), which expresses the state of liquid
dispersion and fluidization behavior, can be calculated according to the following Eqs. (5), (6), (7) and (8).
2 2 0 2 0 0 2 1
2( ) .[1 exp(B )]
B B
t
δ = − − (5)
0 0
(1 ).H
1
H
− ε
ε = − (6)
2
2
t
N=
δ (7)
0 axl U.H B .D =
ε (8)
The axial dispersion in the liquid phase can also be interpreted in a form more familiar to researchers in chromatography based on the theoretical plate number (Pai et al, 2000). For small derivations from plug flow, the axial dispersion of the liquid phase can be expressed by Eq. (9) (Bilerau et al, 2001; Lan, 2000; Mullick and Flickinger, 1999).
axl
U.H D
2. .N
=
ε (9)
In this article, two methods for calculation of the mean residence time t and varianceσ are used. The first is a mathematical method (exact method), where t is called the centroid of the distribution and is an important parameter for RTD analysis. It is calculated as follows:
i i i
i i
tCdt
t C t t C t Cdt ∞ ° ∞ ° Δ = ≅ Δ
∫
∑
∑
∫
(10)where Ci is the concentration of tracer at time ti. Variance (σ2) is the next most important parameter of the RTD curve, which is given by:
2 2
2 2
(t t) Cdt t Cdt
t Cdt Cdt ∞ ∞ ° ° ∞ ∞ ° ° −
δ =
∫
=∫
−∫
∫
(11)
The second one is called the short-cut method (Figure 2). In this method, the time interval from switching the feed to the buffer until the signal reached 50% of the full deflection is taken as the mean residence time (t). The time interval of the signal between 84.15% and 15.85% yields the spread of the distribution (2σ).
Figure 2: UV signal recording during the test procedure for the determination of the theoretical number using the step-input method
Figure 3: Bed expansion of adsorbent operated at settled bed height of 10 cm as a function of linear flow velocity.
RESULT AND DISCUSSION
Bed Expansion Characteristics and Richardson-Zaki Parameters
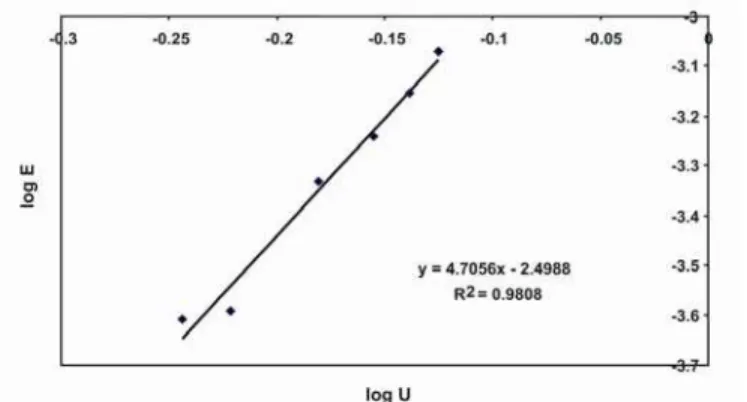
The bed expansion contributes to the adsorption efficiency as a composite function of liquid distribution, liquid properties (e.g., viscosity, density), particle characteristics and the configuration of the column in terms of wall and distributor effects (Thommes, 1997). In order to estimate the variation of the bed expansion as a function of flow velocity throughout the bed, the Richardson – Zaki equation was used .The experiments were performed in a clean system (buffer) and bed expansions are shown in Figure 3. The theoretical terminal velocity was derived from the Shiller and Naumann model.
The experimental values of terminal velocity can be determined by fitting to the Richardson – Zaki equation. The summary of bed expansion characteristics is presented in Table1.The experimental value of Richardson – Zaki coefficient determined here is close to the value of 4.8
commonly used in the laminar flow regime.
The expansion characteristics of adsorbent operated at a settled bed height of 10 cm was determined .The adsorbent was expanded in buffer A in an Amersham Bioscience contactor (1 cm inner diameter) with respect to increasing linear flow velocity.
Experimental values of U t and n were derived
from bed expansion profiles and settled bed voidage of 0.4 and these data were applied in all experiments.
The Effect of Different Settled Bed Height (SBH) on Hydrodynamic Behavior
Comparative Study of Hydrodynamic Behavior of Liquid Expanded Bed Adsorption 303
Brazilian Journal of Chemical Engineering Vol. 26, No. 02, pp. 299 - 306, April - June, 2009
Table 1: Experimental and theoretical values of expansion coefficient (n exp and n t respectively) and
terminal velocities (Ut exp and Ut t, respectively) for adsorbent
n exp n t Ut exp Utt
4.7056 4.7454 3.171×10 -3 3.2526×10 -3
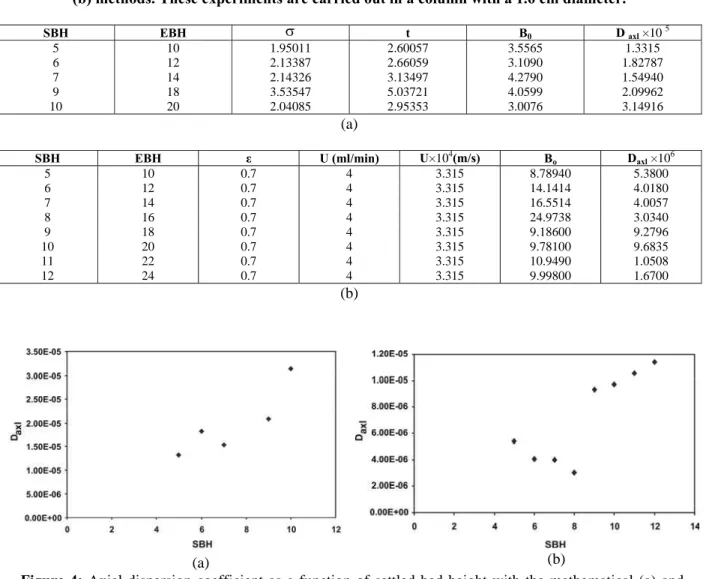
Table 2: B0 and Daxl for different settled bed heights obtaining with the exact (a) and approximation
(b) methods. These experiments are carried out in a column with a 1.6 cm diameter.
SBH EBH σ t B0 D axl ×10 5
5 10 1.95011 2.60057 3.5565 1.3315 6 12 2.13387 2.66059 3.1090 1.82787 7 14 2.14326 3.13497 4.2790 1.54940 9 18 3.53547 5.03721 4.0599 2.09962 10 20 2.04085 2.95353 3.0076 3.14916
(a)
SBH EBH ε U (ml/min) U×104(m/s) Bo Daxl ×106
5 10 0.7 4 3.315 8.78940 5.3800
6 12 0.7 4 3.315 14.1414 4.0180 7 14 0.7 4 3.315 16.5514 4.0057 8 16 0.7 4 3.315 24.9738 3.0340 9 18 0.7 4 3.315 9.18600 9.2796 10 20 0.7 4 3.315 9.78100 9.6835 11 22 0.7 4 3.315 10.9490 1.0508 12 24 0.7 4 3.315 9.99800 1.6700
(b)
(a) (b)
Figure 4: Axial dispersion coefficient as a function of settled bed height with the mathematical (a) and short-cut (b) methods. Axial dispersion measurements were performed using a negative step signal method. Dilute acetone (1% (v/v) in buffer A was used as the input to the contactor and the UV absorbance of the bed effluent was monitored, quantified and recorded. These experiments were carried out in a column with a 1.6 cm diameter.
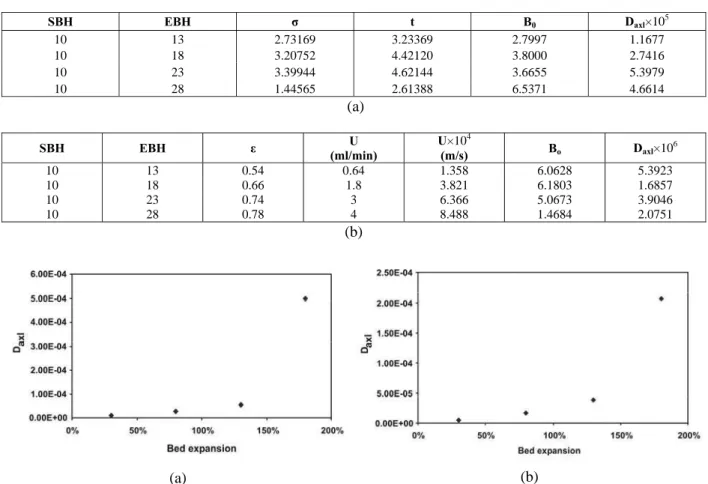
The Effect of Bed Expansion on Hydrodynamic Behavior
The effect of different bed expansions (30%, 80%, 130%, 180%) was investigated by both methods to obtain the optimum bed expansion for an
Table 3: B0 and Daxl for different bed expansions obtained by the exact (a) and approximation
(b) methods. These experiments were carried out in column with a 1 cm diameter.
SBH EBH σ t B0 Daxl×105
10 13 2.73169 3.23369 2.7997 1.1677 10 18 3.20752 4.42120 3.8000 2.7416 10 23 3.39944 4.62144 3.6655 5.3979 10 28 1.44565 2.61388 6.5371 4.6614
(a)
SBH
EBH ε U
(ml/min)
U×104
(m/s) Bo Daxl×10
6
10 13 0.54 0.64 1.358 6.0628 5.3923 10 18 0.66 1.8 3.821 6.1803 1.6857 10 23 0.74 3 6.366 5.0673 3.9046 10 28 0.78 4 8.488 1.4684 2.0751
(b)
(a) (b)
Figure 5: Axial dispersion coefficient as a function of bed expansion with the mathematical (a) and short-cut (b) methods. Axial dispersion measurements were performed using a negative step signal method. Dilute acetone
(1% (v/v) in buffer A was used as the input to the contactor and the UV absorbance of the bed effluent was monitored, quantified and recorded. These experiments were carried out in a column with a 1 cm diameter.
The Effect of Column Diameter on Hydrodynamic Performance
A step input of a tracer solution (acetone) was used to characterize the overall degree of mixing and to investigate the effect of column diameter. It is clear that an increase of the column diameter causes an increase in the liquid mixing, but this prediction is qualitative, and, in order to have a quantitative prediction for designing the large scale expanded bed columns, comparison of the Bodenstein Number (Bo)
and Axial Coefficient (Daxl) for different column
diameters is vital. Here these values for three different column diameters (1, 1.6 and 2.5 cm) were calculated by the two mentioned methods. Comparison of Bo demonstrated our expectation that
an increase of column diameter causes an increase in mixing. Because larger Bo represents lower mixing
and lower mixing is itself a sign of higher efficiency, scaling up somehow disturbs the efficiency of the columns .The results obtained with the exact and approximate methods are shown in Table 4. The settled bed height was 10 cm and the bed was expanded to 23 cm.
Table 4: B0, and Daxl for columns with different diameters obtained
with the exact (a) and approximation (b) methods.
ID(cm) σ t B0 Daxl×105
1 3.399442 4.602144 3.6655 3.2388 1.6 3.722655 4.167832 2.5069 4.3162 2.5 3.127859 3.638553 2.7064 5.8487
Comparative Study of Hydrodynamic Behavior of Liquid Expanded Bed Adsorption 305
Brazilian Journal of Chemical Engineering Vol. 26, No. 02, pp. 299 - 306, April - June, 2009
ID
(cm) ε U (ml/min) U×10
4 (m/s) B
o Daxl×105
1 0.74 1.8 3.8197 10.1867 1.1654 1.6 0.74 4.2 3.4815 6.9147 1.5649 2.5 0.74 15 5.0929 7.04586 2.2466
(b)
CONCLUSIONS
The hydrodynamic characteristics of a liquid fluidized bed adsorption were investigated herein. The streamline adsorbent was subjected to bed expansion assessment and conformed to the Richardson – Zaki correlation. The terminal velocity of the adsorbent beads and bed expansion behavior could be approximated using the Shiller and Naumann model. The mass transfer between liquid and solid phases in a liquid fluidized bed in the low Reynolds number region has often been reported to be affected by axial dispersion; therefore, experimental data concerning the degree of liquid-solid mixing was obtained here from step-input studies.
The results indicated that, upon increasing
column diameter, Bo decreased. However, RTD
analysis showed reduced Daxl values with decreasing
bed expansion. It also has been found that a settled bed height of 8-10 cm and a bed expansion between 80%-130% are suitable with respect to the operation of fluidized bed systems. All calculations were carried out by the mathematical as well as the approximate short-cut method.
To the best of our knowledge, the current study is the first one that has demonstrated the potential for exploiting the short-cut method side-by-side with the commercial mathematical method. If the large scale hydrodynamic investigation of fluidized bed adsorption is successful, optimization of hydrodynamic performance with good adsorption will contribute to the de-bottlenecking of current biopharmaceutical manufacture.
ACKNOWLEDGMENTS
The authors acknowledge support of Babol University of Technology and Tehran University for various aspects of this collaborative work.
REFERENCES
Amersham Bioscience: Expanded Bed Adsorption – principles and methods, Pharma Biotech, Uppsala, Sweden (1998).
Bilerau, H., Zhang, Z., Lyddiatt, A., Direct process
integration of cell disruption and fluidized bed adsorption for the recovery of intracellular proteins. Chem. Tech. Biotechol., 74, 208 (2001). Camprubi, S., Bruguera, M., Canalias, F.,
Purification of recombinant histidine-tag streptolysin O using immobilized metal affinity expanded bed adsorption (IMA-EBA), J. Biological Macromolecules, 38, 134–139 (2006). Clemmitt, R. H., Chase, H. A., Facilitated
downstream processing of a histidine-tagged protein from unclarified E. coli homogenates using immobilized metal affinity expanded-bed adsorption. Biotechnol, Bioeng, 67, 206-216 (2000).
Ferreira G. N. M., Cabral, J. M. S., Prazeres, D. M. F., Anion exchange purification of plasmid DNA using expanded bed adsorption, Bioseparation, 9, 1-6 (2000).
Jahanshahi, M., Re-design of downstream processing techniques for nanoparticulate bioproducts. Iranian Journal of Biotechnol, 2, (2004).
Jahanshahi, M., Ling, T. C., Ghoreyshi, A., Khavarpour, M., Analysis of performance of the anion exchange and pseudo-affinity chromatography for intracellular enzyme purification, Iranian Journal of Chem. Eng. 3, 92-107 (2006).
Jahanshahi, M., Pacek, A. W., Nienow, A. W., Lyddiatt, A., Fabrication by three-phase emulsification of pellicular adsorbents customized for liquid fluidized bed adsorption of bioproducts, J. Chem. Tech. Biotechnol., 78, 111-1120 (2003).
Lan, J. C. W., Protein purification using fluidized bed chromatography, Physical and biochemical characterization of a simple adsorbent contactor, University of Birmingham, PhD Thesis (2000). Levenspiel, O., Chemical Reaction Engineering,
Wiley & Sons, New York (1972).
Mullick, A., Flickinger, M. C., Expanded bed adsorption of human serum albumin from very dense Saccharomyces cerevisiae suspensions on fluoride-modified zirconia, Biotechnol. Bioeng., 65, 282 (1999).
Pai, A., Gondkar, S., Lali, A., Enhanced performance of expanded bed chromatography on rigid superporous adsorbent matrix, J. Chromatogr., A., 867, 113-130 (2000).
Thommes, J., Fluidized bed adsorption as a primary
recovery step in protein purification, Advances in Biochem. Engine./Biotechnol., 58, 185,(1997). Thommes, J., Halfar, M., Lenz, S., Kula, M. R.,
purification of monoclonal antibodies from whole hybridoma fermentation broth by fluidized bed adsorption, Biotechnol. Bioeng., 45, 205-211 (1995).
Tong, X., Sun, D. Y., Particle size and density distributions of two dense matrices in an expanded bed system, J. Chromatogr A. 977, 173-183 (2002).