1
Universidade Federal do Ceará, Programa de Pós-Graduação em Enfermagem, Departamento de Enfermagem. Fortaleza, CE, Brasil.
2
Instituto Materno Infantil de Pernambuco, Programa de Pós-Graduação em Saúde Materno-Infantil. Recife, PE, Brasil. 3
Universidade Estadual da Paraíba, Centro de Ciências Biológicas e da Saúde, Programa de Pós-Graduação em Saúde Pública. Campina Grande, PB, Brasil.
4
Universidade Estadual da Paraíba, Centro de Ciências Biológicas e da Saúde, Departamento de Fisioterapia. Campina Grande, PB, Brasil.
5
Universidade Estadual da Paraíba, Programa de Pós-Graduação em Enfermagem. Av. das Baraúnas, 351, Bairro Universitário, 58429-500, Campina Grande, PB, Brasil. Correspondência para/Correspondence to: CCM MUNIZ. E-mail: <[email protected]>.
Support: Pró-Reitoria de Pós-Graduação e Pesquisa of Universidade Estadual da Paraíba (Process nº 093/2011) and Fundação de Apoio à Pesquisa do Estado da Paraíba (Process nº 198/08).
Sleep quality and metabolic syndrome in
overweight or obese children
and adolescents
Qualidade do sono e síndrome metabólica
em crianças e adolescentes com
sobrepeso ou obesidade
Nathalia Costa GONZAGA1 Aline Silva Santos SENA2 Alexsandro Silva COURA3 Fábio Galvão DANTAS4 Renata Cardoso OLIVEIRA3 Carla Campos Muniz MEDEIROS3,
A B S T R A C T
Objective
To assess sleep quality and its association with metabolic syndrome and its components.
Methods
This cross-sectional study was conducted from June 2011 to March 2012 at the Childhood Obesity Center,
Results
The prevalence of poor sleep quality or sleep disorder according to the Pittsburgh Sleep Quality Index was 40.7%, and females had higher mean global Pittsburgh Sleep Quality Index score. Metabolic syndrome prevalence was 63.0%. Females also had higher daytime dysfunction. Poor sleep quality was associated with high diastolic blood pressure (OR=2.6; p=0.015) and waist circumference (OR=3.17; p=0.024) after adjusting for sex and age.
Conclusion
Girls had higher global Pittsburgh Sleep Quality Index score, which was associated with daytime dysfunction. Poor sleep quality was a predictor of high diastolic blood pressure in the study sample.
Keywords:Adolescent. Child. Metabolic syndrome. Obesity. Sleep.
R E S U M O
Objetivo
Avaliar a qualidade do sono e sua associação com a síndrome metabólica e seus componentes.
Métodos
Estudo transversal, realizado entre junho de 2011 e março de 2012 no Centro de Obesidade Infantil, Campina Grande, Paraíba. Foram incluídas 135 crianças e adolescentes com sobrepeso ou obesidade. A qualidade do sono foi avaliada pelo Pittsburgh Sleep Quality Index. Para o diagnóstico de síndrome metabólica, consideraram--se circunferência abdominal, pressão arterial, glicemia, lipoproteínas de alta densidade e triglicerídeos. Os dados foram analisados pelo Statistical Package for the Social Sciences versão 22.0, sendo adotado um nível de significância de 5%.
Resultados
A prevalência de má qualidade ou distúrbio do sono avaliado pelo Pittsburgh Sleep Quality Index foi 40.7%, e a média do escore global Pittsburgh Sleep Quality Index foi significativamente maior no sexo feminino. A prevalência de síndrome metabólica foi 63.0%. A disfunção diurna foi significativamente maior no sexo feminino. A má qualidade do sono esteve associada à pressão arterial diastólica elevada (OR=2,6; p=0,015) e à circunferência abdominal elevada (OR=3,17; p=0,024), após ajuste para sexo e idade.
Conclusão
As meninas apresentaram um maior escore global do Pittsburgh Sleep Quality Index e associação com a disfunção diurna. A má qualidade do sono mostrou-se fator preditor de pressão arterial diastólica elevada na amostra estudada.
Palavras-chave:Adolescente. Criança. Síndrome metabólica. Obesidade. Sono.
I N T R O D U C T I O N
Sleep is a vital necessity and its periodicity, quality, and constancy characterize very important variables in the development of children and adolescents1. Changes in sleep pattern and quality can affect people at a very young age and their consequences range from poor school performance to compromised physical and mental health2.
In the last years, the prevalence of voluntary sleep restriction, insomnia, and even poor sleep quality has increased concomitantly
with the growing prevalence of obesity in children and adolescents3.
The reason for the relationship between sleep and obesity has not been fully elucidated. Studies suggest that partial or chronic sleep deprivation causes energy unbalance by changing the levels of many hormones, including leptin and grehlin4,5, whose function relates to energy balance and control of body weight6,7 and insulin.
is related to the metabolic syndrome in overweight and obese children and adolescents8.
Hence, sleep has an important metabolic role as it may promote endocrine and metabolic changes that increase hunger and appetite, and consequently, the risk of overweight and obesity8.
Adolescents with short sleep duration (<7 hours/night) had lower intake of fruits and vegetables and higher intake of fast foods9. Along with inappropriate eating habits, it is possible that qualitative and quantitative sleep changes reduce the level of physical activity in children and adolescents1.
Most studies on the association between sleep and obesity in children assess sleep duration9-15, and few assess sleep quality14,16,17. However, assessment of sleep duration alone is not enough, qualitative aspects must also be assessed18. This is because when individuals have difficulty falling asleep or when they wake up frequently, effective sleep duration decreases, and the body does not spend enough time in deep sleep stages, even if total sleep duration is adequate19.
Questionnaires have been used for diagnosing sleep disorders, and although they are indirect and subjective assessment instruments, their administration requires little time, and they are free and easy to use in epidemiological studies16,17,20.
The Pittsburg Sleep Quality Index (PSQI) is an instrument commonly used for assessing sleep quality17,21.The version validated for the Brazilian population was developed in a study that compared PSQI and polysomnography, the gold standard sleep quality assessment method in adults. The results have shown that the Brazilian PSQI version is a valid and reliable instrument for assessing sleep quality in the month prior to the interview22.
Some studies have reported that sleep quality in adults assessed by the PSQI is associated not only with excess weight, but also with metabolic syndrome18,21. Metabolic syndrome is
an aggregation of cardiometabolic risk factors represented by hypertension, abdominal obesity, hypertriglyceridemia, low High Density Lipoprotein-cholesterol (HDL-c), and glucose intolerance23. Therefore, the detection of this condition at an early age is important for the implementation of prevention strategies.
In adolescents short sleep duration was associated with overweight but not with metabolic syndrome. Short sleep duration was associated with high blood pressure, and long sleep duration, with hypertriglyceridemia12.
Nevertheless, until now, no study has assessed the association between sleep quality and metabolic syndrome in children and adolescents. Moreover, studies that assess sleep quality in this population are scarce.
Hence, in order to contribute to this qualitative sleep aspect, and given the repercussion of sleep disorders on overweight and obese individuals, this study aimed to assess sleep quality and its association with the metabolic syndrome and its components in overweight or obese children and adolescents.
M E T H O D S
This cross-sectional study was conducted during the school year from June 2011 to March 2012 at the Childhood Obesity Center, located in the Instituto de Saúde Elpídeo de Almeida, Campina Grande (PB), Brazil. Childhood Obesity Center is a reference public service for providing multidisciplinary care to overweight and obese children and adolescents. Currently, 390 children and adolescents are registered.
The convenience sample consisted of all overweight and obese children and adolescents aged 5 to 18 years who attended the routine medical visit on Fridays during the school year, since sleep habits change during vacations24. Students with adenotonsillar hypertrophy; cardiorespiratory, neuromuscular, neoplastic, and/or advanced hepatic disease; and taking drugs that affected sleep (antidepressants, benzodiazepines, bronchodilators, corticosteroids, and illicit drug or alcohol abuse) at data collection were excluded.
During this period 190 individuals were treated. Seventeen of these were excluded, eleven because they were outside the study age range, two were normal weight, two had asthma, and two had adenoid hypertrophy. Thirty-three individuals did not show up for blood collection and five did not have one of the results for metabolic syndrome components, so the final sample consisted of 135 individuals.
The anthropometric variables (weight, height, and abdominal circumference) were measured twice and averaged, as recommended by the World Health Organization25.
Nutritional status classification was based on Body Mass Index (BMI), as recommended by the Centers of Disease Control and Prevention: overweight (85th percentile
≤BMI <95th percentile), obesity (95th percentile
≤BMI <97th percentile), and morbid obesity (97th percentile
≤BMI)26. Abdominal circumference was considered high when ≥90th percentile, as recommended by the International Diabetes Federation27, with a maximum limit of 88 cm for girls and 102 cm for boys, as recommended by the National Cholesterol Education Program Adult Treatment Panel III (NCEP/ATPIII)28.
Blood pressure was measured three times two minutes apart each, as recommended by the V Brazilian Guidelines for High Blood Pressure29 using a mercury Tycos® sphygmomanometer made in Germany by WelchAllyn and appropriate-size cuff. The mean of the two last measurements was considered the systolic and diastolic blood pressure.
Blood was collected after a 12-hour fast by the Laboratory of Clinical Analyses of the UEPB. HDL-c, triglycerides, and glycemia were assessed by enzyme colorimetry by an automatic device (Modelo BioSystems 310, Curitiba, Paraná, Brazil).
Metabolic syndrome diagnosis was based on the criteria provided by NCEP/ATPIII28 adapted for the age group, which requires the presence of at least three of these criteria: abdominal circumference ≥90th percentile for sex, age, and race; triglycerides ≥100 mg/dL; HDL-c <45 mg/dL; fasting glycemia ≥100 mg/dL; and systolic and/or diastolic blood pressure ≥90th percentile for sex, height, and age.
The Pittsburg Sleep Quality Index30 assessed sleep quality during the previous month. This Portuguese version of this instrument has been validated31. PSQI contains seven components: subjective sleep quality (subjective sensation of satisfaction with daily sleep), sleep latency (long sleep start time), sleep duration, habitual sleep efficiency (proportion between hours slept and total hours in bed), sleep disorders (sleep interruption), use of sleeping pills, and daytime dysfunction.
The global score is given by adding the seven components. Each component receives a score ranging from 0 to 3 points with the same weight, and 3 represents the negative extreme of a Likert-type scale. Hence, the total score may range from 0 to 21 points. Sleep quality is classified as follows: 0-5 = good sleep quality; 6-10 = poor sleep quality; >10 = sleep disorder. All participants with a PSQI score higher than 5 (PSQI >5) were diagnosed with poor sleep quality as the score indicates great difficulty in at least two components, or moderate difficulty in more than three components30.
every night and frequency of not falling asleep within 30 minutes). Sleep duration scored 0-3 points (0 = sleep duration >7 hours; 1=6 -≤7 hours; 2=5 -<6 hours; 3=<5hours). Habitual sleep efficiency scored 0-3 points (classified according to the sum of the answers related to sleeping problems caused by nine reasons and their frequency, such as feeling hot or cold: 0=0; 1=9-1; 2=10-18; 3=19-27). The use of sleeping pills scored 0-3 points (0 = did not use in the last month; 1 = used less than once a week; 2 = used once or twice a week; 3 = used three or more times a week). Daytime dysfunction scored 0-3 points (classified according to the sum of the answers related to the frequency of having problems to stay awake while driving, during meals, or during social activities, and the frequency of having problems to remain enthusiastic enough to carry out activities of daily living: 0-0; 1-2=1; 3-4=2; 5-6=3).
The population was described according to their anthropometric and clinical variables, expressed as absolute and relative frequencies, means, and standard deviations. Group means were compared by the Student’s t test or Analysis of Variance (Anova) for three groups and the proportions were compared by the Chi-square test or Fisher’s exact test. Univariate logistic regression assessed the relationship between metabolic syndrome and its components and sleep disorder diagnosed based on PSQI score, which was later adjusted for sex and age. The Odds Ratio (OR) was calculated based on logistic regression. The logistic regression was performed by transforming the PSQI variable into dummy variables, the reference group being good sleep quality.
The statistical analyses were performed by the software Statistical Package for the Social Sciences (SPSS Inc., Chicago, Illinois, United States), version 22.0, at a significance level of 5%.
R E S U L T S
Table 1 shows the sample characteristics. Of the 135 study children and adolescents, 56.3%
were females, 64.4% were classified as morbidly obese, and 76.3% were adolescents. The mean age was 12.7±3.4 years (5.0-20.0). Sex was associated with nutritional status, males were associated with morbid obesity when the groups morbid obesity and obesity were compared (p=0.010).
The prevalence of poor sleep quality/sleep disorder according to the PSQI score was 40.7%, and the prevalence was higher in females (44.7 versus 35.6%) (Table 1).
More than half (55.6%) the sample classified their sleep in the previous month as bad or very bad. Metabolic syndrome prevalence was 63.0%. Low HDL-c and blood glucose changes were the most and least frequent metabolic syndrome components, respectively. High abdominal circumference was associated with being male (Table 1).
The mean Pittsburgh Sleep Quality Index score of adolescents was higher than that of children. While adolescents had a mean score of 5.21±2.60 (4.70-5.72), children had a mean score of 4.44±3.29 (3.25-5.62) (p=0.170).
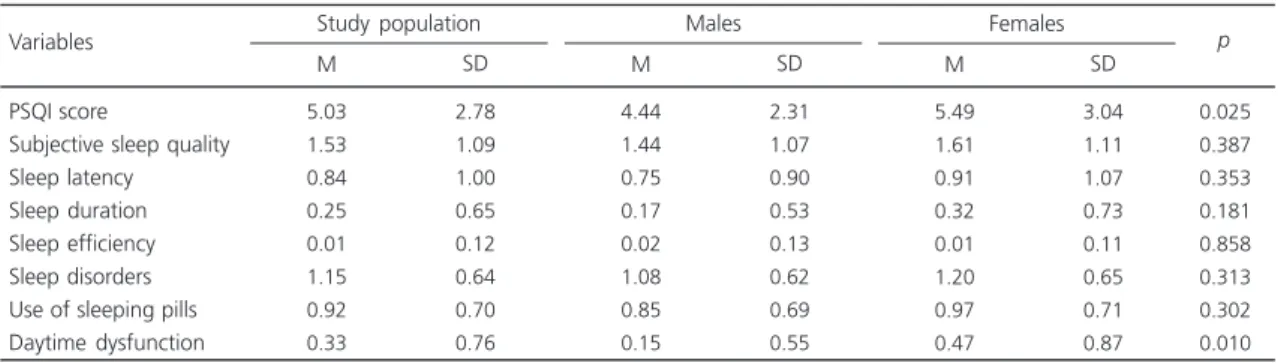
Pittsburgh Sleep Quality Index component with the highest mean was subjective sleep quality. Females had higher mean scores in six PSQI components, except efficiency, and the mean daytime dysfunction score was significantly higher in girls (Table 2).
The mean Pittsburgh Sleep Quality Index and PSQI component scores were not different between those with and without metabolic syndrome, regardless of sex. Although no association was found in females with metabolic syndrome, most of their PSQI items had higher mean scores than those of males with metabolic syndrome (Table 3).
Pittsburgh Sleep Quality Index and/or its components were not associated with metabolic syndrome, according to logistic regression (Table 4).
Table 1. Characterization of the entire sample and by sex (N=135). Campina Grande (PB), Brazil, 2011-2012.
1 of 2
Age (years) Body mass index
Mean sleep duration (h/day)
Age group
Child (6 to 9 years) Adolescent (10 to 18 years)
Body mass indexpercentile
Overweight Obese Morbidly obese
Sleep quality
Good quality (PSQI ≤5) Poor quality (PSQI 6-10) Sleep disorder (PSQI >10)
PSQI scores 0-1 2-3 4-5 6-7 8-9 10-11 12-13 14-15 16-21
Subjective sleep quality
Very good Good Bad Very bad Sleep latency 0 1 2 3 Sleep duration >7 hours 6-7 hours 5-6 hours <5 hours
Habitual sleep efficiency
0 (≥85%) 1 (75-84%) 2 (65-74%) 3 (<65%) Sleep disorders 0 1 2 3 12.70 29.84 08.45 n 32 103 5 43 87 80 46 9 11 32 37 29 17 6 3 0 0 33 27 45 30 67 36 19 13 114 11 7 3 133 2 0 0 16 86 30 3 03.40 05.90 01.84 % 23.70 76.30
03.70
31.90
64.40
59.30
34.10 06.70
08.10
23.70
27.40
21.50
12.60 04.40 02.20 00.00 00.00
24.40 20.0 33.4 22.2 49.60 26.70 14.10 09.60
84.40 08.10 05.20 02.20
98.50 01.50 00.00 00.00
11.90
63.70
22.20 02.20 Variables M DP Total population 12.16 30.26 08.76 n 17 42 2 12 45 38 20 1 6 15 17 16 4 1 0 0 0 16 11 22 10 30 17 9 3 52 5 1 1 58 1 0 0 7 42 8 2 03.26 06.97 01.64 % 28.80 71.20
03.40
20.30
76.30
64.40
33.90 01.7 0
10.20
25.40
28.80
27.10 06.80 01.70 00.00 00.00 00.00
27.10 18.60 37.30 16.90 50.80 28.80 15.30 05.10
88.10 08.50 01.70 01.70
98.30 01.70 00.00 00.00
11.90
71.20
13.60 03.40
M DP Male 13.11 29.51 08.21 n 15 61 3 31 42 42 26 8 5 17 20 13 13 5 3 0 0 17 16 23 20 37 19 10 10 62 6 6 2 75 1 0 0 9 44 22 1 3.41 4.94 1.95 % 19.70 80.30
03.90
40.80
55.30
55.30
34.20
10.50
0 6.60
22.40
26.30
17.10
17.10 06.50 03.90 00.00 00.00
22.40 21.10 30.30 26.30 48.70 25.00 13.20 13.20 81.60 07.90 07.90 02.60
98.70 01.30 00.00 00.00
11.80
57.90
28.90 01.30
Table 1. Characterization of the entire sample and by sex (N=135). Campina Grande (PB), Brazil, 2011-2012.
2 of 2
Use of sleeping pills
0 1 2 3 Daytime dysfunction 0 1 2 3 Metabolic syndrome Present Absent
N metabolic syndrome components
0 1 2 3 4 5 Abdominal circumference High Normal Blood Pressure High Normal
Systolic blood pressure
High Normal
Diastolic blood pressure
High Normal Fasting glycemia High Normal Triglycerides High Normal
High density lipoprotein-cholesterol
Low Normal 36 77 19 3 110 9 12 4 85 50 1 11 38 56 28 1 102 33 72 63 27 108 62 73 1 134 85 50 112 23 26.7 57.0 18.1
002.20
81.5 06.7 08.8 03.0 63.0 17.0 00.7 08.1 28.1 41.5 20.7 00.7 75.6 24.4 53.3 46.7 20.0 80.0 45.9 54.1 00.7 99.3 63.0 17.0 83.0 17.0 Variables M DP Total population 18 33 7 1 54 2 2 1 41 18 0 2 16 28 12 1 51 8 32 27 10 49 28 31 1 58 40 19 47 12 30.5 55.9 11.9
001.70
91.5 03.4 03.4 01.7 69.5 31.5 00.0 03.4 27.1 47.5 20.3 1.7 86.4 13.6 54.2 45.8 16.9 83.1 47.5 52.5 01.7 98.3 67.8 32.2 79.7 20.3 M DP Male 18 44 12 2 56 7 10 3 44 32 1 9 22 28 16 0 51 25 40 36 17 59 34 42 0 76 45 31 65 11
0023.70 0057.90 0015.80 0002.60
0073.70 009.2
0013.20 003.9
0057.90 0042.10
0001.30 0011.80 0028.90 0036.80 0021.10 000.0
0067.10 0032.90
0052.60 0047.40
0022.40 0077.60
0044.70 0055.30
000.0 100.0 059.2 040.8 085.5 014.5
M DP
Female Sex 0.778 0.068 0.166 0.313 0.010 0.853 0.435 0.753 0.437 0.306 0.369 p
Note: Difference between the groups with morbid obesity and obesity, p=0,010; Difference between the groups with overweight and obesity,
that individuals with poor sleep quality were up to 2.5 times more likely to have high diastolic blood pressure (p=0.018; 95% Confidence Inteval-95%CI=1.17-5.43), and the risk increased to 2.62 (p=0.01; 95%CI=1.20-5.69) after adjusting for sex and age (OR=2.62) (Table 5).
After adjusting the components for sex and age, high abdominal circumference was associated with poor sleep quality (OR=3.17; p=0.02; 95%CI=1.17-8.60) (Table 5).
Table 2. Mean values and standard deviations of the Pittsburgh Sleep Quality Index (PSQI) domains by sex (N=135). Campina Grande
(PB), Brazil, 2011-2012.
PSQI score
Subjective sleep quality Sleep latency Sleep duration Sleep efficiency Sleep disorders Use of sleeping pills Daytime dysfunction Variables 5.03 1.53 0.84 0.25 0.01 1.15 0.92 0.33 2.78 1.09 1.00 0.65 0.12 0.64 0.70 0.76 M SD Study population 4.44 1.44 0.75 0.17 0.02 1.08 0.85 0.15 2.31 1.07 0.90 0.53 0.13 0.62 0.69 0.55 M SD Males 5.49 1.61 0.91 0.32 0.01 1.20 0.97 0.47 3.04 1.11 1.07 0.73 0.11 0.65 0.71 0.87 M SD Females 0.025 0.387 0.353 0.181 0.858 0.313 0.302 0.010 p
Table 3. Comparison between global Pittsburgh Sleep Quality Index (PSQI) score and its components by presence of metabolic syndrome(N=135). Campina Grande (PB), Brazil, 2011-2012.
Males
Global PSQIscore Subjective sleep quality Sleep latency Sleep duration Habitual sleep efficiency Sleep disorders Use of sleeping pills Daytime dysfunction
Females
Global PSQI score Subjective sleep quality Sleep latency Sleep duration Habitual sleep efficiency Sleep disorders Use of sleeping pills Daytime dysfunction Variables 4.41 1.44 0.73 0.24 0.00 1.10 0.76 0.15 5.57 1.61 0.93 0.34 0.02 1.18 0.95 0.48 2.29 1.09 0.89 0.62 0.00 0.70 0.62 0.57 3.07 1.10 1.09 0.80 0.15 0.62 0.72 0.88 -3.69-5.14 -1.09-1.79 -0.45-1.01 -0.05-0.44 -0.00-0.00 -0.88-1.32 -0.56-0.95 -0.03-0.33 -4.64-6.50 -1.28-1.95 -0.60-1.26 -0.10-0.59 -0.02-0.07 -0.99-1.37 -0.74-1.17 -0.21-0.74 SD Mean 95%CI
Presence of metabolic syndrome
4.50 1.44 0.78 0.00 0.06 1.06 1.06 0.17 5.38 1.59 0.88 0.28 0.00 1.22 1.00 0.47 2.43 1.04 0.94 0.00 0.23 0.42 0.80 0.51 3.06 1.13 1.07 0.63 0.00 0.71 0.72 0.88 -3.29-5.71 -0.93-1.96 -0.31-1.25 -0.00-0.00 -0.06-0.17 -0.85-1.26 -0.66-1.45 -0.09-0.42 -4.27-6.48 -1.19-2.00 -0.49-1.26 -0.05-0.51 -0.00-0.00 -0.96-1.47 -0.74-1.26
- 0.15-0.79
SD
Mean 95%CI
Absence of metabolic syndrome
0.898 0.986 0.858 0.104 0.132 0.814 0.126 0.898 0.787 0.939 0.821 0.729 0.397 0.810 0.787 0.967 p
Note: SD: Standard Deviation; 95%CI: 95% Confidence Interval.
The possibility of sleep disorder was not associated with metabolic syndrome components probably because of the small sample size.
D I S C U S S I O N
It is critical to identify sleep disorders during childhood because of the importance of introducing strategies to promote sleep quality and prevent metabolic complications, such as
excess weight10,32. Sleep disorders are often underdiagnosed in this age group as they depend on the perception of caregivers given that children do not always verbalize symptoms related to this condition33.
Sleep quality in this study was measured by the PSQI index and its components (subjective quality, latency, duration, habitual efficiency, sleep disorders, use of sleeping pills, and daytime sleepiness) in a group of children and adolescents with excess weight, and the prevalence of poor sleep quality in the sample was high.
A study with Brazilian university students with a mean age of 21.5 years found that 95.3%
had poor sleep quality (PSQI >5), and the mean PSQI score was 9.4 points34.
Some factors that may influence sleep quality in children and adolescents are long periods watching television35 and changes in the daily routine and habit during vacations. This last item leads to changes in sleeping pattern, such as going to bed later and consequently, getting less rapid eye movement sleep. Both factors were associated with a higher risk for obesity in children and adolescents36.
Poor sleep quality was more prevalent among the study adolescents. This condition may affect wake quality to a variable degree, especially in this age group, since they go to bed late in
Table 4.Odds Ratio (OR) of metabolic syndrome by Pittsburgh Sleep Quality Index (PSQI) and its components (N=135). Campina Grande (PB), Brazil, 2011-2012.
Global PSQI score Subjective sleep quality
Sleep latency
Sleep duration
Habitual sleep efficiency
Sleep disorders
Use of sleeping pills
Daytime dysfunction Variables
≤5 >5 0 1 2 3 0 1 2 3 0 1 2 3 0 1 2 3 0 1 2 3 0 1 2 3 0 1 2 3
80 55 33 27 45 30 67 36 19 13 114 11 7 3 133
2 0 0 16 86 30 3 36 77 19 3 110
9 12
4
1.00 0.73 1.00 1.42 1.14 1.94 1.00 1.18 0.53 0.93 1.00 0.94 1.24 2.67 1.00 0.58 -1.00 0.56 0.76 0.50 1.00 0.79 0.57 0.62 1.00 1.14 0.57 1.71
Reference (0.35-1.49)
Reference (0.50-4.00) (0.46-2.82) (0.68-5.49) Reference (5.23-2.69) (0.17-1.64) (0.27-3.13) Reference (0.26-3.41) (0.26-5.80) (0.00-0.00) Reference (0.036-9.536)
-Reference (0.19-1.65) (0.23-2.58) (0.04-6.68) Reference (0.36-1.78) (0.18-1.86) (0.05-7.53) Reference (0.27-4.82) (0.17-1.89) (0.17-17.03)
0.391
0.511 0.766 0.210
0.684 0.270 0.902
0.929 0.786 0.999
0.705
-0.296 0.666 0.600
0.581 0.357 0.711
0.856 0.359 0.645
Score n OR (95%CI) p
their biological configuration and tend to wake up late, which is not possible during the school year, resulting in excessive daytime sleepiness37.
A study of Brazilian adolescents using the Sleep Behavior Questionnaire found that the obese group had worse sleep quality than the normal weight group16.
Females had higher mean global PSQI and daytime dysfunction scores than males. This association with being female corroborates a study done with 1,481 adults that also assessed the relationship between sleep quality and metabolic syndrome by sex18.
Although sleep quality was not associated with metabolic syndrome in the present study, sleep quality was associated with diastolic blood pressure and abdominal circumference.
Another two studies did not find an association between sleep duration and metabolic syndrome12,38. In male and female adults, the mean global PSQI score and the mean score of its components, especially sleep latency and sleep disorders, have been associated with metabolic syndrome18.
Adolescents with sleep-related breathing disorders diagnosed by polysomnography were seven times more likely to have metabolic syndrome than those without sleep-related breathing disorders (OR=7.74; 95%CI=3.10-19.35), and this association was not explained by sex, race, or socioeconomic condition39.
High diastolic blood pressure was found in children with obstructive sleep apnea40. Adolescents with low sleep efficiency determined
Table 5. Logistic regression between Pittsburgh Sleep Quality Index and components of metabolic syndrome adjusted for age and sex (N=135). Campina Grande (PB), Brazil, 2011-2012.
Metabolic syndrome
0-5 6-10 >10
Diastolic blood pressure
0-5 6-10 >10
Systolic blood pressure
0-5 6-10 >10
Triglycerides
0-5 6-10 >10
High density lipoprotein cholesterol
0-5 6-10 >10
Abdominal circumference
0-5 6-10 >10
Pittsburgh Sleep Quality Index
1.52 0.83
2.53 0.55
0.70 0.24
0.68 0.38
1.89 0.46
2.25 0.81
1.00 (0.70-3.29) (0.21-3.34)
1.00 (1.17-5.43) (0.13-2.36)
1.00 (0.28-1.75) (0.06-1.03)
1.00 (0.32-1.45) (0.09-1.55)
1.00 (0.64-5.60) (0.10-2.06)
1.00 (0.88-5.75) (0.19-3.50)
Reference 0.284 0.797
Reference 0.018 0.424
Reference 0.444 0.054
Reference 0.322 0.180
Reference 0.249 0.311
Reference 0.091 0.775
OR (95%CI) p
Univariate analysis
1.60 0.98
2.62 0.50
0.73 0.25
0.68 0.43
1.81 0.38
3.17 1.12
1.00 (0.73-3.51) (0.24-4.08)
1.00 (1.20-5.69) (0.11-2.21)
1.00 (0.29-1.86) (0.06-1.10)
1.00 (0.32-1.46) (0.10-1.78)
1.00 (0.61-5.43) (0.08-1.82)
1.00 (1.17-8.60) (0.22-5.69)
Reference 0.242*
0.983*
Reference 0.015*
0.363*
Reference 0.515*
0.067*
Reference 0.325*
0.246*
Reference 0.287*
0.226*
Reference 0.024*
0.891*
OR (95%CI) p
Adjusted for sex and age
Note:*p<0.05.
by actigraphy were 3.5 times more likely to have high blood pressure41, a higher risk than the one found by the present study. This fact may be due to the different methods used for determining sleep quality.
A study that assessed sleep quality with full-night polysomnography found that the absence of deeper sleep stages, such as rapid eye movement sleep and slow-wave sleep, was associated with high morning blood pressure in obese adolescents regardless of BMI42.
A study with obese Korean adolescents found that short sleep duration was associated not only with high blood pressure but also with high abdominal circumference12.
In the present study, high abdominal circumference was associated with poor sleep quality after adjusting for age and sex, and may be used as a marker of sleep quality12.
In this sense, assessment of obese adolescents must include investigation of blood pressure, abdominal circumference, and the signs and symptoms associated with poor sleep quality, including snoring, fatigue, and daytime sleepiness. Thus, poor sleep quality must be considered in the follow-up of hypertensive obese youth42.
The present study found a high prevalence of poor sleep quality and the need of including this assessment in primary health care, especially in obese individuals. Health professionals who work with children and adolescents must know sleep physiology and its physiological maturation process to prevent or treat pathological behaviors. Therefore, questions regarding sleep quality and possible damaging factors should be included in the patient’s assessment, in addition to advice on
sleep hygiene, which should be part of children’s
health care32.
Sleep hygiene practices include changes in the sleep environment, and parents’ and children’s practices and routines that favor good sleep quality of adequate duration, in addition to the practice of activities that favor sleepiness in order to promote sleep43.
This study has limitations, such as the use of a convenience sample, the absence of a control group, the cross-sectional design, which does not allow the identification of the relationship of causality, and the use of a questionnaire to assess sleep quality, which although equivalent, is less accurate than other analytical methods such as polysomnography and actigraphy. The relative scarcity of pediatric studies that analyze the relationship between sleep quality and metabolic syndrome hindered comparison of the results.
The study is important because the assessment of the sleep quality of overweight and obese children and adolescents revealed a high prevalence of poor sleep quality and its association with high diastolic blood pressure in adolescents.
C O N C L U S I O N
Girls had higher global Pittsburgh Sleep Quality Index score and an association between said score and daytime dysfunction. Sleep quality was not associated with metabolic syndrome in the study overweight or obese children and adolescents. Adolescents with poor sleep quality were significantly more likely to have high diastolic blood pressure.
The realization of other studies on this subject in other Brazilian municipalities with a larger sample, control group, and longitudinal design may contribute to the understanding of the influence of sleep quality on metabolic changes, risk factors for cardiovascular disease and indispensable for the institution of child health policies in the national landscape.
C O N T R I B U T O R S
R E F E R E N C E S
1. American Academy of Pediatrics. School start times for adolescents. Pediatrics. 2014; 134(3):642-9. http://dx.doi.org/10.1542/peds.2014-1697 2. Shochat T, Cohen-Zion M, Tzischinsky O. Functional
consequences of inadequate sleep in adolescents: A systematic review. Sleep Med Rev. 2014; 18(1):75e87. http://dx.doi.org/10.1016/j.smrv. 2013.03.005
3. Logue EE, Scott ED, Palmieri PA, Dudley P. Sleep duration, quality, or stability and obesity in an urban family medicine center. J Clin Sleep Med. 2014; 10(2):177-82. http://dx.doi.org/10.5664/jcsm.3448 4. Cao M, Zhu Y, He B, Yang W, Chen Y, Jun M, et al. Association between sleep duration and obesity is age- and gender-dependent in Chinese urban children aged 6-18 years: A cross-sectional study. BMC Public Health. 2015; 15(1029):1-10. http:// dx.doi.org/10.1186/s12889-015-2359-0
5. Zhang B, Hao Y, Zhou J, Jia F, Li X, Tang Y, et al. The association between sleep patterns and overweight/ obesity in Chinese children: A cross-sectional study. Neuropsychiatr Dis Treat. 2015; 11:2209-16. http:// dx.doi.org/10.2147/NDT.S90838
6. Fatima Y, Doi SAR, Mamun AA. Longitudinal impact of sleep on overweight and obesity in children and adolescents: A systematic review and bias-adjusted meta-analysis. Obesity Rev. 2015; 16(2):137-49. http://dx.doi.org/10.1111/obr.12245
7. Gonzaga NC, Medeiros CCM, de Carvalho DF, Alves JGB. Leptin and cardiometabolic risk factors in obese children and adolescents. J Paediatr Child Health. 2014; 50:707-12. http://dx.doi.org/10.11 11/jpc.12610
8. Medeiros CCM, Ramos AT, Cardoso MAA, França ISX, Cardoso AS, Gonzaga NC. Insulin resistance and its association with metabolic syndrome components. Arq Bras Cardiol. 2011; 97(5):380-9. 9. Kruger AK, Reither EN, Peppard PE, Krueger PM, Hale L. Do sleep-deprived adolescents make less-healthy food choices? Br J Nutr. 2014; 111(10):1898-904. http://dx.doi.org/10.1017/S00 07114514000130
10. Magee C, Iverson PCD. Lack of sleep could increase obesity in children and too much television could be partly to blame. Acta Paediatrica. 2014; 103(1):e27-e31. http://dx.doi.org/10.1111/apa.12 447
11. Martinez SM, Tschann JM, Greenspan LC, Deardorff J, Penilla C, Flores E, et al. Is it time for bed? Short sleep duration increases risk of obesity in Mexican American children. Sleep Med. 2014; 15(12):1484-9.
12. Lee JA, Park HS. Relation between sleep duration, overweight, and metabolic syndrome in Korean adolescents. Nutr Metab Cardiovasc Dis. 2014; 24(1):65-71. http://dx.doi.org/10.1016/j.numecd. 2013.06.004
13. Scharf RJ, Deboer MD. Sleep timing and longitudinal weight gain in 4- and 5-year-old children. Pediatr Obes. 2014; 10(2):141-8. http://dx.doi.org/10. 1111/ijpo.229
14. Boeke CE, Storfer-Isser A, Redline S, Taveras EM. Childhood sleep duration and quality in relation to leptin concentration in two cohort studies. Sleep. 2014; 37(3):613-20. http://dx.doi.org/10.5665/sleep. 3510
15. Kjeldsen JS, Hjorth MF, Andersen R, Michaelsen KF, Tetens I, Astrup A, et al. Short sleep duration and large variability in sleep duration are independently associated with dietary risk factors for obesity in Danish school children. Int J Obes. 2014; 38(1):32-9. http://dx.doi.org/10.1038/ijo.2013.147
16. Turco G, Bobbio T, Reimão R, Rossini S, Pereira H, Barros Filho A. Quality of life and sleep in obese adolescents. Arq Neuropsiquiatr. 2013; 71(2):78-82. http://dx.doi.org/10.1590/S0004-282X2013005 000008
17. Tan E, Healey D, Gray AR, Galland BC. Sleep hygiene intervention for youth aged 10 to 18 years with problematic sleep: A before-after pilot study. BMC Pediatrics. 2012; 12(189):1-9. http://dx.doi.org/10. 1186/1471-2431-12-189
18. Okubo N, Matsuzaka M, Takahashi I, Sawada K, Sato S, Akimoto N, et al. Relationship between self-reported sleep quality and metabolic syndrome in general population. BMC Public Health. 2014; 14(562):1-7. http://dx.doi.org/10.1186/1471-24 58-14-562
19. Michels N, Verbeiren A, Ahrens W, de Henauw S, Sioen I. Children’s sleep quality: Relation with sleep duration and adiposity. Public Health. 2014; 128(5):488-90. http://dx.doi.org/10.1016/j.puhe. 2014.02.003
20. Hanne KJG, Adam TC, Hursel R, Rutters F, Verhoef SPM, Westerterp-Plantenga MS. Sleep duration, sleep quality and body weight: Parallel developments. Physiol Behav. 2013; 121:112-6. http://dx.doi.org/ 10.1016/j.physbeh.2013.04.007
21. Hung HC, Yang YC, Ou HY, Wu JS, Lu FH, Chang CJ. The Association between self-reported sleep quality and metabolic syndrome. PloS One. 2013; 8(1):e54304. http://dx.doi.org/10.1371/journal. pone.0054304
Quality Index. Sleep Med. 2011; 12(1):70-5. http://dx. doi.org/10.1016/j.sleep.2010.04.020
23. Neto AS, Bozza R, Ulbrich A, Mascarenhas LPG, Boguszewski MC, Campos W. Síndrome metabólica em adolescentes de diferentes estados nutricionais. Arq Bras Endocrinol Metab. 2012; 56(2):104-9. http://dx.doi.org/10.1590/S0004-2730201200 0200003
24. Hart CN, Cairns A, Jelalian E. Sleep and obesity in children and adolescents. Pediatr Clin North Am. 2011; 58(3):715-33.
25. World Health Organization. Physical status: The use and interpretation of anthropometry. Technical Report Series, nº 854. Geneva: WHO; 1995. 26. Centers of Disease Control and Prevention. Table
for calculated body mass index values for selected highs and weights for ages 2 to 20 years. Atlanta, GA: National Center for Health Statistic; 2000 [cited 2014 April 6]. Available from: http://www.cdc.gov/ growthcharts
27. International Diabetes Federation. Worldwide definition of metabolic syndrome. Brussels: International Diabetes Federation; 2005 [cited 2014 Jun 10]. Available from: http://www.idf.org/home/ index.cfm?node=1429
28. The Third Report of the National Cholesterol Education Program. Expert Panel on Detection. Evaluation, and treatment of high blood cholesterol in adults (Adult Treatment Panel III). JAMA. 2002; 285(19):2486-97.
29. Sociedade Brasileira de Cardiologia. V Diretrizes Brasileiras de Hipertensão Arterial. Arq Bras Cardiol. 2007; 89(3):24-79.
30. Buysse DJ, Reynolds CF, Monk TH, Berman SR, Kupfer D. The Pittsburgh Sleep Quality Index: A new instrument for psychiatric practice and research. Psychiatry Res. 1989; 28(2):193-213. 31. Bertolazi AN, Fagondes SC, Hoof L, Dartora EG,
Miozzo ICS, Barba MEF, et al. Validation of the Brazilian Portuguese version of the Pittsburgh Sleep Quality Index. Sleep Med. 2011; 12(1):70-5. http:// dx.doi.org/10.1016/j.sleep.2010.04.020
32. Halal CS, Nunes ML. Education in children’s sleep hygiene: Which approaches are effective? A systematic review. J Pediatr. 2014; 90(5):449-56. http://dx.doi.org/10.1016/j.jped.2014.05.001 33. Verhulst SL, Schrauwen N, Haentjens D, Rooman RP,
Van Gall L, De Backer WA, et al. Sleep-disordered breathing and the metabolic syndrome in overweight and obese children and adolescents. J Pediatr. 2007; 150(6):608-12.
34. Araújo MFM, Lima ACS, Alencar AMPG, de Araújo TM, Fragoaso LVC, et al. Avaliação da qualidade do sono de estudantes universitários de Fortaleza - CE. Texto Contexto Enferm. 2013; 22(2):352-60. http:// dx.doi.org/10.1590/S0104-07072013000200011 35. Sijtsma A, Koller M, Sauer PJJ, Corpeleijn E. Television, sleep, outdoor play and BMI in young children: The GECKO Drenthe cohort. Eur J Pediatr. 2015; 174(5):631-9. http://dx.doi.org/10.1007/s00 431-014-2443-y
36. Hart CN, Cairns A, Jelalian E. Sleep and obesity in children and adolescents. Pediatr Clin North Am. 2011; 58(3):715-33.
37. Sena ASS, Cardoso AS, De Carvalho DF, Medeiros JL, Coutinho GF, Albuquerque FCL, et al. Excessive daytime sleepiness and cardiometabolic risk factors in children and teenagers with overweight. J Hum Growth Dev. 2013; 23(1):24-30.
38. Sung V, Beebe DW, Vandyke R, Fenchel MC, Crimmins NA, Kirk S, et al. Does sleep duration predict metabolic risk in obese adolescents attending tertiary services? A cross-sectional study. Sleep. 2011; 34(7):891-8. http://dx.doi.org/10.5665/ SLEEP.1122
39. Redline S, Storfer-Isser A, Rosen CL, Johnson NL, Kirchner HL, Emancipator J, et al. Association between metabolic syndrome and sleep-disordered breathing in adolescents. Am J Respir Crit Care Med. 2007; 176(4):401-8.
40. Marcus CL, Greene MG, Carroll JL. Blood pressure in children with obstructive sleep apnea. Am J Respir Crit Care Med. 1998; 157(4 Pt. 1):1098-103. 41. Javaheri S, Isser AS, Rosen CL, Redline S. Sleep
quality and elevated blood pressure in adolescents. Circulation. 2008; 118(10):1034-40. http://dx. doi.org/10.1161/CIRCULATIONAHA.108.766410 42. Hannon TS, Tu W, Watson SE, Jalou H, Chakravorty S,
Arslanian SA. Morning blood pressure is associated with sleep quality in obese adolescents. J Pediatr. 2014; 164(2):313-7. http://dx.doi.org/10.1016/j. jpeds.2013.10.011
43. Gruber R, Cassoff J, Knäuper B. Sleep health education in pediatric community settings: Rationale and practical suggestions for incorporating healthy sleep education into pediatric practice. Pediatr Clin North Am. 2011; 58(3):735-54. http:// dx.doi.org/10.1016/j.pcl.2011.03.006