Impact of the aspirated volume of fat tissue in the insulin
Impact of the aspirated volume of fat tissue in the insulin
Impact of the aspirated volume of fat tissue in the insulin
Impact of the aspirated volume of fat tissue in the insulin
Impact of the aspirated volume of fat tissue in the insulin
resistance after liposuction
resistance after liposuction
resistance after liposuction
resistance after liposuction
resistance after liposuction
Impacto do volume de gordura aspirado na resistência insulínica após
Impacto do volume de gordura aspirado na resistência insulínica após
Impacto do volume de gordura aspirado na resistência insulínica após
Impacto do volume de gordura aspirado na resistência insulínica após
Impacto do volume de gordura aspirado na resistência insulínica após
lipoaspiração
lipoaspiração
lipoaspiração
lipoaspiração
lipoaspiração
SÉRGIODE SOUZA OLIVEIRA1; JUBERT SANCHES CIBANTOS2; WAGNER TARGA RIPARI3; JOSÉ EDUARDODE AGUILAR-NASCIMENTO, TCBC-MT4
A B S T R A C T A B S T R A C T A B S T R A C T A B S T R A C T A B S T R A C T
Objective Objective Objective Objective
Objective: To investigate insulin resistance imposed by liposuction, correlating its intensity with the extent of the operation. Methods
Methods Methods Methods
Methods: The sample consisted of 20 female patients without comorbidities, aged between 21 and 43 years, body mass index between 19 and 27 kg/m2, undergoing liposuction alone or associated with breasts’ prosthesis. We assessed insulin resistance
at the beginning and end of the procedure by calculating the Homeostasis Model Assessment (HOMA-IR). The operative variables were length of liposuction, breast prosthesis time, body areas submitted to liposuction and total fat aspirated. Results
Results Results Results
Results: The liposuction time was 94-278 min (mean = 174 min), duration of breast prosthesis 20-140 min (mean = 65 min) and total fat aspirated 680-4280 g (mean = 1778 g). Statistical analysis was performed by considering a division line of 1500 g of aspirated fat and there was a significantly increased insulin resistance by HOMA index greater in the group > 1500 g (123% increase) than in the group d” 1500 g (an increase of 53 %) from the baseline data (p = 0.02). Other operative variables showed no significant correlation. ConclusionConclusionConclusionConclusionConclusion: Insulin resistance shows significant increase in liposuction, and it is correlated to the volume of aspirated fat.
Key words: Key words: Key words: Key words:
Key words: Surgical procedures, operative. Lipectomy. Adipose tissue. Intraoperative complications. Insulin resistance.
Work done at the Department of Surgical Clinics, Federal University of Mato Grosso, Cuiabá, State of Mato Grosso – MT, Brazil.
1. Assistant Professor, Anesthesiology, Faculty of Medicine, Federal University of Mato Grosso; 2. Plastic Surgeon, Brazilian Society of Plastic Surgery; 3. Head, Plastic Surgery Service, Cuiabá Cancer Hospital, Mato Grosso; 4. PhD, Professor, Department of Surgical Clinics, Federal University of Mato Grosso.
INTRODUCTION
INTRODUCTION
INTRODUCTION
INTRODUCTION
INTRODUCTION
T
he resulting organic response to trauma produced by surgical interventions have been a constant object of study, with demonstration that, when excessive, it has negative effects on patients1-5. The extent of trauma isdirectly correlated with the intensity of this response and its systemic consequences6-10.
The pathophysiology of the endocrine-metabolic response to trauma is dependent on two ways of stimulation: the one afferent to nervous system8 and the direct signaling
of cellular injuries, through the release of cytokines1-4. Both
converge to increased insulin resistance, to induce inflammatory responses, alter metabolism of amino acids and platelet and organ functions5,6,9,10, promoting protein
catabolism, gluconeogenesis and lipolysis. The change in insulin secretion after trauma has a double effect: initially there is suppression of its release, as a direct effect of catecholamines peak (acute traumatic or ebb phase). It starts in the first minutes after trauma, remained while there is acute stimulation. Secondly, there is a rapid rise in insulin (flow phase), consisting of a reactive activity to the
counteraction of pituitary-adrenal and thyroid hormones, and the effect of cytokines and other inflammatory mediators released in afterwards. Increased insulin would also be a milestone of anabolism recovery, provided certain limits are obeyed6,9,10,11.
The body fat tissue has been attributed a central role in the performance of energy metabolism of the organism. Currently, it has been understood as a conductor of many of the energy metabolism processes, of the endocrine and metabolic impacts related to the states of hunger/satiety, of the formation and release of distant cellular products and of systemic inflammatory reactions12.
Insulin resistance occurs after operations, being proportional to the extent of the procedure. The higher insulin resistance postoperatively6,7, the greater the length
of hospitalization, therefore the importance of its control11.
Our hypothesis is that the metabolic response and insulin resistance are proportional to the volume of aspirated fat in liposuction.
we believe that a study investigating insulin resistance in relation to the amount of fat suctioned could contribute new data to the literature.
The aim of this study was to investigate insulin resistance imposed by liposuction, correlating with the intensity and extent of the operation and volume of aspirated fat tissue.
METHODS
METHODS
METHODS
METHODS
METHODS
This is a prospective cohort study. The survey was conducted after approval by the Ethics and Research Committee of the Júlio Müller Hospital University in Cuiaba – MT, under protocol 766/CEP-HUJM/10. The patients sample used for data collection was selected according to convenience criteria, recruitment being performed amongst patients referred for performing liposuction practiced by three plastic surgeons, with similar surgical technique and working in the same hospital.
The inclusion criteria for the selection of individuals were age range from 18 to 45 years, being female, BMI 18 to 30 kg/m2 and clinical condition free of morbidity (ASA
score I). Exclusion criteria were: patient refusal to participate, smoking, alcohol use, illicit drug use, anorexigenic or thyroid hormone-derived medication use, early menopause, clinical or laboratory changes in preoperative physical condition that meant ASA different from I, associated operations, except breast implants or when time exceeded 120 minutes. Patients were evaluated in pre-anesthetic consultation and their clinical condition was determined by medical history and clinical examination, with verification of preoperative cardiac risk assessment and general laboratory exams. Total intravenous anesthesia was employed with hydration by crystalloids (Ringer lactate) in infusion of 4-10 ml/kg/h. The parameters monitored during surgery were: non-invasive blood pressure, cardiac monitoring, pulse oximetry, capnography and diuresis. Liposuction was performed by the wet technique, with approximately 1ml subcutaneous injection of ringer lactate (associated with epinephrine 1:1.000.000) per mililiter of aspirated fat.
On admission of the patient to the operating room a table was initialized for the recording of collected data, body composition being analyzed by bioelectrical impedance. Blood samples were collected in two phases: The first in venipuncture for installation of hydration before anesthesia and the second at the end of the operation. Measurements of glucose from capillary blood were performed at the same times of venous blood draw, using a blood glucose analyzer equipment. The laboratory methods used were glucose-peroxidase for glucose and chemiluminescence for insulin. Insulin resistance was evaluated by HOMA-IR (Homeostasis Model Assessment). The HOMA-IR was calculated as follows: HOMA-IR = fasting insulin (µU/l) x fasting glucose (mg/dl) / 40513. We recorded
the times of the main operation and of prosthetic breasts, when applicable. The number of body areas for liposuction was computed according to the anatomic site of the operation. The total fat aspirate was weighed on a digital scale.
All continuous data were initially analyzed by the Levene test for homogeneity and by the Kolmogorov-Smirnov test. Homogeneous and normal data were compared by Student’s t test. Otherwise, we applied the Mann-Whitney test. The main variables were also compared by Pearson bivariate correlation and multivariate analysis by ANOVA for repeated measures. The significance level was 95% and p values <0.05 were considered statistically significant. Data were presented as mean and standard deviation and standard error of mean, and inputted to the tables as such. For the continuous variable” total fat aspirate” (TFA), measured in grams, we set up a boundary of 1500g, from the calculated mean minus one standard deviation. Likewise, for the time of operation the boundary was 180 minutes.
RESULTS
RESULTS
RESULTS
RESULTS
RESULTS
Twenty-four patients were eligible for the study and four patients were excluded: three for refusal to participate in the study and one for presenting with glucose intolerance. Thus, 20 patients remained. There was no postoperative morbidity or mortality. From the data collected, the sample was divided into two groups: 1- TFA d” 1500g (N = 11); and 2- TFA > 1500g (N = 9). Demographic data, BMI and biochemical baseline are shown in table 1. Data relating to the operation are shown in Table 2, and Table 3 presents the biochemical results at the end of operation.
There was a statistically significant correlation between blood glucose and serum glucose before surgery (R = 0.51, p = 0.02). The same correlation was observed between blood glucose checked at the end of the operation by the two techniques (R = 0.55, p = 0.01). There was an increase in glycemia between the beginning and the end of the procedure (88.25 ± 12.56 mg% vs 119 ± 5.47 mg%, p <0.001). Insulin dosages also showed increased (3.23 ± 1.78 µU/l vs. 4.46 ± 0.53 µU/l, p = 0.007). The HOMA-IR showed an increase between measurements before and after surgery (0.69 ± 0.43 vs 1.25 ± 0.79 µU/l, p = 0.006), confirming increased insulin resistance (Tables 1 and 3).
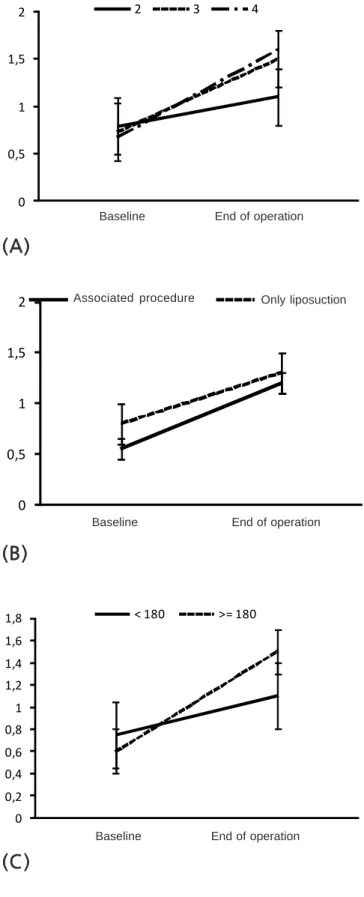
difference in HOMA-IR in regarding the number of liposuction areas (p = 0.33, ANOVA for repeated measures), duration of operation more or less than 180 minutes (p = 0.85) and the presence of an associated procedure (p = 057) (Figure 2).
DISCUSSION
DISCUSSION
DISCUSSION
DISCUSSION
DISCUSSION
The results of the study showed that liposuction triggers a significant increase in insulin resistance. Observing
the analysis of the data presented, according to the boundary of 1500 grams of fat aspirated, it was shown that the intensity of response was dependent of total fat removed. These correlations showed strength and significance, with no other variable presenting similar association, including operative time, number of body areas submitted to liposuction and associated operation.
BMI deserves special consideration, because it presents itself as a confounding bias, mainly due to being linearly correlated with the total volume of aspirated fat, which gives it the condition of marker in the analyzes
Table 1 Table 1 Table 1 Table 1
Table 1 - Clinical and biochemical baseline data.
Variable (N=20) Variable (N=20) Variable (N=20) Variable (N=20)
Variable (N=20) Mean ± standard deviationMean ± standard deviationMean ± standard deviationMean ± standard deviationMean ± standard deviation Standard errorStandard errorStandard errorStandard errorStandard error
Age (years) 31.1 ± 6.32 1.41
BMI (weight/height2) * 23.23 ± 2.25 0.5
Capillary blood glucose (mg%) 89.1 ± 15.97 3.57
Serum glucose (mg%) 88.25 ± 12.56 2.81
Serum insulin (µU/l) 3.23 ± 1.78 0.40
HOMA-IR 0.69 ± 0.44 0.009
* BMI = body mass index. HOMA-IR = Homeostasis Model Assessment
Table 2 Table 2 Table 2 Table 2
Table 2 - Intraoperative data.
V a r i a b l e V a r i a b l e V a r i a b l e V a r i a b l e
V a r i a b l e Cases(%)Cases(%)Cases(%)Cases(%)Cases(%) Mean ± standard deviationMean ± standard deviationMean ± standard deviationMean ± standard deviationMean ± standard deviation Standard errorStandard errorStandard errorStandard errorStandard error
Liposuction time (min) 20 174.80 ± 11.09 49.61
Breast prosthesis time (min) 9 (45) 63.55 ± 30.53 10.17
Number of areas aspirated (2 to 4) 20 2.28 ± 0.16 0.70
2 7 (35)
3 10 (50)
4 3 (15)
Total aspirated fat (g) 20 1777.75 979.03
Table 3 Table 3 Table 3 Table 3
Table 3 - Results of biochemical variables at the end of operation.
Variable (N = 20) Variable (N = 20) Variable (N = 20) Variable (N = 20)
Variable (N = 20) Mean ± standard deviationMean ± standard deviationMean ± standard deviationMean ± standard deviationMean ± standard deviation Standard errorStandard errorStandard errorStandard errorStandard error
Serum glucose (mg%) 119.00 ± 5.47 24.48
Serum insulin (µU/l) 4.46 ± 0.53 2.37
HOMA-IR* 1.26 ± 0.18 0.79
Capillary blood glucose (mg%) 126.02 ± 4.8 21.47
*HOMA-IR = Homeostasis Model Assessment
Table 4 Table 4 Table 4 Table 4
Table 4 - Univariate analysis of the HOMA values according to groups of total fat aspirated (TFA) d” 1500g and > 1500g.
H O M A H O M A H O M A H O M A
H O M A TFA TFA TFA TFA TFA <<<<< 1500g 1500g 1500g 1500g 1500g TFA > 1500gTFA > 1500gTFA > 1500gTFA > 1500gTFA > 1500g P *P *P *P *P * Mean ± standard deviation (N=11)
Mean ± standard deviation (N=11) Mean ± standard deviation (N=11) Mean ± standard deviation (N=11)
Mean ± standard deviation (N=11) Mean ± standard deviation (N=9)Mean ± standard deviation (N=9)Mean ± standard deviation (N=9)Mean ± standard deviation (N=9)Mean ± standard deviation (N=9)
Before operation 0.65 ± 0.3 0.75 ± 0.59 0.97
End of operation 0.90 ± 0.68 1.69 ± 0.72 0.02
performed considering the boundary of 1500g of fat removed. Actually, it would be natural to expect greater amounts of fat aspirated from patients with higher amounts of body fat, i.e., higher BMI. The sample consisted of non-obese patients, with the highest BMI being 27Kg/m2.
No patient exhibited any indicator of metabolic syndrome, which confers the normality expected in the evaluation of biochemical variables. However, when baseline HOMA values were observed in groups below and above the boundary, there were higher absolute figu-res in the group above 1500g of fat aspirated, thus suggesting an intrinsic tendency of this group to a greater organic response trauma. However, statistical analysis was not significant for baseline data and this points to the randomness of these values when relationships between data are examined, confirming the confusion. It should be noted that the standard deviation applied to baseline values averages in both groups showed clear a intersection between the two intervals, as shown in Figure 1.
In this study, we employed the HOMA-IR to measure insulin resistance. Methods for determination of insulin resistance (IR) and functional capacity of the beta cells have multiplied14-16 and can be grouped into two
models: one based on the measurement of dynamic responses to insulin and/or glucose after stimulation, the hyperinsulinemic-euglycemic clamp (HEC); and the other based static measurements of one or more plasma constituents, more often insulin, glucose, proinsulin and C peptide, represented by HOMA and QUICKI (Quantitative Insulin-Sensitivity Check Index)13. The methods inspired by
the second model, as HOMA, basically measure hepatic insulin sensitivity, estimate its peripheral sensitivity and equate data of insulin/glucose balance obtained from post-stimulus dynamic testing to infer IR levels. Because they are simplest to carry out, they improve aspects of
Figure 2 Figure 2Figure 2
Figure 2Figure 2 - Insulin resistance (HOMA-IR = Homeostasis Model Assessment) before and after liposuction according to: (A): the number of aspirated areas; (B): with or without associated surgery; and (C): time of surgery above or below 180 minutes. Data represent mean and standard deviation. p > 0.05 for all three graphs (ANOVA for repeated measures).
Figure 1 Figure 1Figure 1 Figure 1
Figure 1 - Insulin resistance (HOMA-IR = Homeostasis Model Assessment) before and after liposuction in the two independent samples of total fat aspirate (TFA), d” 1500g and > 1500g. Data represent mean and standard deviation. The percentages represent the increase in each group from the baseline data. P = 0.02 (ANOVA for repeated measures)
(B)
(B)
(B)
(B)
(B)
Baseline End of operation Associated procedure Only liposuction
(A)
(A)
(A)
(A)
(A)
Baseline End of operation
(C)
(C)
(C)
(C)
(C)
acceptability and applicability13,17 and have been validated
against the gold standard, the hyperinsulinemic-euglycemic clamp, by various authors, supporting their use11,13,17.
Postoperatively there is always insulin resistance that is proportional to the size of trauma. This phase of insulin resistance occurs throughout the peri-operative period, on average seven days, depending on the severity and maintenance of the inflammatory process. The consequences of these metabolic changes result in a catabolic state, increased blood glucose, decreased tissue oxygen supply and inhibition of the protective biological activity of the endothelium, facilitating the occurrence of infections and hampering the beginning of the healing process. When extended, it leads to protein catabolism (mainly muscles) and subsequent malnutrition, nonspecific immune deficiency and fat catabolism, with increase in ketone bodies and acidemia.
Glycemia increased by around 50% and HOMA by around 100% during the surgical time, on average. Again the increase was significantly higher when the removal of fat was more than 1500 grams. Increased insulin resistance, demonstrated by HOMA, has been considered an important prognostic factor in extended operations13,17-19. Its increase
is proportional to the incidence of morbidity and mortality related to infections and poor viability of vascular grafts19,20.
In the case of cosmetic surgery, its validity as a prognostic factor needs to be demonstrated. It could be pointed out as a secondary factor in understanding the inflammatory impact, constituting a representative of its endocrine branch and possibly related to vascular and infectious complications, as attested for other operations. In short, liposuction leads to a significant increase in insulin resistance, which is proportional to the volume of fat aspirated, without correlation with other surgical variables.
R E S U M O R E S U M O R E S U M O R E S U M O R E S U M O
Objetivo Objetivo Objetivo Objetivo
Objetivo: investigar a resistência insulínica imposta pela lipoaspiração, correlacionando sua intensidade com a extensão da opera-ção. MétodosMétodosMétodosMétodosMétodos: A amostra foi formada de 20 pacientes do sexo feminino sem comorbidades, com idade entre 21 e 43 anos, índice de massa corporal entre 19 e 27 Kg/m2, submetidas à lipoaspiração isolada ou associada à prótese de mamas. Foram coletados os
indicadores de resistência insulínica no início e término da cirurgia para o cálculo do Homeostasis Model Assessment (HOMA-IR). As variáveis operatórias foram tempo de lipoaspiração, tempo de prótese de mamas, áreas corporais lipoaspiradas e gordura total aspirada. ResultadosResultadosResultadosResultadosResultados: O tempo de lipoaspiração foi 94 a 278 min (média=174 min), tempo de prótese de mamas de 20 a 140 min (média=65 min), gordura total aspirada de 680 a 4280 g (média=1778 g). A análise estatística foi realizada por uma linha de corte de 1500 g de gordura aspirada e revelou uma resistência insulínica pelo índice de HOMA significativamente mais intensa no grupo >1500 g (aumento de 123%) em relação ao grupo d”1500 g (aumento de 53%,) a partir dos dados basais (p=0,02). As demais variáveis operatórias não apresentaram correlação significativa. ConclusãoConclusãoConclusãoConclusãoConclusão: A resistência insulínica apresenta aumento significativo na lipoaspiração, correlacionada ao volume de gordura aspirado.
Descritores: Descritores: Descritores: Descritores:
Descritores: Procedimentos cirúrgicos operatórios. Lipectomia. Tecido adiposo. Complicações intraoperatórias. Resistência à Insu-lina.
REFERENCES
REFERENCES
REFERENCES
REFERENCES
REFERENCES
1. Aguilar-Nascimento JE, Marra JG, Slhessarenko N, Fontes CJF. Eficácia do escore NNIS, proteínas de fase aguda e interleucina-6 na predição de infecções pós-operatórias em operações gastrointestinais de grande porte. Sao Paulo Med J. 2007;125 (1):34-41.
2. Cerra FB. Hypermetabolism-organ failure syndrome: a metabolic response to injury. Crit Care Clin. 1989;5(2):289-302.
3. Martìnez JL, Lorenzo y Mateos AG, Castilla MS. Respuesta infla-matória sistêmica: definiciones, marcadores inflamatórios y posibilidades terapêuticas. Med Intensiva. 2000;24(8):361-70. 4. Sheeran P, Hall GM. Cytokines in anaesthesia. Br J Anaesth.
1997;78(2):201-19.
5. Poredos P, Jezovnik MK. The role of inflammation in venous thromboembolism and de link between arterial and venous thrombosis. Int Angiol. 2007;26(4):306-11.
6. Desborough JP. The stress response to trauma and surgery. Br J Anaesth. 2000;85(1):109-17.
7. Kehlet H. Multimodal approach to control postoperative pathophysiology and rehabilitation. Br J Anaesth. 1997;78(5):606-17.
8. Cuthbertson DP. Observations on the disturbance of metabolism produced by injury to the limbs. QJM. 1932;1(2):233-46. 9. Keel M, Trentz O. Pathophysiology of politrauma. Injury.
2005;36(6):691-709.
10. Little RA, Girolami A. Trauma metabolism—ebb and flow revisited. Br J Intensive Care. 1999;9(4):142-6.
11. Li L, Messina JL. Acute insulin resistance following injury. Trends Endocrinol Metab. 2009;20(9):429-35.
12. Fonseca-Alaniz MH, Takada J, Alonso-Vale MIC, Lima FB. O tecido adiposo como centro regulador do metabolismo. Arq Bras Endocrinol Metab. 2006;50(2):216-29.
13. Oliveira EP, Souza MLA, Lima MDA. Índice HOMA (homeostasis model assessment) na prática clínica: uma revisão. J bras patol med lab. 2005;41(4):237-43.
14. Olefsky J, Farquhar JW, Reaven G. Relationship between fasting plasma insulin level and resistance to insulin-mediated glucose uptake in normal and diabetic subjects. Diabetes. 1973;22(7):507-13.
16. Bergman RN, Ider YZ, Bowden CR, Cobelli C. Quantitative estimation of insulin sensitivity. Am J Physiol. 1979;236(6):E667-77.
17. Geloneze B, Tambascia MA. Avaliação laboratorial e diagnóstico da resistência insulínica. Arq Bras Endocrinol Metab. 2006;50(2):208-15.
18. Ljunggvist O. Insulin resistance and outcomes in surgery. J Clin Endocrinol Metab. 2010;95(9):4217-9.
19. Hsueh WA, Lyon CJ, Quiñones MJ. Insulin resistance and the endothelium. Am J Med. 2004;117(2):109-17.
20. Murkin JM. Pro: tight intraoperative glucose control improves outcome in cardiovascular surgery. J Cardiothorac Vasc Anesth. 2000;14(4):475-8.
Recebido em 29/05/2012
Accepted for publication 31/07/2012 Conflict of interest: none
Source of funding: no
How to cite this article: How to cite this article:How to cite this article: How to cite this article:How to cite this article:
Oliveira SS, Cibantos JS, Ripari WT, Aguilar-Nascimento JE. Impact of the aspirated volume of fat tissue in insulin resistance after liposuction. Rev Col Bras Cir. [periódico na Internet] 2013;40(1). Disponível em URL: http://www.scielo.br/rcbc