ISSN 0100-879X
BIOMEDICAL SCIENCES
AND
CLINICAL INVESTIGATION
www.bjournal.com.br
www.bjournal.com.br
Volume 44 (7) 606-728 July 2011
Braz J Med Biol Res, July 2011, Volume 44(7) 660-665
doi: 10.1590/S0100-879X2011007500058
Characterization and analysis of the outcome of adults with acute
myeloid leukemia treated in a Brazilian University hospital over three
decades
J.T. Souto Filho, R.D. Portugal, M. Loureiro, W. Pulcheri and M. Nucci
Faculdade de Medicina de Ribeirão Preto Campus
Ribeirão Preto
Institutional Sponsors
The Brazilian Journal of Medical and Biological Research is partially financed by
analiticaweb.com.br S C I E N T I F I C Hotsite of proteomics metabolomics
Characterization and analysis of the outcome
of adults with acute myeloid leukemia treated
in a Brazilian University hospital over
three decades
J.T. Souto Filho, R.D. Portugal, M. Loureiro, W. Pulcheri and M. Nucci
Hospital Universitário Clementino Fraga Filho, Universidade Federal do Rio de Janeiro, Rio de Janeiro, RJ, Brasil
Abstract
We evaluated the outcome of 227 patients with acute myeloid leukemia during three decades (period 1 - 1980’s, N = 89; period 2 - 1990’s, N = 73; period 3 - 2000’s, N = 65) at a single institution. Major differences between the three groups included a higher median age, rates of multilineage dysplasia and co-morbidities, and a lower rate of clinical manifestations of advanced leukemia in recent years. The proportion of patients who received induction remission chemotherapy was 66, 75, and 85% for periods 1, 2, and 3, respectively (P = 0.04). The median survival was 40, 77, and 112 days, and the 5-year overall survival was 7, 13, and 22%, respectively (P = 0.01). The median disease-free survival was 266, 278, and 386 days (P = 0.049). Survival expectation for patients with acute myeloid leukemia has substantially improved during this 30-year period, due to a combination of lower
tumor burden and a more efficient use of chemotherapy and supportive care.
Key words: Acute myeloid leukemia; Survival; Prognosis
Introduction
Correspondence: M. Nucci, Rua Prof. Rodolpho Paulo Rocco, 255, 4A 12, 21941-913 Rio de Janeiro, RJ, Brasil. Fax: +55-21-2562-2460. E-mail: [email protected]
Received November 11, 2010. Accepted April 18, 2011. Available online May 13, 2011. Published July 25, 2011. Over the past three decades, the outcome of patients
with acute myeloid leukemia (AML) has improved with the incorporation of intensive induction and post-remission treat-ment, including allogeneic and autologous hematopoietic stem cell transplantation (HCT), and improvements in sup-portive care (1-3). However, while randomized clinical trials have reported high long-term survival rates, the results of population-based studies have shown long-term remissions in a quarter of patients only (4-7). Furthermore, retrospective studies performed in developing countries have reported even lower overall survival rates (8-13).
Fifteen years ago, our group reported the treatment and outcome of AML at our institution, and discussed several reasons for the low remission and survival rates observed,
including poor hospital convenience, health system defi -ciency, patients’ poor socioeconomic background, and
dif-ferent biological aspects of AML. A remarkable finding was
that ~40% of patients did not receive any chemotherapy because of very poor general conditions, and this was the main reason for the poor results achieved (14).
In order to confirm recent improvements in treatment
outcomes, we retrospectively reviewed the clinical charac-teristics, treatment and outcome of all patients with a diag-nosis of AML admitted to Hospital Universitário Clementino Fraga Filho, Universidade Federal do Rio de Janeiro, over the past 30 years.
Material and Methods
This retrospective cohort study included all patients diagnosed with AML at Hospital Universitário Clementino Fraga Filho, Universidade Federal do Rio de Janeiro, Bra-zil, from January 1979 to December 2008. Patients were
identified from hospital medical records and the Hematology
Service registry. Patients with acute promyelocytic leukemia (APL) and those previously treated at other institutions were excluded. The study was approved by the Hospital Univer-sitário Clementino Fraga Filho Ethics Committee.
The diagnosis of AML was based on procedures avail-able at the time, including bone marrow aspiration and biopsy, and cytogenetic and immunophenotype analyses.
Survival in acute myeloid leukemia 661
(FAB) criteria (15). For the purpose of this study we reviewed
the slides for FAB classification and for the detection of
the presence of multilineage dysplasia. The treatment approach varied between time periods; for the purpose of
the present analysis, treatment was classified as
curative-intent (when standard induction was given), palliative-curative-intent (other regimens), and no chemotherapy. Standard remission induction was based on treatment with cytarabine plus an anthracycline in most patients. Until 1985, the regimen consisted of 100 mg/m2 thioguanine administered orally
every 12 h on days 1 to 7, 100 mg·(m2)-1·day-1 cytarabine administered by continuous intravenous infusion on days 1 to 7, and 30 mg/m2 doxorubicin on days 1 to 3 (TAD). After
1985, induction was changed to 200 mg·(m2)-1·7 days-1
cytarabine plus an anthracycline for 3 days, either 45 mg/ m2 daunorubicin or 30 mg/m2 doxorubicin (7+3). Patients with residual leukemia at day 14 received a similar but shorter second induction course [cytarabine for 5 days + anthracycline for 2 days (5+2)]. Post-remission treatment evolved from 12 maintenance cycles in the early TAD pe-riod to 4 courses of infusional cytarabine (400 mg/m2 plus 30 mg/m2 doxorubicin on days 1 to 3) until 1992, then to
2-4 courses of high-dose cytarabine (1 g/m2 every 12 h on
days 1 to 4 and 30 mg/m2 doxorubicin on days 1 to 3), and finally, after 1999, to 2-4 cycles of high-dose cytarabine (3
g/m2 every 12 h on days 1, 3, and 5).
Complete remission (CR), treatment failure and relapse
were defined according to the International Working Group
for AML (16) and the recommendations from an
interna-tional expert panel (17). Briefly, CR required <5% blasts
to be present in a bone marrow aspirate sample, with an
absolute neutrophil count >1000/μL and a platelet count >100,000/μL.
Overall survival (OS) was calculated from the diagnosis of AML until the date of death or last follow-up. Disease-free survival (DFS) applies only to patients who obtained CR, and was calculated from the time of CR assessment to the date of relapse, last follow-up or death.
We divided the 30-year period into three parts: 1980’s (period 1), 1990’s (period 2), and 2000’s (period 3). The following parameters were compared between the three periods: age, gender, FAB subgroup, multilineage dysplasia, presence of co-morbidities (diabetes, cardiac, lung, liver, and renal disease), clinical manifestations at presentation (fever, gingival hyperplasia, lymphadenopathy, hepatomegaly, splenomegaly, bleeding, disseminated intravascular
coagu-lation, and lung, skin or central nervous system infiltration by leukemia), infection before treatment (classified as oral/
oropharyngeal, gastrointestinal, cutaneous, pulmonary, sinusal, urinary, bloodstream, or fever of unknown origin), and baseline laboratory tests (leukocyte and platelet count, serum hemoglobin and lactate dehydrogenase).
Dichotomous variables were compared by the Fisher exact test or the chi-square test, and continuous variables were compared by the Kruskal-Wallis test. Actuarial curves
of OS and DFS were constructed using the Kaplan-Meier method, and compared by the log-rank test. Predictors of outcome (OS) were assessed by Cox regression analysis, and the results are reported as hazard ratio (HR) with the
corresponding 95% confidence interval (95%CI). Variables with P value <0.1 by univariate analysis were entered in
multivariate analysis. P values were two-sided, and were
considered to be statistically significant with values <0.05.
All statistical analyses were performed using the SPSS 11.0 software (SPSS Inc., USA, 1989-2001).
Results
Of 295 patients with AML identified in hospital records,
68 were excluded for the following reasons: 52 with APL, 11 with biphenotypic leukemia, and 3 previously treated at other institutions. Among the remaining 227 patients, 125 were males. The median age was 45 years (range 12-91), and 25% were >60 years old. The most common FAB subtypes were M4 and M2 (27 and 22.5%, respectively). AML with multilineage dysplasia was present in 18.5% of patients.
Fifty-eight patients (25.5%) did not receive treatment. Among the 169 patients receiving remission induction che-motherapy, 75% were treated with cytarabine in continuous infusion for 7 days plus an anthracycline for 3 days (7+3 regi-men), 15% received TAD and 10% received other regimens. Fifteen patients died before day 14 of remission induction and were not assessed for response to chemotherapy. Among the remaining 154, CR was achieved in 88 (57.1% of patients receiving remission induction), after a single course of induction in 72, and after a second course in 16 (5+2 regimen). The median time (days) to achieve >1000
neutrophils/μL and >100,000 platelets/μL was 27 (range
4-153) and 28 (range 9-104) days, respectively.
Among the 88 patients who obtained CR, 5 received an autologous HCT, 10 received allogeneic HCT and 70 re-ceived post-induction chemotherapy (1 cycle in 15 patients,
2 cycles in 37, 3 cycles in 6, and ≥4 cycles in 12).
The median survival of the 227 patients was 55 days (range 28-82). Among treated patients, the median survival was 147 days (range 54-239). The 3- and 5-year OS was 14 and 13%, respectively, for all patients, and 18 and 17%, respectively, for treated patients. The majority of deaths oc-curred among non-responders and relapsed patients (60%), followed by deaths during the induction phase (30%), and
among patients in CR (10%). Stratified according to these
three groups, infection was the leading cause of death (51, 72 and 77%). Other causes were bleeding (9, 15, and 0%) and treatment-related toxicity (0, 3, and 7%).
Comparative analysis of three decades
(and, as a consequence, a higher rate of co-morbidities in recent years). By contrast, in recent years the rate of clinical manifestations of advanced leukemia, such as he-patosplenomegaly, bleeding, fever, documented infection, and baseline leukocyte count was lower.
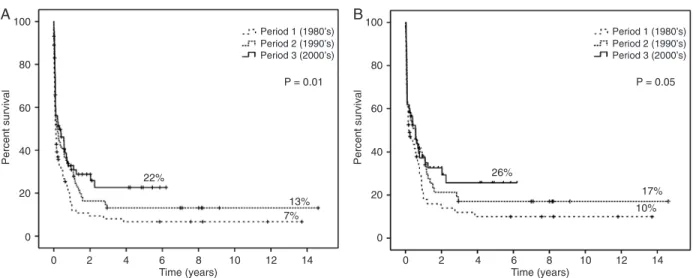
The proportion of patients receiving treatment increased over time (66, 75, and 85% during periods 1, 2, and 3). Like-wise, the proportion of patients undergoing HCT increased (zero, 7, and 20% of patients receiving treatment during periods 1, 2, and 3). The median survival during periods 1,
2, and 3 was 40, 77, and 112 days, respectively, and the 5-year OS was 7, 13, and 22%, respectively (P = 0.01; Figure 1A). Among treated patients (N = 169) the median survival was 68, 205, and 208 days, respectively, and the 5-year OS was 10, 17, and 26%, respectively (P = 0.05; Figure 1B). The median DFS for all patients in CR (N = 88) was 308 days (range 244-371), and the 5-year DFS was 29%. The median DFS per period was 266 days during period 1, 278 during period 2, and 386 days during period 3, and the 5-year DFS was 13, 21, and 44%, respectively (P = 0.049;
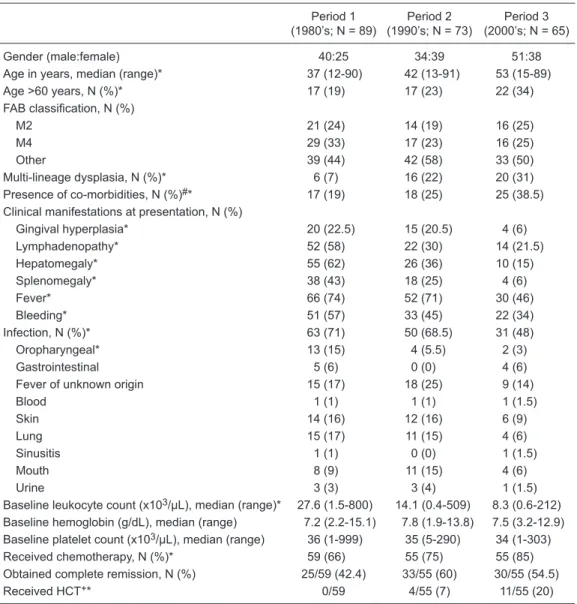
Table 1. Characteristics of 227 patients with acute myeloid leukemia stratified by decade of diagnosis.
Period 1 (1980’s; N = 89)
Period 2 (1990’s; N = 73)
Period 3 (2000’s; N = 65)
Gender (male:female) 40:25 34:39 51:38
Age in years, median (range)* 37 (12-90) 42 (13-91) 53 (15-89)
Age >60 years, N (%)* 17 (19) 17 (23) 22 (34)
FAB classification, N (%)
M2 21 (24) 14 (19) 16 (25)
M4 29 (33) 17 (23) 16 (25)
Other 39 (44) 42 (58) 33 (50)
Multi-lineage dysplasia, N (%)* 6 (7) 16 (22) 20 (31) Presence of co-morbidities, N (%)#* 17 (19) 18 (25) 25 (38.5) Clinical manifestations at presentation, N (%)
Gingival hyperplasia* 20 (22.5) 15 (20.5) 4 (6)
Lymphadenopathy* 52 (58) 22 (30) 14 (21.5)
Hepatomegaly* 55 (62) 26 (36) 10 (15)
Splenomegaly* 38 (43) 18 (25) 4 (6)
Fever* 66 (74) 52 (71) 30 (46)
Bleeding* 51 (57) 33 (45) 22 (34)
Infection, N (%)* 63 (71) 50 (68.5) 31 (48)
Oropharyngeal* 13 (15) 4 (5.5) 2 (3)
Gastrointestinal 5 (6) 0 (0) 4 (6)
Fever of unknown origin 15 (17) 18 (25) 9 (14)
Blood 1 (1) 1 (1) 1 (1.5)
Skin 14 (16) 12 (16) 6 (9)
Lung 15 (17) 11 (15) 4 (6)
Sinusitis 1 (1) 0 (0) 1 (1.5)
Mouth 8 (9) 11 (15) 4 (6)
Urine 3 (3) 3 (4) 1 (1.5)
Baseline leukocyte count (x103/μL), median (range)* 27.6 (1.5-800) 14.1 (0.4-509) 8.3 (0.6-212) Baseline hemoglobin (g/dL), median (range) 7.2 (2.2-15.1) 7.8 (1.9-13.8) 7.5 (3.2-12.9) Baseline platelet count (x103/μL), median (range) 36 (1-999) 35 (5-290) 34 (1-303) Received chemotherapy, N (%)* 59 (66) 55 (75) 55 (85) Obtained complete remission, N (%) 25/59 (42.4) 33/55 (60) 30/55 (54.5)
Received HCT+* 0/59 4/55 (7) 11/55 (20)
Data are reported as median (range) or number (%). FAB classification = French-American-British classifica
-tion; HCT = hematopoietic cell transplantation. *P < 0.05 for the comparison of periods 1, 2, and 3 (chi-square
Survival in acute myeloid leukemia 663
Figure 2). Since there was a significant difference in the
proportion of patients undergoing HCT during the 3 periods, we re-ran the analysis excluding those patients. There were
no significant difference in OS (P = 0.224) and DFS (P =
0.512) when the three periods were compared.
Prognostic factors
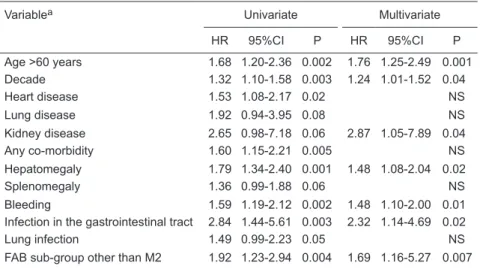
As shown in Table 2, variables significantly associated
with poor outcome (overall survival) by multivariate analysis were age >60 years (HR = 1.76, 95%CI = 1.25-2.49), decade of treatment (HR = 1.24, 95%CI = 1.01-1.52), concomitant kidney disease (HR = 2.84, 95%CI = 1.05-7.89), baseline hepatomegaly (HR = 1.48, 95%CI = 1.08-2.04), bleeding (HR = 1.48, 95%CI = 1.10-2.00), infection in the gastrointes-tinal tract (HR = 2.32, 95%CI = 1.14-4.69), and FAB subtype other than M2 (HR = 1.69, 95%CI = 1.16-5.27).
Discussion
Our study shows that some characteristics of adult patients with AML have changed over the past 3 decades, with a higher proportion of older patients, with co-morbidities and multilineage dysplasia. The higher proportion of elderly patients is expected as a consequence of the increasing longevity of the population (18). Indeed, in Rio de Janeiro, during the same period there was an increase of people more than 60 years old, from 8.7% in the 1980’s to 11.2% in the 1990’s, and 12.8% in the 2000’s (19). Furthermore, AML in the elderly is associated with several biological and clinical features, including a high frequency of co-morbidities and multilineage dysplasia, as observed in our cohort (20).
In addition, despite the higher incidence of these char-acteristics, the outcome improved over time. This could
be a reflection of a lower disease burden, as observed by
the lower frequency of lymphadenopathy, hepatomegaly,
splenomegaly, fever, bleeding, and infection at diagnosis, as well as the median leukocyte count at baseline. In a previous report from our group, 37% of patients with AML were too sick at diagnosis to receive any treatment (14). In the present study, we observed that the proportion of patients receiving treatment increased ~10% per decade: 66% in the 1980’s, 75% in the 1990’s, and 85% in the 2000’s. Taken together, the increased proportion of patients being treated and the lower tumor burden on admission suggest that the primary health care system of Brazil has generally improved.
Moreover, the 5-year overall survival may have improved not simply as a consequence of a higher proportion of pa-tients receiving chemotherapy, since there was a trend for an increased OS among treated patients (from 10% in the
Figure 1. Overall survival as a function of decade of diagnosis. A, All patients; B, treated patients.
1980’s to 26% in the 2000’s). The most significant improve -ment in the outcome can be appreciated in the 5-year DFS curve. In the 2000’s, DFS was three times higher than that of the 1980’s (44 vs 13%). This is probably a result of better
consolidation or intensification employed more recently,
including HCT, as well as progresses in supportive care,
since there were no significant differences in the rates of
complete remission (42.4% in the 1980’s, 60% in the 1990’s, and 54.5% in the 2000’s). Indeed, when we excluded pa-tients undergoing HCT, the differences in OS and DFS were
much lower, and lacked statistical significance.
The multivariate analysis of prognostic factors showed
that decade was significantly associated with the outcome. This, most probably, reflects a combination of elements
related to diagnosis and treatment: effective induction treat-ment, higher proportion of treated patients, intensive post-remission therapy, better management of chemotherapy-induced toxicity, appropriate use of antimicrobial agents, development of autologous and allogeneic transplantation, and progresses in overall supportive care (4,9,18,21).
Among the other variables, age has proved to be an
important prognostic factor in many studies (4,22-25). In addition, AML with multilineage dysplasia has been associ-ated with a poor prognosis. In our analysis, this variable
was not significant by multivariate analysis, probably due
to a strong correlation between multilineage dysplasia and older age (26).
Other prognostic factors identified in our analysis have
been reported in other studies as important predictors of outcome, including kidney disease (23,27,28), hepato-megaly (29), and bleeding (30). The presence of the FAB M2 subgroup was protective, possibly as a consequence of
the relationship between FAB M2 subgroup and well-defined
prognostic factors such as t(8;21) translocation (31), and a lower frequency of FLT3 mutations (32).
The present study suffers from the limitations of retro-spective studies, especially the lack and inconsistency of data collected from patients’ charts, without a prospectively collected case report form. In addition, the analysis of prog-nostic factors is hampered by the fact that cytogenetics, an important prognostic factor in AML (33,34), was performed in a minority of patients from this cohort.
References
1. Estey E, Dohner H. Acute myeloid leukaemia. Lancet 2006; 368: 1894-1907.
2. Milligan DW, Grimwade D, Cullis JO, Bond L, Swirsky D, Crad
-dock C, et al. Guidelines on the management of acute myeloid
leukaemia in adults. Br J Haematol 2006; 135: 450-474.
3. Tallman MS, Gilliland DG, Rowe JM. Drug therapy for acute
myeloid leukemia. Blood 2005; 106: 1154-1163.
4. Derolf AR, Kristinsson SY, Andersson TM, Landgren O, Dick-man PW, Bjorkholm M. Improved patient survival for acute myeloid leukemia: a population-based study of 9729 patients diagnosed in Sweden between 1973 and 2005. Blood 2009; 113: 3666-3672.
Table 2. Univariate and multivariate analysis of factors associated with poor outcome (overall survival).
Variablea Univariate Multivariate
HR 95%CI P HR 95%CI P
Age >60 years 1.68 1.20-2.36 0.002 1.76 1.25-2.49 0.001 Decade 1.32 1.10-1.58 0.003 1.24 1.01-1.52 0.04
Heart disease 1.53 1.08-2.17 0.02 NS
Lung disease 1.92 0.94-3.95 0.08 NS
Kidney disease 2.65 0.98-7.18 0.06 2.87 1.05-7.89 0.04
Any co-morbidity 1.60 1.15-2.21 0.005 NS
Hepatomegaly 1.79 1.34-2.40 0.001 1.48 1.08-2.04 0.02
Splenomegaly 1.36 0.99-1.88 0.06 NS
Bleeding 1.59 1.19-2.12 0.002 1.48 1.10-2.00 0.01 Infection in the gastrointestinal tract 2.84 1.44-5.61 0.003 2.32 1.14-4.69 0.02
Lung infection 1.49 0.99-2.23 0.05 NS
FAB sub-group other than M2 1.92 1.23-2.94 0.004 1.69 1.16-5.27 0.007
HR = hazard ratio; 95%CI = 95% confidence interval; FAB = French-American-British clas
Survival in acute myeloid leukemia 665
5. Pulte D, Gondos A, Brenner H. Improvements in survival of
adults diagnosed with acute myeloblastic leukemia in the early 21st century. Haematologica 2008; 93: 594-600. 6. Seo T, Fukushima T, Inoue H, Imamura S, Urasaki Y, Yoshida
A, et al. Long-term follow-up of the clinical efficacy of che -motherapy for acute myeloid leukemia at a single institute. J Infect Chemother 2001; 7: 156-162.
7. Xie Y, Davies SM, Xiang Y, Robison LL, Ross JA. Trends in leukemia incidence and survival in the United States (1973-1998). Cancer 2003; 97: 2229-2235.
8. Pagnano KB, Traina F, Takahashi T, Oliveira GB, Rossini
MS, Lorand-Metze I, et al. Conventional chemotherapy for acute myeloid leukemia: a Brazilian experience. Sao Paulo Med J 2000; 118: 173-178.
9. Luke C, Nguyen AM, To B, Seshadri R, Hughes T, Bardy P, et al. Myeloid leukaemia treatment and survival - the South Australian experience, 1977 to 2002. Asian Pac J Cancer Prev 2006; 7: 227-233.
10. Rego MF, Pinheiro GS, Metze K, Lorand-Metze I. Acute leu -kemias in Piaui: comparison with features observed in other regions of Brazil. Braz J Med Biol Res 2003; 36: 331-337.
11. Fagundes EM, Rocha V, Gloria AB, Clementino NC, Quintao JS, Guimaraes JP, et al. De novo acute myeloid leukemia in adults younger than 60 years of age: socioeconomic aspects and treatment results in a Brazilian university center. Leuk Lymphoma 2006; 47: 1557-1564.
12. Capra M, Vilella L, Pereira WV, Coser VM, Fernandes MS,
Schilling MA, et al. Estimated number of cases, regional distribution and survival of patients diagnosed with acute
myeloid leukemia between 1996 and 2000 in Rio Grande
do Sul, Brazil. Leuk Lymphoma 2007; 48: 2381-2386. 13. Bittencourt R, Fogliato L, Daudt L, Bittencourt HNS,
Frieder-ich JR, Fernandes F, et al. Leucemia mielóide aguda: perfil
de duas décadas do Serviço de Hematologia do Hospital das Clínicas de Porto Alegre - RS. Rev Bras Hematol He-moter 2003; 25: 17-24.
14. Pulcheri W, Spector N, Nucci M, de Morais JC, Pimenta G,
de Oliveira HP. The treatment of acute myeloid leukemia in Brazil: progress and obstacles. Haematologica 1995; 80: 130-135.
15. Bennett JM, Catovsky D, Daniel MT, Flandrin G, Galton DA, Gralnick HR, et al. Proposed revised criteria for the clas
-sification of acute myeloid leukemia. A report of the French-American-British Cooperative Group. Ann Intern Med 1985; 103: 620-625.
16. Cheson BD, Bennett JM, Kopecky KJ, Buchner T, Willman CL, Estey EH, et al. Revised recommendations of the
In-ternational Working Group for Diagnosis, Standardization
of Response Criteria, Treatment Outcomes, and Reporting Standards for Therapeutic Trials in Acute Myeloid Leukemia. J Clin Oncol 2003; 21: 4642-4649.
17. Dohner H, Estey EH, Amadori S, Appelbaum FR, Buchner T, Burnett AK, et al. Diagnosis and management of acute my-eloid leukemia in adults: recommendations from an interna-tional expert panel, on behalf of the European LeukemiaNet. Blood 2010; 115: 453-474.
18. Alibhai SM, Leach M, Minden MD, Brandwein J. Outcomes and quality of care in acute myeloid leukemia over 40 years. Cancer 2009; 115: 2903-2911.
19. Prefeitura do Rio de Janeiro. População em números ab-solutos e percentuais, por ano, segundo grupos de idade
- 1940/2000. http://portalgeo.rio.rj.gov.br. Accessed January 30, 2011.
20. Rodrigues CA, Chauffaille ML, Pelloso LA, Ghaname FS, Kerbauy DM, Campos MG, et al. Acute myeloid leukemia in
elderly patients: experience of a single center. Braz J Med Biol Res 2003; 36: 703-708.
21. Andersson TM, Lambert PC, Derolf AR, Kristinsson SY, Eloranta S, Landgren O, et al. Temporal trends in the pro-portion cured among adults diagnosed with acute myeloid leukaemia in Sweden 1973-2001, a population-based study. Br J Haematol 2010; 148: 918-924.
22. Lerch E, Espeli V, Zucca E, Leoncini L, Scali G, Mora O,
et al. Prognosis of acute myeloid leukemia in the general population: data from southern Switzerland. Tumori 2009; 95: 303-310.
23. Astrom M, Bodin L, Nilsson I, Tidefelt U. Treatment, long-term outcome and prognostic variables in 214 unselected AML patients in Sweden. Br J Cancer 2000; 82: 1387-1392.
24. Estey E, Smith TL, Keating MJ, McCredie KB, Gehan EA,
Freireich EJ. Prediction of survival during induction therapy in patients with newly diagnosed acute myeloblastic leuke-mia. Leukemia 1989; 3: 257-263.
25. Wahlin A, Hornsten P, Jonsson H. Remission rate and survival in acute myeloid leukemia: impact of selection and chemotherapy. Eur J Haematol 1991; 46: 240-247. 26. Weinberg OK, Seetharam M, Ren L, Seo K, Ma L, Merker
JD, et al. Clinical characterization of acute myeloid leukemia
with myelodysplasia-related changes as defined by the 2008 WHO classification system. Blood 2009; 113: 1906-1908. 27. Chen CC, Yang CF, Yang MH, Lee KD, Kwang WK, You
JY, et al. Pretreatment prognostic factors and treatment outcome in elderly patients with de novo acute myeloid leukemia. Ann Oncol 2005; 16: 1366-1373.
28. Kantarjian H, O’Brien S, Cortes J, Giles F, Faderl S, Jab -bour E, et al. Results of intensive chemotherapy in 998 patients age 65 years or older with acute myeloid leukemia or high-risk myelodysplastic syndrome: predictive prognostic models for outcome. Cancer 2006; 106: 1090-1098. 29. Wells RJ, Arthur DC, Srivastava A, Heerema NA, Le Beau
M, Alonzo TA, et al. Prognostic variables in newly diagnosed children and adolescents with acute myeloid leukemia:
Children’s Cancer Group Study 213. Leukemia 2002; 16: 601-607.
30. Chen CY, Tai CH, Tsay W, Chen PY, Tien HF. Prediction of fatal intracranial hemorrhage in patients with acute myeloid leukemia. Ann Oncol 2009; 20: 1100-1104.
31. Anonymous. Acute myelogenous leukemia with an 8;21
translocation. A report on 148 cases from the Groupe
Francais de Cytogenetique Hematologique. Cancer Genet Cytogenet 1990; 44: 179.
32. Thiede C, Steudel C, Mohr B, Schaich M, Schakel U, Platz-becker U, et al. Analysis of FLT3-activating mutations in 979 patients with acute myelogenous leukemia: association
with FAB subtypes and identification of subgroups with poor
prognosis. Blood 2002; 99: 4326-4335.
33. Mrozek K, Heerema NA, Bloomfield CD. Cytogenetics in
acute leukemia. Blood Rev 2004; 18: 115-136.