GROWTH AND YIELD OF CORN IRRIGATED
WITH SALINE WATER
Flávio Favaro Blanco1*; Marcos Vinícius Folegatti2; Hans Raj Gheyi3; Pedro Dantas Fernandes3
1
Embrapa Meio Norte, Av. Duque de Caxias, 5650 - 64006-220, Teresina, PI - Brasil.
2
USP/ESALQ - Depto. de Engenharia Rural, C.P. 9 - 13418-900 - Piracicaba, SP - Brasil.
3
UFCG/CCT - Depto. de Engenharia Agrícola, C.P. 10087 - 58109-970 - Campina Grande, PB - Brasil. *Corresponding author <[email protected]>
ABSTRACT: Corn (Zea mays L.) is an important crop in Brazil and is cultivated in all regions, including
the semi-arid area of Brazil, where the occurrence of irrigation water with high concentration of salts is common. Evaluating the growth and yield of the maize hybrid ‘AG 6690’ irrigated with water of different salinity levels was the objective of this experiment. Sowing was performed in pots with 12 seeds on May 23, 2003, and seedlings were thinned to two plants per pot. Irrigation was accomplished when the mean soil matric potential of each treatment was approximately –30 kPa using water with seven different electrical conductivities (ECi), varying from 0.3 to 4.5 dS m–1, which were obtained by addition of NaCl and CaCl2 in the equivalent proportion of 1:1. The dry weights of all parts of the corn plants as well as their evapotranspiration and water use efficiency were reduced by salinity. Grain yield decreased by 21 and 20% for each unit increase of ECi and electrical conductivity of soil solution (ECs) above the respective threshold values of 1.7 and 4.3 dS m–1
, respectivelly. Plants were able to maintain the leaf area index unaltered under moderate saline conditions.
Key words: Zea mays L., tolerance to salinity, soil solution, leaf area, evapotranspiration
CRESCIMENTO E PRODUÇÃO DO MILHO IRRIGADO
COM ÁGUA SALINA
RESUMO: O milho (Zea mays L.) é uma importante cultura no Brasil, sendo cultivado em todas as
regiões, incluindo a região do semi-árido, onde é comum a ocorrência de águas com alta concentração de sais. Avaliar o crescimento e a produção do milho, híbrido ‘AG 6690’, irrigado com águas de diferentes níveis de salinidade foi o objetivo deste trabalho. O plantio foi realizado em vasos com 12 sementes por vaso, em 23 de maio de 2003, e realizado o desbaste deixando-se apenas duas plantas por vaso. A irrigação foi realizada sempre que o potencial mátrico médio do solo de cada tratamento aproximava-se de –30 kPa, utilizando-se águas com sete diferentes condutividades elétricas (ECi) variando entre 0,3 e 4,5 dS m–1, as quais foram alcançadas pela adição de NaCl e CaCl
2 na proporção equivalente de 1:1. O peso seco de todas as partes da planta foi reduzido pela salinidade, assim como a evapotranspiração e a eficiência de uso de água. A produção reduziu por 21 e 20% para cada aumento unitário de ECi e ECs (condutividade elétrica da solução do solo) acima dos valores limiares de 1,7 e 4,3 dS m–1
, respectivamente. As plantas foram capazes de manter a área foliar constante sob condições de salinidade moderada.
Palavras-chave: Zea mays L., tolerância à salinidade, solução do solo, área foliar, evapotranspiração
INTRODUCTION
Corn is one of the most important crops in the Brazilian Northeast agriculture, where the irrigation is required throughout the year, mainly in semi-arid ar-eas. The waters used for irrigation in these areas, es-pecially well waters, are frequently saline and/or alka-line, with high concentration of Cl– and, to a lesser ex-tent, Na+ (Medeiros et al., 2003; Cruz et al., 2003).
The first effect of salts is reducing the ability of plants to absorb water (osmotic effect), which leads
to slower growth; second, salts may enter the tran-spiration stream and injure leaf cells, further reducing growth (Munns, 2005). The high concentration of Na+ and Cl– in soil solution is generally the main cause of the saline stress (Hasegawa et al., 2000) and the con-sequent slower growth is an adaptive feature for plant survival because it allows plants to rely on multiple re-sources to combat stress.
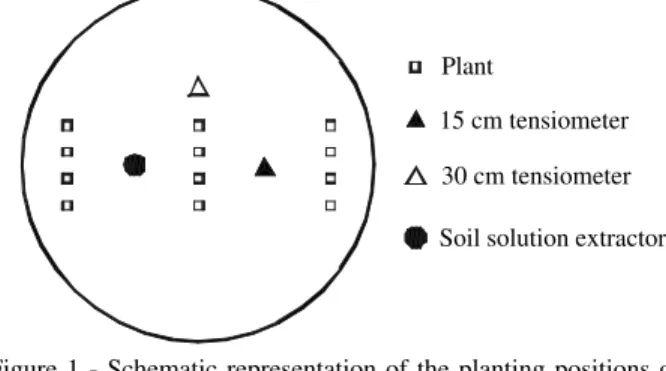
Plant
15 cm tensiometer
Soil solution extractor 30 cm tensiometer
c c 0
c c c ) c -s(c -1
c c 0 1 Yr
0 0 t
t
t
> ≤ <
≤ ≤
= (1)
where Yr is the relative yield, c is the mean salinity (electrical conductivity) in the root zone during the cultivation period (dS m–1
), ct is the salinity threshold value (dS m–1), c
0 is the salinity beyond which the yield is zero (dS m–1) and s is the absolute value of the slope of the response function between ct and c0.
Studies related to salinity tolerance of corn in Brazil are scarce. The present study was carried out with the objective of evaluating the growth and yield of the corn hybrid ‘AG 6690’, irrigated with water of different salinities.
MATERIAL AND METHODS
The experiment was conducted in a greenhouse covered with polyethylene film and closed with anti-aphid screen, located in Piracicaba, SP, Brazil (22º43’ S, 47º38’ W). Solar radiation, temperature and rela-tive humidity were measured with an automatic weather station (Campbell Sci., model CR10) located in the center of the greenhouse.
The corn hybrid ‘AG 6690’ (three-way cross hybrid) was sown in 60 L pots, with diameter of 0.35 m at the top and 0.60 m height, containing a sandy loamy Typic Hapludox collected from the 0–0.3 m layer. Perforations were made in the bottom of the pots and a gravel layer of 3 cm, covered with a polypro-pylene sheet, were added to allow the drainage of the excess water. The pots were placed 0.5 × 1.0 m apart, considering their centers. The planting of the corn was accomplished in the spacing of 0.15 m among plants, with four seeds in each sowing position. Thus, 12 seeds of corn were sown in each pot at 2 cm depth, on May 23, 2003 (Figure 1). Seedlings were thinned out 20 days after sowing (DAS) and only three seed-lings were left. A second thinning was accomplished
at 39 DAS and two seedlings were left giving an equivalent planting density of 40,000 plants ha–1.
Treatments were composed of seven levels of electrical conductivity of the irrigation water (ECi of 0.3, 1.0, 1.7, 2.4, 3.1, 3.8 and 4.5 dS m–1
), which were obtained by the addition of NaCl and CaCl2 in the equivalent proportion of 1:1 in tap water (ECi = 0.3 dS m–1). A completely randomized block design with a single factor (ECi) was used with three repli-cations, totaling 21 pots, each one composed of two plants.
Two tensiometers (0.15 and 0.30 m depth) and one soil solution extractor (0.15 m depth) were in-stalled in each pot for irrigation control and monitor-ing of Ecs. Previously the soil had been cultivated with corn, in an experiment to evaluate the effects of sa-linity of the irrigation water on germination and initial development of the plants, and the salts were not leached after that because in the present study the ger-mination and seedling growth were also determined to confirm the results of the earlier trial; thus the electri-cal conductivity of the soil solution (ECs) at planting was 0.9, 1.7, 3.5, 3.9, 4.3, 5.6 and 6.1 dS m–1, re-spectively, for the ECi of 0.3, 1.0, 1.7, 2.4, 3.1, 3.8 and 4.5 dS m–1.
All irrigations of each pot were accomplished with water of ECi corresponding to the respective treatment. The pots were irrigated with 5 L of water at planting, and received 20 g of monoamonium phos-phate and 3.3 g of potassium chloride, which were applied with the irrigation water. At 40 and 80 DAS, 6.7 g of ammonium sulfate and 4.7 g of potassium chloride were applied per pot also through irrigation water.
Irrigations were accomplished whenever the mean soil matric potential approached –30 kPa, the water being applied manually to each pot without wet-ting the leaves. The water depth was calculated based on the water retention curve of the soil (Blanco, 2004); the water depth applied was equivalent to allow a leach-ing fraction of 0.20 in all irrigation events, in order to maintain a better distribution of salts and to prevent excessive accumulation of the salts concentration in the soil profile. The irrigation frequency varied within the treatments due to the evapotranspiration reduction with increase of ECi, with mean of 8.7 and 13.6 days for waters of 0.3 and 4.5 dS m–1, respectively.
Soil solution was collected at the beginning of the experimental period and at 31, 45 and 64 DAS, when the plants reached the flowering stage, and ECs was de-termined. Vacuum of about –70 kPa was applied after irrigation, when the soil matric potential was close to field capacity (–6 kPa) and soil solution was removed from the extractor 24 h after vacuum was applied. Figure 1 - Schematic representation of the planting positions of
Leaf area was estimated at 39 DAS; all leaves of all plants were measured and the leaf area was es-timated by multiplying the product of length (L) and width (W) of respective leaf with a correction factor of 0.743 (Stewart & Dwyer, 1999).
Evapotranspiration (ET) was estimated daily from the tensiometer readings and the soil water re-tention curve:
125
7 = d
d ET =
ET
∑
(2)ETd = ∆S15 + ∆S30 / Nd (3)
where ETd is the daily evapotranspiration of one plant on d DAS; ∆S15 and ∆S30 are the changes in water storage for the 0–15 and 0 –30 cm layers, respectively, on d DAS, and N is the number of plants in each pot on d DAS. For the days with irrigation, the ∆S was calculated considering that the soil water content af-ter waaf-tering was elevated to field capacity (θ = 0.28 cm3 cm–3).
Plant height was determined at 60 DAS by ex-tending the leaves upwards and the maximum distance between soil surface and leaf tip was measured.
Harvest was performed at 150 DAS, when plants were completely dry. Plants were cut near the soil surface and grains, cob, straw and leaf + stem were dried at 60ºC for 72 h and the dry weight was recorded. Grain yield was estimated by adjusting the grain moisture to 13% and the harvest index (HI) was calculated by dividing the dry weight of grains by the total dry weight of the plant. The water use efficiency (WUE) was calculated by the ratio between the grain yield and ET. The dry weight of seedlings pruned at 39 DAS was also determined and the absolute (AGR)
and relative (RGR) growth rates were calculated as suggested by Benincasa (1988):
AGR = (D2 –D1 / (T2 –T1) (4)
and
RGR = [ln (D2) – ln (D1)] / (T2 –T1) (5) where D1 and D2 are the average dry weights (g) for the first (39 DAS) and second (150 DAS) collections, respectively, and T1 and T2 are the sampling times for each growing period.
The analysis of variance was accomplished accordingly to Nogueira (1997) and, for variables with significant response to ECi, the tolerance to salinity was determined using the software SALT (Genuchten, 1983), which makes the adjustment of the regression model by the piecewise linear regression method.
RESULTS AND DISCUSSION
The mean air temperature, relative humidity and solar radiation during the experimental period were 20ºC, 69% and 6.8 MJ m–2 d–1, respectively. The ac-cumulated growing degree-days was 1264ºC, and the observed meteorological conditions were favorable for corn development (Fancelli & Dourado-Neto, 2000).
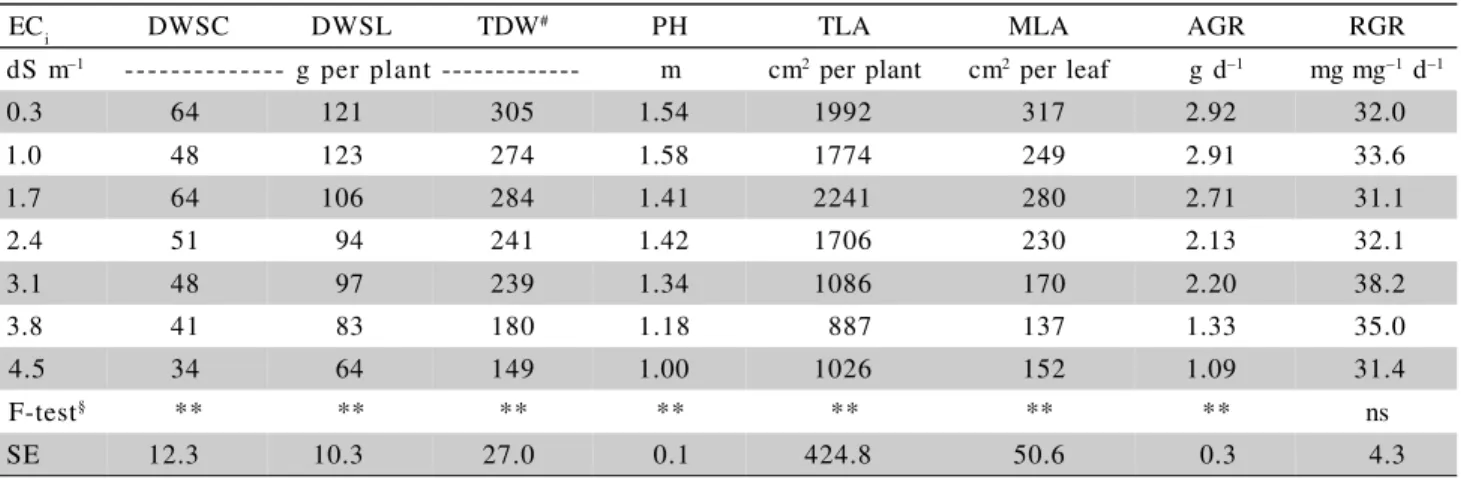
The electrical conductivity of the irrigation water (ECi) affected most variables related to the growth of corn plants (Table 1).
Using the 0.3 dS m–1 treatment as reference, the dry weight of stem and leaves (DWSL) was higher than the 100 g per plant found by Silva (2002) and are in agreement with Dourado-Neto (1999), who found DWSL values varying from 112 to 181 g per plant for different hybrids. The total dry weight (TDW)
ECi DWSC DWSL TDW# PH TLA MLA AGR RGR
dS m–1 --- g per plant --- m cm2 per plant cm2 per leaf g d–1 mg mg–1 d–1
0.3 64 121 305 1.54 1992 317 2.92 32.0
1.0 48 123 274 1.58 1774 249 2.91 33.6
1.7 64 106 284 1.41 2241 280 2.71 31.1
2.4 51 94 241 1.42 1706 230 2.13 32.1
3.1 48 97 239 1.34 1086 170 2.20 38.2
3.8 41 83 180 1.18 887 137 1.33 35.0
4.5 34 64 149 1.00 1026 152 1.09 31.4
F-test§ ** ** ** ** ** ** ** ns
SE 12.3 10.3 27.0 0.1 424.8 50.6 0.3 4.3
§ ns, **Non-significant and significant (p < 0.01), respectively. # TDW = DWSC + DWSL + DWG, where DWG is the dry weight of grains.
was slightly lower than that of Dourado-Neto (1999), due to the high DWSC+DWG obtained in his experi-ment (above 200 g per plant for all hybrids), while in the present study the DWSC+DWG in the 0.3 dS m–1 treatment was of 184 g per plant. In general, the re-duction of dry matter of different parts of maize was about 50% when ECi rose from 0.3 to 4.5 dS m–1.
Plant height (PH) recorded for 0.3 dS m–1 was 1.54 m, which was lower than 1.88 m recorded by Almeida et al. (2003). Total (TLA) and mean (MLA) leaf area of non-stressed plants were 1992 cm2
per plant and 317 cm2 per leaf, respectively. Manzatto (1987) found TLA varying from 1580 to 1802 cm2 per plant at 40 DAS, for four hybrids of corn, while André & Ferraudo (1997) reported that the TLA of the cv. ‘Maya-Normal’ was 2844 cm2
per plant at 39 DAS. These differences of leaf area are expected because the leaf area depends on several variables like soil fer-tility, meteorological conditions, plant density and ge-netic characteristics of cultivars and hybrids (Dourado-Neto, 1999).
The salinity of the irrigation water delayed the growth of the plants, with reduction of the absolute growth rate (AGR) of 63% at ECi of 4.5 dS m–1 in comparison to ECi of 0.3 dS m–1. On the other hand, the relative growth rate (RGR) was not affected by ECi, which reveals that the growth relative to the amount of preexistent dry matter was the same for all levels of ECi, that is, the growth potential of maize ‘AG 6690’ under low and high salinity was the same.
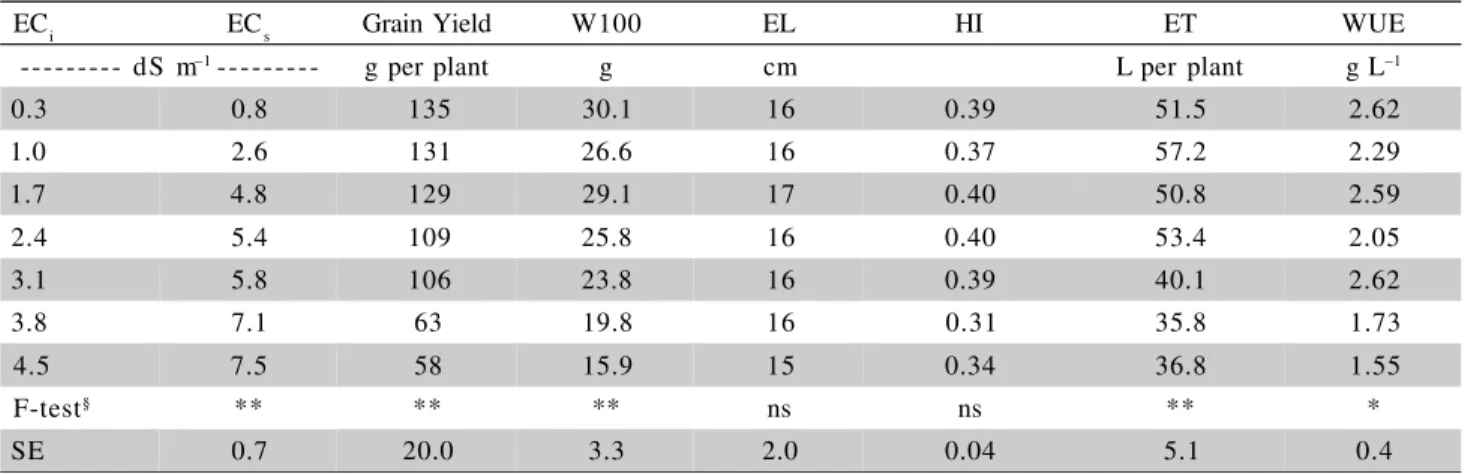
The ECi reduced grain yield, weight of 100 grains (W100) and evapotranspiration (ET) and had no effect on ear length (EL) and harvest index (HI) (Table 2).
The crop removes much of the water applied by irrigation from the soil to meet its evapotranspi-ration demand, but leaves most of the salts behind to concentrate in the soil solution (Ayers & Westcott, 1999). The electrical conductivity of the soil solution (ECs) increased linearly with ECi and reached 7.5 dS m–1 for the treatment irrigated with EC
i of 4.5 dS m –1
(Figure 2). However, a change in the slope of the curve is clear after ECi of 1.7 dS m–1, probably due to the effect of the precipitation of salts of the soil solution with increasing concentration (Aragües et al., 1990). The presence of salts containing the common ion in the soil solution decreases the solubility of these salts (FAO, 1973), thus the application of a solution containing CaCl2 may lead to the precipitation of Ca salts, in the form of carbonate and sulphate minerals of low solubility, reducing the relative concentration of Ca in the soil solution.
Figure 2 - Linear segment regression between mean electrical conductivity of soil solution (ECs) and electrical conductivity of the irrigation water (ECi).
y = 2.76x r2 = 0.99
y = 1.028x + 2.93 r2 = 0.96
0 1 2 3 4 5 6 7 8
0 1 2 3 4 5
ECi (dS m–1)
E
Cs
(d
S
m
–1 )
§ ns, **, * Non-significant and significant at 0.01 and 0.05 level of probability, respectively.
Table 2 - Means and F-test for electrical conductivity of the soil solution (ECs), grain yield, weight of 100 grains (W100), ear length (EL), harvest index (HI), evapotranspiration (ET) and water use efficiency (WUE) of corn irrigated with saline waters of different electrical conductivities (ECi).
ECi ECs Grain Yield W100 EL HI ET WUE
--- dS m–1 --- g per plant g cm L per plant g L–1
0.3 0.8 135 30.1 16 0.39 51.5 2.62
1.0 2.6 131 26.6 16 0.37 57.2 2.29
1.7 4.8 129 29.1 17 0.40 50.8 2.59
2.4 5.4 109 25.8 16 0.40 53.4 2.05
3.1 5.8 106 23.8 16 0.39 40.1 2.62
3.8 7.1 63 19.8 16 0.31 35.8 1.73
4.5 7.5 58 15.9 15 0.34 36.8 1.55
F-test§ ** ** ** ns ns ** *
Electrical conductivity of the soil solution was 2.76 times higher than ECi up to ECi of 1.7 dS m–1, but above this limit the regression slope was practi-cally equal to 1.0 for higher ECi with an intercept value of 2.93, which indicates that above the limit of ECi = 1.7 dS m–1 the electrical conductivity of soil solution increases by 2.93 dS m–1. This value is greater than the electrical conductivity of the saturated solution of calcium sulphate (2.8 dS m–1) (Hoorn & Alphen, 1994); therefore, it is presumed that part of calcium precipi-tated as calcium sulphate is due to the application of ammonium sulphate.
Grain yield was reduced from 135 to 58 g per plant when ECi increased from 0.3 to 4.5 dS m–1. Wa-ter use efficiency (WUE) for grain production was 2.62 kg m–3
and it decreased 41% for ECi of 4.5 dS m–1 (Table 2). Kang et al. (2000) found WUE of 2.61 kg m–3 for cv. ‘Duanyu’, and Howell et al. (1998) of about 1.55 kg m–3 for two hybrids of maize (Pioneer 3737 and Pioneer 3245). Reduction of WUE with increas-ing salinity was also observed by Guelloubi et al. (2005) and Shalhevet et al. (1986). On the other hand, Yazar et al. (2003) and Katerji et al. (1996) did not observe differences in WUE for corn irrigated with water of various levels of ECi, with mean WUE of 1.13 and 1.12 kg m–3, respectively.
The mean harvest index (HI) was found to be 0.37 and was not affected by ECi, which agrees with Yazar et al. (2003) and Pandey et al. (2000) (0.35– 0.40), while Sá et al. (2002) found HI varying from 0.36 to 0.65 for various cultivars and hybrids, but in this case, the HI was calculated considering the total ear weight and not the kernel weight. In the present
study, if the total dry matter of the ear is considered, then the HI would be in the range of 0.52 to 0.62 for treatments irrigated with water from 0.3 to 4.5 dS m–1, respectively.
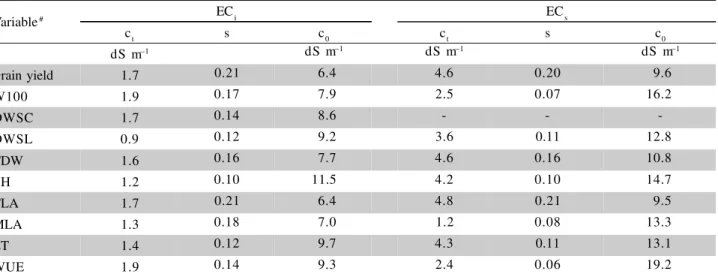
Table 3 shows the parameters of the piecewise regression model adjusted by the SALT program. The most sensitive variable to salinity was DWSL, which was reduced for ECi down to 0.9 dS m–1. This agrees with the statements of other authors that the vegeta-tive development is more affected by salinity than the yield components (Maas et al., 1983; Willadino et al., 1994).
Maas et al. (1983) reported that grain yield of corn was not affected by ECi up to 4.6 dS m–1 for cultivars ‘Bonanza’ and ‘Golden Cross Bantam’, and Hoffman et al. (1983) showed that it was reduced by 14% for each ECs unit increase above 3.7 dS m–1 for cv. ‘DeKalb XL75’. In the present work, yield of the hybrid ‘AG 6690’ tolerated ECi and ECs of 1.7 and 4.6 dS m–1 and reduced 21% and 20% for each unit in-creased in ECi and ECs, respectively.
Maas & Hoffman (1977) stated that a reduc-tion of 50% in corn yield was observed for ECi of 3.9 dS m–1, which agrees with the results of the present study, where the same reduction was reached for ECi of 4.1 dS m–1 and the response curves were very simi-lar(Figure 3).
The adjustment of the piecewise regression using the electrical conductivity of the soil solution (ECs) revealed that grain yield was not affected by ECs up to 4.6 dS m–1, but it decreased 20% for each unit increase of salinity above this threshold (Table 3). The total leaf area was the most tolerant variable to ECs,
# W100 = weight of 100 grains; DWSC = dry weight of straw and cob; DWSL = dry weight of stem and leaves; TDW = total dry weight; TLA = total leaf area; MLA = mean leaf area; ET = evapotranspiration; WUE = water use efficiency.
Table 3 - Values of threshold salinity (ct), slope (s) and salinity for zero yield (c0) adjusted from the electrical conductivity of the irrigation water (ECi) and soil solution (ECs), for the relative values of the variables measured of corn.
Variable# ECi ECs
ct s c0 ct s c0
dS m–1 dS m–1 dS m–1 dS m–1
Grain yield 1.7 0.21 6.4 4.6 0.20 9.6
W100 1.9 0.17 7.9 2.5 0.07 16.2
DWSC 1.7 0.14 8.6 - -
-DWSL 0.9 0.12 9.2 3.6 0.11 12.8
TDW 1.6 0.16 7.7 4.6 0.16 10.8
PH 1.2 0.10 11.5 4.2 0.10 14.7
TLA 1.7 0.21 6.4 4.8 0.21 9.5
MLA 1.3 0.18 7.0 1.2 0.08 13.3
ET 1.4 0.12 9.7 4.3 0.11 13.1
and the mean leaf area (MLA) was the least tolerant, but the reduction of TLA and MLA for unitary increase of ECs was 21% and 8%, respectively. Thus, leaf ex-pansion was inhibited even for low salinity levels and decreased slowly with the salinity increase. This de-crease was compensated by a higher number of leaves produced at the moderate salinity levels, which in-creased the TLA (Figure 4).
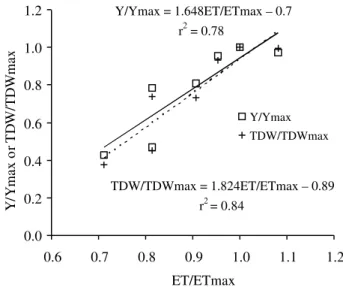
To obtain more reliable results for crop yield in saline environments, different authors have estab-lished the relationship between relative yield (Y/Ymax) and relative evapotranspiration (ET/ETmax), as the relative evapotranspiration permits to evaluate to what extent crop water requirements have been satisfied, therefore it may serve as an indicator of the water sup-ply conditions to crops (Katerji, 2002). In the present study, yield and evapotranspiration at ECi of 4.5 dS m–1 were reduced by 57 and 29% in relation to EC
i of
0.3 dS m–1, and the relationship between relative yield and relative ET was linear (Figure 5). This result is in agreement with Katerji et al. (2001), which found lin-ear relationships between Y/Ymax and ET/ETmax for several crops under saline conditions, including corn.
CONCLUSIONS
The grain yield of the corn hybrid ‘AG6690’ is reduced by 20% for each unit increase in electrical conductivity of the irrigation water and of the soil so-lution above 1.7 and 4.6 dS m–1, respectively. The growth of corn is reduced with increase of salinity and the vegetative parts are more affected than the repro-ductive. Under saline stress the number of corn leaves increases in an attempt to maintain the total leaf area unaltered.
REFERENCES
ALMEIDA, M.L.; SANGOI, L.; NAVA, I.C.; GALIO, J.; TRENTIN, P.S.; RAMPAZZO, C. Crescimento inicial de milho e sua relação com o rendimento de grãos. Ciência Rural, v.33, p.189-194, 2003.
ANDRÉ, R.G.B.; FERRAUDO, A.S. Aspectos hídricos da cultura do milho (Zea mays L.). In: CONGRESSO BRASILEIRO DE
AGROMETEOROLOGIA, 10., Piracicaba, 1997. Anais.
Piracicaba: Sociedade Brasileira de Agrometeorologia, 1997. p.629-631.
ARAGÜES, R.; TANJI, K.K.; QUILEZ, D.; FACI, J. Conceptual irrigation return flow hydrosalinity model. In: TANJI, K.K. (Ed.) Agricultural salinity assessment and management.
New York: ASCE, 1990. cap.24, p.504-529.
ASHRAFUZZAMAN, M.; KHAN, M.A.H.; SHAHIDULLAH, S.M. Response of vegetative growth of maize (Zea mays) to a range of salinity. Online Journal of Biological Sciences, v.3, p.253-258, 2003.
AYERS, R.S.; WESTCOT, D.W. A qualidade da água na
agricultura. 2.ed. Campina Grande: UFPB, 1999. 153p.
(Estudos FAO: Irrigação e Drenagem, 29).
Figure 5 - Relation between relative yield (Y/Ymax) and total dry weight (TDW/TDWmax) with relative evapo-transpiration (ET/ETmax) of corn.
Figure 4 - Relative values of mean leaf area (MLA), total leaf area (TLA) and number of leaves (NL) of corn as a function of electrical conductivity of the soil solution (ECs). 0.0
0.2 0.4 0.6 0.8 1.0 1.2 1.4
0 1 2 3 4 5 6 7 8
ECs (dS m–1)
R
el
at
iv
e
M
L
A
,T
L
A
or
N
L
MLA TLA NL
Y/Ymax = 1.648ET/ETmax – 0.7 r2 = 0.78
TDW/TDWmax = 1.824ET/ETmax – 0.89 r2 = 0.84
0.0 0.2 0.4 0.6 0.8 1.0 1.2
0.6 0.7 0.8 0.9 1.0 1.1 1.2
ET/ETmax
Y
/Y
m
ax
o
rT
D
W
/T
D
W
m
ax
.
Y/Ymax TDW/TDWmax
Figure 3 - Relative grain yield (Y/Ymax) of corn as a function of electrical conductivity of the irrigation water (ECi). Dashed line is the relative yield calculated using values of slope and threshold ECi presented by Maas & Hoffman (1977).
0.0 0.2 0.4 0.6 0.8 1.0 1.2
0 1 2 3 4 5 6 7
ECi (dS m–1)
Y/Ymax
..
Maas & Hoffman (1977) Y/Y = 1– 0.17(ECi – 1.1)
BENINCASA, M.M.P. Análise de crescimento de plantas (noções básicas). Jaboticabal: FUNEP, 1988. 41p.
BLANCO, F.F. Tolerância do tomateiro à salinidade sob fertirrigação e calibração de medidores de íons específicos para determinação de nutrientes na solução do solo e na planta. Piracicaba: USP/ ESALQ, 2004. 115p. (Doutorado).
COUTO, L.; RESENDE, M.; ALBUQUERQUE, P.E.P. Importância do milho irrigado. In: RESENDE, M.; ALBUQUERQUE, P.E.P.; COUTO, L. (Ed.) A cultura do milho irrigado. Brasília: Embrapa Informação Tecnológica, 2003. cap.1, p.17-30. CRAMER, G.R.; ALBERICO, G.J.; SCHMIDT, C. Leaf expansion
limits dry matter accumulation of salt-stressed maize. Australian Journal of Plan Physiology, v.21, p.675-692, 1994. CRUZ, M.G.M.; ANDRADE, E.M.; NESS, R.L.L.; MEIRELES,
A.C.M. Caracterização das águas superficiais e subterrâneas do projeto Jaguaribe-Apodi. Engenharia Agrícola, v.23, p.187-194, 2003.
DOURADO-NETO, D. Modelos fitotécnicos referentes à cultura de milho. Piracicaba: ESALQ/USP, 1999. 229p. (Livre Docência).
FANCELLI, A.L.; DOURADO-NETO, D. Produção de milho.
Guaíba: Agropecuária, 2000. 360p.
FOOD AND AGRICULTURE ORGANIZATION - FAO. FAOSTAT:
agricultural data.Available at: http://faostat.fao.org. Accessed 4 Apr. 2006.
FOOD AND AGRICULTURE ORGANIZATION - FAO. Irrigation, drainage and salinity: an international source book. Paris: UNESCO/Hutchinson, 1973. 510p.
GENUCHTEN, M.T. van. Analyzing crop salt tolerance data:
model description and user’s manual. Riverside: USSL, 1983. 50p. (Research Report, 120).
GUELLOUBI, R.; HAMDY, A.; SARDO, V. Maize production under supplemental irrigation with saline water in rainfed agriculture. In: INTERNATIONAL CONFERENCE ON WATER, LAND AND FOOD SECURITY IN ARID AND SEMI-ARID REGIONS, 1., Valenzano, 2005. Proceedings. Valenzano: CIHEAM, 2005. CD-ROM.
HASEGAWA, P.M.; BRESSAN, R.A.; ZHU, J.K.; BOHNERT, H.J. Plant cellular and molecular responses to high salinity. Annual Review of Plant Biology, v.51, p.463-499, 2000.
HOFFMAN, G.J.; MAAS, E.V.; PRICHARD, T.L.; MEYER, J.L. Salt tolerance of corn in the Sacramento-San Joaquin Delta of California. Irrigation Science, v.4, p.31-44, 1983. HOLANDA, J.S.; AMORIM, J.R.A. Qualidade da água para irrigação.
In: GHEYI, H.R.; QUEIROZ, J.E.; MEDEIROS, J.F. (Ed.)
Manejo e controle da salinidade na agricultura irrigada.
Campina Grande: UFPB/SBEA, 1997. cap.5, p.137-169. HOORN, J.W. van; ALPHEN, J.G. van. Salinity control. In:
RITZEMA, H.P. (Ed.) Drainage principles and applications.
2.ed. Wageningen: International Institute for Land Reclamation and Improvement, 1994. cap.15, p.533-600.
HOWELL, T.A.; TOLK, J.A.; SCHNEIDER, A.D.; EVETT, S.R. Evapotranspiration, yield, and water use efficiency of corn hybrids differing in maturity. Agronomy Journal, v.90, p.3-9, 1998.
KANG, S.; SHI, W.; ZHANG, J. An improved water-use efficiency for maize grown under regulated deficit irrigation. Field Crops Research, v.67, p.207-214, 2000.
KATERJI, N. Productivity analysis of crops grown in saline environment: presentation of the major research lines. In: KATERJI, N.; HAMDY, A.; HOORN, I.W. van; MASTRORILLI, M. (Ed.). Mediterranean crop responses to water and soil salinity: eco-physiological and agronomic analyses. Bari: CIHEAM/IAMB, 2002. p.231-249. (Options Méditerranéennes: Serie B. Études et Recherches, 36).
KATERJI, N.; HOORN, J.W. van; HAMDY, A.; KARAM, F.; MASTRORILLI, M. Effect of salinity on water stress, growth, and yield of maize and sunflower. Agricultural Water Management, v.30, p.237-249, 1996.
KATERJI, N.; HOORN, J.W. van; HAMDY, A.; KARAM, F.; MASTRORILLI, M. Salt tolerance of crops according to three classification methods and examination of some hypothesis about salt tolerance. Agricultural Water Management, v.47, p.1-8, 2001.
LAZOF, D.B.; BERNSTEIN, N. The NaCl induced inhibition of shoot growth: the case for disturbed nutrition with special consideration of calcium. Advances in Botanical Research, v.29, p.113-189, 1999.
MAAS, E.V.; HOFFMAN, G.J. Crop salt tolerance: current assessment. Journal of Irrigation and Drainage Division, v.103, p.115-134, 1977.
MAAS, E.V.; HOFFMAN, G.J.; CHABA, G.D.; POSS, J.A.; SHANNON, M.C. Salt sensitivity of corn at various growth stages. Irrigation Science, v.4, p.45-57, 1983.
MANZATTO, C.V. Acumulação de matéria seca e nutrientes em quatro híbridos de milho (Zea mays L.). Itaguaí:UFRRJ/IA, 1987.
157p. (Mestrado).
MEDEIROS, J.F.; LISBOA, R.A.; OLIVEIRA, M.; SILVA JÚNIOR, M.J.; ALVES, L.P. Caracterização das águas subterrâneas usadas para irrigação na área produtora de melão da Chapada do Apodi.
Revista Brasileira de Engenharia Agrícola e Ambiental, v.7, p.469-472, 2003.
MUNNS, R. Genes and salt tolerance: bringing them together. New Phytologist, v.167, p.645-663, 2005.
NEUMANN, P.M.; VOLKENBURGH, E.V.; CLELAND, R.E. Salinity stress inhibits bean leaf expansion by reducing turgor, not wall extensibility. Plant Physiology, v.88, p.233-237, 1988.
NIEMAN, R.H. Expansion of bean leaves and its suppression by salinity. Plant Physiology, v.40, p.156-161, 1964.
NOGUEIRA, M.C.S. Estatística experimental aplicada à experimentação agronômica. Piracicaba: USP/ESALQ, 1997. 250p.
PANDEY, R.K.; MARANVILLE, J.W.; CHETIMA, M.M. Deficit irrigation and nitrogen effects on maize in a Sahelian environment II. Shoot growth, nitrogen uptake and water extraction. Agricultural Water Management, v.46, p.15-27, 2000.
SÁ, M.; RAMALHO, M.A.P.; SOUZA SOBRINHO, F. Aspectos morfológicos e fisiológicos de cultivares modernas e antigas de milho. Ciência e Agrotecnologia, v.26, p.1082-1091, 2002. SHALHEVET, J.; VINTEN, A.; MEIRI, A. Irrigation interval as a factor in sweet corn response to salinity. Agronomy Journal, v.78, p.539-545, 1986.
SILVA, C.J. Efeito de diferentes relações folhas/grãos sobre o metabolismo do nitrogênio em diferentes partes da planta de milho. Jaboticabal: UNESP/FCAV, 2002. 64p. (Mestrado). STEWART, D.W.; DWYER, L.M. Mathematical characterization
of leaf shape and area of maize hybrids. Crop Science, v.39, p.422-427, 1999.
WILLADINO, L.; CÂMARA, T.R.; TABOSA, J.N.; ANDRADE, A.G.; GOMES, R.V.; SOUZA, A.J. Avaliação de cultivares de milho em solo salino do semi-árido de Pernambuco. Pesquisa Agropecuária Brasileira, v.29, p.1059-1065, 1994. YAZAR, A.; GENÇEL, B.; SEZEN, M.S. Corn yield response to
saline irrigation water applied with a trickle system. Food, Agriculture & Environment, v.1, p.198-202, 2003. ZHU, J.K. Plant salt tolerance. Trends in Plant Science, v.6,
p.66-71, 2001.