ISSN 0100-879X
BIOMEDICAL SCIENCES
AND
CLINICAL INVESTIGATION
www.bjournal.com.br
www.bjournal.com.br
Volume 43 (7) 600-697 July 2010
Institutional Sponsors
The Brazilian Journal of Medical and Biological Research is partially financed by
Hotsite of proteomics metabolomics developped by:
Braz J Med Biol Res, July 2010, Volume 43(7) 687-693
doi: 10.1590/S0100-879X2010007500054
Effect of metabolic syndrome and of its individual components on
renal function of patients with type 2 diabetes mellitus
Effect of metabolic syndrome and of its
individual components on renal function
of patients with type 2 diabetes mellitus
M. Moehlecke, C.B. Leitão, C.K. Kramer, T.C. Rodrigues,
C. Nickel, S.P. Silveiro, J.L. Gross and L.H. Canani
Serviço de Endocrinologia, Hospital de Clínicas de Porto Alegre, Porto Alegre, RS, Brasil
Abstract
The objective of this study was to evaluate the effect of metabolic syndrome (MetS) and its individual components on the renal function of patients with type 2 diabetes mellitus (DM). A cross-sectional study was performed in 842 type 2 DM patients. A clinical and laboratory evaluation, including estimated glomerular filtration rate (eGFR) calculated by the modification of diet in renal disease formula, was performed. MetS was defined according to National Cholesterol Education Program - Adult Treat -ment Panel III criteria. Mean patient age was 57.9 ± 10.1 years and 313 (37.2%) patients were males. MetS was detected in 662 (78.6%) patients. A progressive reduction in eGFR was observed as the number of individual MetS components increased (one: 98.2 ± 30.8; two: 92.9 ± 28.1; three: 84.0 ± 25.1; four: 83.8 ± 28.5, and five: 79.0 ± 23.0; P < 0.001). MetS increased the risk for low eGFR (<60 mL·min-1·1.73 (m2)-1) 2.82-fold (95%CI = 1.55-5.12, P < 0.001). Hypertension (OR = 2.2, 95%CI =
1.39-3.49, P = 0.001) and hypertriglyceridemia (OR = 1.62, 95%CI = 1.19-2.20, P = 0.002) were the individual components with the strongest associations with low eGFR. In conclusion, there is an association between MetS and the reduction of eGFR in patients with type 2 DM, with hypertension and hypertriglyceridemia being the most important contributors in this sample. Interventional studies should be conducted to determine if treatment of MetS can prevent renal failure in type 2 DM patients.
Key words: Metabolic syndrome; Type 2 diabetes mellitus; Glomerular filtration rate; Modification of diet in renal disease
Introduction
Correspondence: L.H. Canani, Serviço de Endocrinologia, Hospital de Clínicas de Porto Alegre, Rua Ramiro Barcelos, 2350, Prédio 12, 4º andar, 90035-003 Porto Alegre, RS, Brasil. Fax: +55-51-2101-8777. E-mail: [email protected]
Received September 28, 2009. Accepted May 10, 2010. Available online June 11, 2010. Published July 9, 2010.
Metabolic syndrome (MetS) has been described as a cluster of cardiovascular risk factors such as obesity, hypertension, dyslipidemia, and hyperglycemia, which is associated with increased mortality even among subjects
with a low-risk cardiovascular profile (1). MetS occurs in
85% of the patients with type 2 diabetes mellitus (DM) and is associated with an increased prevalence of micro- and macrovascular complications (2).
Diabetic nephropathy is observed in about 10-40% (3,4) of type 2 DM patients and is traditionally diagnosed
by increased albuminuria. Estimated glomerular filtration rate (eGFR) is another marker of renal function, which is
usually normal at the initial stages of diabetic nephropa-thy and begins to decrease in later stages (5). However,
exceptions to this rule occur and a minority of diabetic
patients can present long duration of macroalbuminuria
without decreased eGFR (6) or low eGFR in the absence of increased urinary albumin excretion (7).
Chronic kidney disease (CKD), represented by
de-creased eGFR, is associated with a worsening of cardio -vascular prognosis even in a non-diabetic population (8). MetS seems to play a role in this setting, since USA subjects
with hypertension and MetS have lower eGFR compared to
those without MetS (9). Similar results have been reported for Italians with type 2 DM, who presented clustering of hypertension, dyslipidemia and obesity associated with
low eGFR (10). However, the relative contribution of each
component of the syndrome to the renal outcome has not been assessed.
The objectives of the present study were to evaluate
eGFR in patients with type 2 DM according to the pres -ence of MetS, to assess whether the aggregation of MetS
components was associated with an unfavorable eGFR profile, and to estimate the relative contribution of each
688 M. Moehlecke et al.
Patients and Methods
Patients
A cross-sectional study was conducted on type 2 DM outpatients from three general hospitals in the State of Rio Grande do Sul, Brazil (Hospital de Clínicas de Porto Alegre, Hospital Independência, and Hospital de Passo
Fundo), which are participating in an ongoing multicenter
study. Type 2 DM was diagnosed in patients over 35 years
of age and without the use of insulin during the first 5 years after diagnosis. Patients with eGFR <30 mL/min were excluded. A clinical and laboratory evaluation was
performed as previously reported (2) and is described
briefly below.
The definition of MetS was based on the criteria of the
National Cholesterol Education Program - Adult Treatment Panel III (NCEP - ATP III), as the presence of two or more of the following criteria besides type 2 DM: 1) elevated blood
pressure: ≥130/85 mmHg and/or on anti-hypertensive treatment; 2) triglycerides ≥150 mg/dL; 3) HDL <40 mg/ dL in males or HDL <50 mg/dL in females, and 4) central
obesity: waist >102 cm in males or >88 cm in females (1). The patients were grouped according to the number of
MetS components: two, three, four, or five (groups 2, 3, 4,
or 5, respectively). Patients with only type 2 DM and none
of the other MetS findings comprised group 1.
Patients underwent an interview and clinical exami -nation to identify demographic and anthropometric data. Blood pressure (BP) was measured twice with a mercury sphygmomanometer, using the left arm and with the patient
in a sitting position, after a 5-min rest. Fundoscopy was performed by an experienced ophthalmologist after my
-driasis and diabetic retinopathy (DR) was classified using
the scale developed by the Global Diabetic Retinopathy Group (11). The DR level was based on the most severe
degree of retinopathy in the worst affected eye. For the
purpose of this study, patients were grouped according to the presence or absence of any degree of DR. Ischemic heart disease was established if anginaor a possible
infarct was demonstrated by the World Health Organiza
-tion (WHO) Cardiovascular Ques-tionnaire and/or resting electrocardiogram abnormalities [Minnesota Codes Q and QS patterns(1.-2, 1.3); S-T junction (J) and segment depression (4.1-4); T wave items (5.1-3), and complete left
bundle block (7.1)] and/or perfusion abnormalities(fixed
or variable) on myocardial scintigraphy at rest andafter iv
dipyridamole. Due to costs and complexity, ischemic heart
disease was evaluated in only 469patients attending the Hospital de Clínicas de Porto Alegre Centre. Peripheral vascular disease (PVD) was diagnosed by the presence
of intermittent claudication, assessed by the WHO ques -tionnaire for cardiovascular disease (12), or absence of posterior tibial and dorsal pedious pulses upon clinical
examination. Stroke was established by history and/or presence of compatible findings (sequelae). The diagnosis
of distal sensory neuropathy was based on abnormal
Achil-les tendon reflexes, vibration or sensory perception.
The study protocol was approved by the Ethics and Research Committee at all Centers involved and all pa-tients gave written informed consent.
Laboratory tests
Glycated hemoglobin (A1c test) was measured by high
performance liquid chromatography in a Merck-Hitachi
9100 apparatus, using the chromatographic method with
cation exchange (reference value <6%). Fasting plasma glucose was measured using the glucose-peroxidase
colorimetric method (Biodiagnostica kit, Brazil), serum creatinine was determined by the Jaffé method and
lipid profile by the enzymatic colorimetric method. LDL-cholesterol was calculated using the Friedewald equation
(13). Albuminuria was measured by immunoturbidimetry with a commercial kit (Microalb; Ames-Bayer, USA) and
intra- and interassay coefficients of variations were 4.5 and 11.0%, respectively. Patients were classified based on urinary albumin excretion (UAE) in 2 of 3 sterile urine collections, as normo- (UAE <20 µg/min or <17 mg/L), micro- (UAE 20-199 µg/min or 17-174 mg/L), or macroal -buminuric (UAE ≥200 µg/min or >174 mg/L) for 24-h urine
or in a random sample, respectively. eGFR was calculated by the Modification of Diet in Renal Disease (MDRD) for
-mula: 186 x (serum creatinine)-1.154 x (age)-0.203 x (0.742 if female) x (1.212 if African-descendant) (14-16). In order
to perform a categorical analysis of renal impairment, we
considered stage 3 (eGFR = 30-59 mL·min-1·1.73 (m2)-1) of CKD according to the National Kidney Foundation as the
outcome (17). Insulin was measured by radioimmunoassay
(ElecsysR Systems 1010/2010/modular analytics E170 -
Roche, Germany) in patients not on insulin therapy (N = 190). Insulin sensitivity was estimated by the homeostasis
model assessment formula (HOMAR-IR = fasting insulin (mIU/mL) x fasting glucose (mM) / 22.5) (18).
Statistical analysis
Continuous variables are reported as means ± SD,
medians (minimum-maximum) and categorical variables as numbers (percentages). The chi-square test and one-way analysis of variance (ANOVA) were used for comparisons
among groups. Post hoc analyses were performed with the Tukey test. Variables without normal distribution were
log transformed. Tests were two-sided and a significant
value of 0.05 was used.
A multiple linear regression model was applied with
eGFR as the dependent variable and age, gender, ethnic -ity, systolic BP, weight, A1c test, and presence of MetS or its individual components as the independent ones.
To evaluate the impact of MetS and the influence of each component on eGFR, univariate logistic regression models were constructed and the odds ratios (OR) for CKD stage
Results
Among the 842 patients analyzed, 313 (37.2%) were males, 602 (71.5%) were white, and the mean age was
57.9 ± 10.1 years. Only 41 (4.9%) had no other criterion for
MetS besides DM (group 1), 139 (16.5%) had two (group
2), 220 (26.1%) had three, 258 (30.6%) had four, and 184
(21.9%) had all five criteria. Therefore, 78.6% of patients were classified as having MetS according to NCEP-ATP
III and more than 50% of subjects had 4 to 5 components of MetS. Clinical and laboratory characteristics are shown
in Tables 1 and 2. As expected, body mass index (BMI),
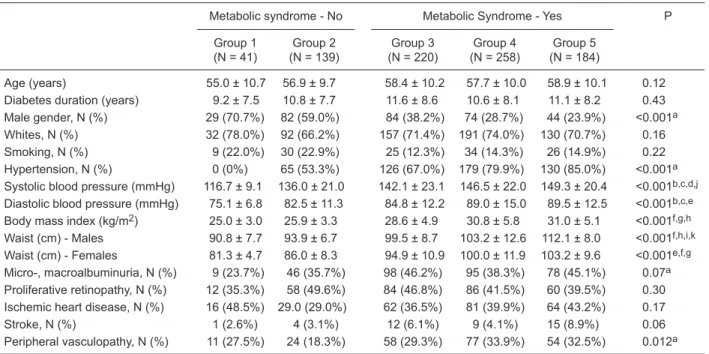
Table 1. Clinical characteristics of the patients according to the number of metabolic syndrome (MetS) components.
Metabolic syndrome - No Metabolic Syndrome - Yes P
Group 1 (N = 41)
Group 2 (N = 139)
Group 3 (N = 220)
Group 4 (N = 258)
Group 5 (N = 184)
Age (years) 55.0 ± 10.7 56.9 ± 9.7 58.4 ± 10.2 57.7 ± 10.0 58.9 ± 10.1 0.12 Diabetes duration (years) 9.2 ± 7.5 10.8 ± 7.7 11.6 ± 8.6 10.6 ± 8.1 11.1 ± 8.2 0.43 Male gender, N (%) 29 (70.7%) 82 (59.0%) 84 (38.2%) 74 (28.7%) 44 (23.9%) <0.001a
Whites, N (%) 32 (78.0%) 92 (66.2%) 157 (71.4%) 191 (74.0%) 130 (70.7%) 0.16 Smoking, N (%) 9 (22.0%) 30 (22.9%) 25 (12.3%) 34 (14.3%) 26 (14.9%) 0.22 Hypertension, N (%) 0 (0%) 65 (53.3%) 126 (67.0%) 179 (79.9%) 130 (85.0%) <0.001a
Systolic blood pressure (mmHg) 116.7 ± 9.1 136.0 ± 21.0 142.1 ± 23.1 146.5 ± 22.0 149.3 ± 20.4 <0.001b,c,d,j
Diastolic blood pressure (mmHg) 75.1 ± 6.8 82.5 ± 11.3 84.8 ± 12.2 89.0 ± 15.0 89.5 ± 12.5 <0.001b,c,e
Body mass index (kg/m2) 25.0 ± 3.0 25.9 ± 3.3 28.6 ± 4.9 30.8 ± 5.8 31.0 ± 5.1 <0.001f,g,h
Waist (cm) - Males 90.8 ± 7.7 93.9 ± 6.7 99.5 ± 8.7 103.2 ± 12.6 112.1 ± 8.0 <0.001f,h,i,k
Waist (cm) - Females 81.3 ± 4.7 86.0 ± 8.3 94.9 ± 10.9 100.0 ± 11.9 103.2 ± 9.6 <0.001e,f,g
Micro-, macroalbuminuria, N (%) 9 (23.7%) 46 (35.7%) 98 (46.2%) 95 (38.3%) 78 (45.1%) 0.07a
Proliferative retinopathy, N (%) 12 (35.3%) 58 (49.6%) 84 (46.8%) 86 (41.5%) 60 (39.5%) 0.30 Ischemic heart disease, N (%) 16 (48.5%) 29.0 (29.0%) 62 (36.5%) 81 (39.9%) 64 (43.2%) 0.17 Stroke, N (%) 1 (2.6%) 4 (3.1%) 12 (6.1%) 9 (4.1%) 15 (8.9%) 0.06 Peripheral vasculopathy, N (%) 11 (27.5%) 24 (18.3%) 58 (29.3%) 77 (33.9%) 54 (32.5%) 0.012a
Ischemic heart disease evaluated in 469 patients. Group 1 = only type 2 diabetes mellitus; groups 2-5 = 2-5 MetS components, re-spectively. aP for trend; bGroup 1 vs 2, 3, 4, and 5; cgroup 2 vs 1, 4 and 5; dgroup 3 vs 5; egroup 3 vs 4 and 5; fgroup 1 vs 3, 4, and 5; ggroup 2 vs 3, 4, and 5; hgroup 3 vs 1, 2, 4, and 5; igroup 2 vs 3, 4, and 5; jgroups 3 and 4 vs 5; kgroup 4 vs 5 (the chi-square test and
ANOVA were used for comparisons among groups. Post hoc analyses were performed with the Tukey test).
Table 2. Laboratory characteristics of the patients according to the number of metabolic syndrome (MetS) components.
Metabolic syndrome - No Metabolic syndrome - Yes P
Group 1 (N = 41)
Group 2 (N = 139)
Group 3 (N = 220)
Group 4 (N = 258)
Group 5 (N = 184)
Fasting plasma glucose (mg/dL) 162.9 ± 184.5 155.9 ± 58.7 165.5 ± 68.8 182.7 ± 86.0 188.7 ± 76.4 <0.001a
A1c test (%) 7.2 ± 2.1% 7.3 ± 2.1% 7.2 ± 2.1% 7.5 ± 2.5% 7.6 ± 2.5% 0.41 Total cholesterol (mg/dL) 182.2 ± 30.1 198.4 ± 46.9 204.9 ± 44.2 212.2 ± 48.3 213.9 ± 50.5 <0.001b,c
HDL cholesterol (mg/dL) 52.6 ± 9.1 52.9 ± 12.6 50.5 ± 14.2 44.2 ± 10.4 37.6 ± 6.4 <0.001d
LDL cholesterol (mg/dL) 113.7 ± 29.4 123.7 ± 38.9 128.5 ± 38.5 135.1 ± 44.8 132.5 ± 44.4 0.01e
Triglycerides (mg/dL) 95 (53-145) 95 (27-253) 114 (35-559) 173 (43-1669) 228 (150-1265) <0.001d
Serum creatinine (mg/dL) 0.9 (0.5-1.3) 0.9 (0.4-2.6) 0.9 (0.5-2.4) 0.9 (0.5-2.3) 0.9 (0.4-2.2) 0.67 HOMA-IR 3.2 (0.3-14.3) 3.0 (0.5-21.1) 4.9 (0.41-28.2) 5.3 (0.3-30.2) 8.4 (1.7-26.2) <0.001f
HOMA-IR = homeostasis model assessment (N = 190). Group 1 = only type 2 diabetes mellitus; groups 2-5 = 2-5 MetS components, respectively. aGroup 2 vs 4 and 5; bgroup 1 vs 3, 4 and 5; cgroups 2 and 3 vs 5; dgroups 1, 2 and 3 vs 4 and 5; egroup 1 vs 5; fgroups
690 M. Moehlecke et al.
waist circumference, systolic and diastolic BP, and triglyc-eride levels increased progressively according to number of MetS components. Total and LDL cholesterol values followed a similar pattern. HDL cholesterol was lower the larger the number of MetS components. Insulin resistance
in patients with more MetS components was confirmed by a
progressive increase in HOMA-IR values. Interestingly, the
proportion of females increased according to the number of MetS components.
eGFR was lower in patients with MetS compared to those
without (82.5 ± 28.7 vs 94.1 ± 28.7 mL·min-1·1.73 (m2)-1; P < 0.001). Separate analysis of eGFR values for each
group showed a progressive reduction with the increase in number of MetS components (one: 98.2 ± 30.8; two: 92.9
± 28.1; three: 84.0 ± 25.1; four: 83.8 ± 28.5, and five: 79.0 ± 23.0 mL·min-1·1.73 (m2)-1; ANOVA, P < 0.001; Figure 1). However, statistically significant differences were only
observed between one vs three, four and five, and two vs
three, four and five components. When each MetS compo
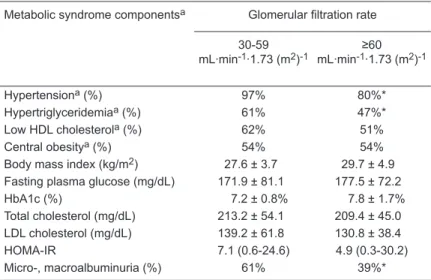
-nent was analyzed separately, patients with eGFR between 30 and 59 mL·min-1·1.73 (m2)-1 had a higher prevalence of
hypertension (97 vs 80%, P < 0.001) and high triglyceride
levels (61 vs 47%, P = 0.02), while lower HDL cholesterol (62 vs 51%, P = 0.08) and lower BMI (27.6 ± 3.7 vs 29.7 ±
4.9, P = 0.06) attained borderline significance in comparison with those with eGFR higher than 60 mL·min-1·1.73 (m2)-1 (Table 3). The frequency of central obesity was similar for all groups. As expected, low eGFR was associated with a higher prevalence of micro-/macroalbuminuria (61 vs
39%, P = 0.001).
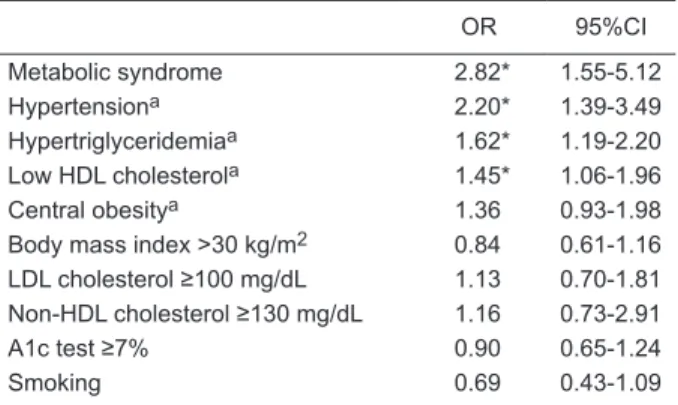
The OR for stage 3 CKD was calculated for each MetS
component and other variables possibly implicated and the univariate analyses are described in Table 4.
Hyperten-sion (OR = 2.203, 95%CI = 1.389-3.493, P = 0.001), high triglyceride levels (OR = 1.617, 95%CI = 1.190-2.199, P = 0.002), low HDL cholesterol levels (OR = 1.445, 95%CI = 1.063-1.964, P = 0.02) and PVD (OR =
1.618, 95%CI = 1.109-2.360, P = 0.01) were risk factors for stage 3 CKD. Abdominal
obe-sity was not associated with low eGFR (OR
= 1.355, 95%CI = 0.927-1.979, P = 0.12), nor were the other conventional risk factors such as global obesity, LDL cholesterol, non-HDL cholesterol, A1c test, and smoking status. Notably, a conventional diagnosis of MetS showed the best performance in identifying
a higher risk for CKD (OR = 2.815, 95%CI = 1.548-5.121, P < 0.001).
eGFR was still associated with MetS
after adjustments for possible confounding factors (age, gender, ethnicity, and A1c test) in a linear regression model (R = 0.406, Ra2 = 0.257, P < 0.001). When the presence of
MetS was replaced with its components in the same model, only BP levels (R = 0.373, Ra2 = 0.133, P = 0.01) and triglycerides (R
= 0.399, Ra2 = 0.153, P < 0.001) remained associated with eGFR.
Regarding other chronic DM complica-tions, no difference was observed for the
presence of proliferative DR or micro-/
Figure 1. Glomerular filtration rate estimated according to the number of components of the metabolic syndrome. *P < 0.05 in relation to 3, 4, and 5 components of the metabolic syndrome (the chi-square test and ANOVA were used for comparisons among groups. Post hoc analyses were performed with the Tukey test).
Table 3. Metabolic syndrome components and clinical and metabolic characteris-tics according to glomerular filtration rate.
Metabolic syndrome componentsa Glomerular filtration rate
30-59
mL·min-1·1.73 (m2)-1 mL·min-1≥60·1.73 (m2)-1
Hypertensiona (%) 97% 80%*
Hypertriglyceridemiaa (%) 61% 47%*
Low HDL cholesterola (%) 62% 51%
Central obesitya (%) 54% 54%
Body mass index (kg/m2) 27.6 ± 3.7 29.7 ± 4.9
Fasting plasma glucose (mg/dL) 171.9 ± 81.1 177.5 ± 72.2
HbA1c (%) 7.2 ± 0.8% 7.8 ± 1.7%
Total cholesterol (mg/dL) 213.2 ± 54.1 209.4 ± 45.0 LDL cholesterol (mg/dL) 139.2 ± 61.8 130.8 ± 38.4
HOMA-IR 7.1 (0.6-24.6) 4.9 (0.3-30.2)
Micro-, macroalbuminuria (%) 61% 39%*
aNational Cholesterol Education Program criteria. HOMA-IR = homeostasis model
macroalbuminuria and MetS. However, when macrovascular disease was considered, the prevalence of PVD increased among subjects with MetS (Table 1).
Discussion
An independent association between low eGFR and
MetS was observed in this sample of patients with type 2
DM. The components of MetS associated with low GFR were
BP levels, serum triglycerides, as well as HDL-cholesterol. Individually, increased triglycerides and BP levels were sug-gested to be the most relevant MetS components contribut-ing to CKD. No association was found between the number
of MetS components and DR or micro-/macroalbuminuria,
but an association with macrovascular disease (mainly peripheral vasculopathy) could be detected.
To the best of our knowledge, this report is the first to
analyze the individual contribution of each component of MetS to CKD in a Brazilian sample of type 2 DM patients. In our analysis, MetS was associated with a 2.8-fold increase
in risk for stage 3 CKD, followed by hypertension alone (OR
= 2.20). After linear regression analysis, after adjusting for confounders, the presence of MetS remained associated
with low eGFR. When each individual MetS component was
included in the analysis, BP levels and triglycerides were
also associated with low eGFR.
Associations between MetS and CKD have been evalu-ated in different populations. In the Third National Health
and Nutrition Examination Surveys (NHANES III), MetS
conferred a 2.6- and 1.9-fold risk for stage 3 CKD and
microalbuminuria, respectively (9). Similar findings were
observed in Spanish workers with mild renal dysfunction
(eGFR between 80 and 61 mL·min-1·1.73 (m2)-1) (19),
Japanese inpatients (20) and kidney transplant recipients (21). Recently, in a study of 2380 American Indians without DM at baseline followed for 10 years, MetS was associated
with an increased risk of developing CKD (OR = 1.3, 95%CI
= 1.1-1.6) (22). However, a prospective evaluation of the
Framingham cohort, analyzing patients without CKD disease
or DM at baseline, could not demonstrate any association between MetS and the development of CKD (23). The con-tribution of each individual MetS component to the kidney outcome has been studied in a population-based survey
in France. As observed in our experience, BP levels and
triglycerides were the most important contributors (24). Previous reports analyzing the role of individual MetS components and CKD in type 2 DM are scarce, and most
studies focused on UAE (2). In contrast to our findings, in a
study of 1003 Japanese subjects with type 2 DM,
microal-buminuria, but not decreased GFR, was independently
associated with MetS (25). Probably, the anthropometric characteristics of the Japanese population could account
for these differences in MetS and eGFR, since our study
population has a higher BMI than the Japanese sample. The mechanism accounting for the worsening of kidney function in patients with type 2 DM and MetS may be re-lated to the sum of its components, which are recognized risk factors for diabetic nephropathy development (12,26): hyperglycemia (27), hypertension (28), dyslipidemia (29),
and overweight (30). The pathogenesis of low GFR might
also be linked to ischemic nephrosclerosis, sharing the etiology with other macrovascular complications seen in these patients. In fact, the association found between low
eGFR and PVD corroborates the ischemic hypothesis, since atherosclerosis causing limb ischemia can be equally
present in the renal artery (31).
It is important to point out that our results are based on a cross-sectional study and our conclusions are limited to observations of associations between MetS and CKD, and
a direct cause and effect relation cannot be defined based on our data. The use of indirect methods to estimate GFR
(MDRD formula) instead of direct ones (EDTA 51chromium, iohexol and iodothalamate) may diminish the accuracy of the results by underestimating values when GFR is higher than 60 mL·min-1·(m2)-1. However, the MDRD formula is
widely accepted as a kidney function estimator, whereas
the other methods are complex, time-consuming and their
application to large samples is not feasible.
In conclusion, the diagnosis of MetS is an independent risk factor for CKD in patients with type 2 DM, with hyper-tension and hypertriglyceridemia being the most important
contributors in our sample. Therefore, decreased GFR rep -resents a new outcome of MetS and further interventional studies should be conducted to analyze whether MetS treatment could prevent the development of renal failure.
Table 4. Metabolic syndrome components and odds ratio for chronic kidney disease stage 3 (glomerular filtration rate = 30-59 mL·min-1·1.73 (m2)-1) according to the National Kidney Founda
-tion.
OR 95%CI Metabolic syndrome 2.82* 1.55-5.12
Hypertensiona 2.20* 1.39-3.49
Hypertriglyceridemiaa 1.62* 1.19-2.20
Low HDL cholesterola 1.45* 1.06-1.96
Central obesitya 1.36 0.93-1.98
Body mass index >30 kg/m2 0.84 0.61-1.16
LDL cholesterol ≥100 mg/dL 1.13 0.70-1.81 Non-HDL cholesterol ≥130 mg/dL 1.16 0.73-2.91
A1c test ≥7% 0.90 0.65-1.24
Smoking 0.69 0.43-1.09
aNational Cholesterol Education Program criteria. *P < 0.05 (uni
692 M. Moehlecke et al.
References
1. Ardern CI, Katzmarzyk PT, Janssen I, Church TS, Blair SN. Revised Adult Treatment Panel III guidelines and cardio-vascular disease mortality in men attending a preventive medical clinic. Circulation 2005; 112: 1478-1485.
2. Costa LA, Canani LH, Lisboa HR, Tres GS, Gross JL. Aggre-gation of features of the metabolic syndrome is associated with increased prevalence of chronic complications in type 2 diabetes. Diabet Med 2004; 21: 252-255.
3. Gross JL, de Azevedo MJ, Silveiro SP, Canani LH, Caramori ML, Zelmanovitz T. Diabetic nephropathy: diagnosis, pre-vention, and treatment. Diabetes Care 2005; 28: 164-176. 4. Scheffel RS, Bortolanza D, Weber CS, Costa LA, Canani
LH, Santos KG, et al. [Prevalence of micro and macroan-giopathic chronic complications and their risk factors in the care of out patients with type 2 diabetes mellitus]. Rev Assoc Med Bras 2004; 50: 263-267.
5. Murussi M, Campagnolo N, Beck MO, Gross JL, Silveiro SP. High-normal levels of albuminuria predict the development of micro- and macroalbuminuria and increased mortality in Brazilian type 2 diabetic patients: an 8-year follow-up study.
Diabet Med 2007; 24: 1136-1142.
6. Friedman R, Gross JL. Evolution of glomerular filtration rate in proteinuric NIDDM patients. Diabetes Care 1991; 14: 355-359.
7. Kramer CK, Leitao CB, Pinto LC, Silveiro SP, Gross JL, Canani LH. Clinical and laboratory profile of patients with type 2 diabetes with low glomerular filtration rate and nor-moalbuminuria. Diabetes Care 2007; 30: 1998-2000. 8. Knobler H, Zornitzki T, Vered S, Oettinger M, Levy R, Caspi
A, et al. Reduced glomerular filtration rate in asymptom-atic diabetic patients: predictor of increased risk for cardiac events independent of albuminuria. J Am Coll Cardiol 2004; 44: 2142-2148.
9. Chen J, Muntner P, Hamm LL, Jones DW, Batuman V, Fon-seca V, et al. The metabolic syndrome and chronic kidney disease in U.S. adults. Ann Intern Med 2004; 140: 167-174.
10. De Cosmo S, Trevisan R, Minenna A, Vedovato M, Viti R, Santini SA, et al. Insulin resistance and the cluster of abnor-malities related to the metabolic syndrome are associated with reduced glomerular filtration rate in patients with type 2 diabetes. Diabetes Care 2006; 29: 432-434.
11. Wilkinson CP, Ferris FL III, Klein RE, Lee PP, Agardh CD, Davis M, et al. Proposed international clinical diabetic retin-opathy and diabetic macular edema disease severity scales.
Ophthalmology 2003; 110: 1677-1682.
12. Nelson RG, Bennett PH, Beck GJ, Tan M, Knowler WC, Mitch WE, et al. Development and progression of renal dis-ease in Pima Indians with non-insulin-dependent diabetes mellitus. Diabetic Renal Disease Study Group. N Engl J Med
1996; 335: 1636-1642.
13. Warnick GR, Knopp RH, Fitzpatrick V, Branson L. Estimat-ing low-density lipoprotein cholesterol by the Friedewald equation is adequate for classifying patients on the basis of nationally recommended cutpoints. Clinical Chemistry 1990; 36: 15-19.
14. Hallan S, Asberg A, Lindberg M, Johnsen H. Validation of the Modification of Diet in Renal Disease formula for estimat-ing GFR with special emphasis on calibration of the serum
creatinine assay. Am J Kidney Dis 2004; 44: 84-93. 15. Kang YS, Han KH, Han SY, Kim HK, Cha DR. Characteristics
of population with normal serum creatinine impaired renal function and: the validation of a MDRD formula in a healthy general population. Clin Nephrol 2005; 63: 258-266. 16. Levey AS, Bosch JP, Lewis JB, Greene T, Rogers N, Roth D.
A more accurate method to estimate glomerular filtration rate from serum creatinine: a new prediction equation. Modifica-tion of Diet in Renal Disease Study Group. Ann Intern Med
1999; 130: 461-470.
17. K/DOQI clinical practice guidelines for chronic kidney disease: evaluation, classification, and stratification. Am J Kidney Dis 2002; 39: S1-266.
18. Bonora E, Targher G, Alberiche M, Bonadonna RC, Saggiani F, Zenere MB, et al. Homeostasis model assessment closely mirrors the glucose clamp technique in the assessment of insulin sensitivity: studies in subjects with various degrees of glucose tolerance and insulin sensitivity. Diabetes Care
2000; 23: 57-63.
19. Cordero A, Laclaustra M, Leon M, Casasnovas JA, Grima A, Najar M, et al. [Cardiovascular risk factors and metabolic syndrome associated with subclinical renal failure]. Med Clin
2005; 125: 653-658.
20. Tanaka H, Shiohira Y, Uezu Y, Higa A, Iseki K. Metabolic syndrome and chronic kidney disease in Okinawa, Japan.
Kidney Int 2006; 69: 369-374.
21. Rogers J, Stratta RJ, Lo A, Alloway RR. Impact of the metabolic syndrome on long-term outcomes in simultaneous kidney-pancreas transplantation. Transplant Proc 2005; 37: 3549-3551.
22. Lucove J, Vupputuri S, Heiss G, North K, Russell M. Meta-bolic syndrome and the development of CKD in American Indians: the Strong Heart Study. Am J Kidney Dis 2008; 51: 21-28.
23. Fox CS, Larson MG, Leip EP, Meigs JB, Wilson PW, Levy D. Glycemic status and development of kidney disease: the Framingham Heart Study. Diabetes Care 2005; 28: 2436-2440.
24. Stengel B, Jaussent I, Guiserix J, Bourgeon B, Papoz L, Favier F. High prevalence of chronic kidney disease in La Reunion island and its association with the metabolic syn-drome in the non-diabetic population: La Reunion Diabetes (REDIA) Study. Diabetes Metab 2007; 33: 444-452. 25. Hanai K, Babazono T, Iwamoto Y. Renal manifestations of
metabolic syndrome in type 2 diabetes. Diabetes Res Clin Pract 2008; 79: 318-324.
26. Humphrey LL, Ballard DJ, Frohnert PP, Chu CP, O’Fallon WM, Palumbo PJ. Chronic renal failure in non-insulin-dependent diabetes mellitus. A population-based study in Rochester, Minnesota. Ann Intern Med 1989; 111: 788-796.
27. Stratton IM, Adler AI, Neil HA, Matthews DR, Manley SE, Cull CA, et al. Association of glycaemia with macrovascular and microvascular complications of type 2 diabetes (UKPDS 35): prospective observational study. BMJ 2000; 321: 405-412. 28. Adler AI, Stratton IM, Neil HA, Yudkin JS, Matthews DR,
2000; 321: 412-419.
29. Ravid M, Brosh D, Ravid-Safran D, Levy Z, Rachmani R. Main risk factors for nephropathy in type 2 diabetes mellitus are plasma cholesterol levels, mean blood pressure, and hyperglycemia. Arch Intern Med 1998; 158: 998-1004.
30. Hsu CY, McCulloch CE, Iribarren C, Darbinian J, Go AS. Body mass index and risk for end-stage renal disease. Ann Intern Med 2006; 144: 21-28.