BIOMEDICAL SCIENCES
AND
CLINICAL INVESTIGATION
www.bjournal.com.br
www.bjournal.com.br
Braz J Med Biol Res, March 2010, Volume 43(4) 377-389
Cardiac gene expression and systemic cytokine profile are
complementary in a murine model of post-ischemic heart failure
S. Lachtermacher, B.L.B. Esporcatte, F. Montalvão, P.C. Costa, D.C. Rodrigues, L. Belem, A.
Rabischoffisky, H.C.C. Faria Neto, R. Vasconcellos, S. Iacobas, D.A. Iacobas, H.F.R. Dohmann,
D.C. Spray, R.C.S. Goldenberg and A.C. Campos-de-Carvalho
Institutional Sponsors
Cardiac gene expression and systemic
cytokine profile are complementary in a
murine model of post-ischemic heart failure
S. Lachtermacher
1*, B.L.B. Esporcatte
1*, F. Montalvão
1, P.C. Costa
1,
D.C. Rodrigues
1,
L. Belem
2, A. Rabischoffisky
2, H.C.C. Faria Neto
3,
R. Vasconcellos
4, S. Iacobas
5, D.A. Iacobas
5, H.F.R. Dohmann
2,
D.C. Spray
5, R.C.S. Goldenberg
1and A.C. Campos-de-Carvalho
1,51Instituto de Biofísica Carlos Chagas Filho, Universidade Federal do Rio de Janeiro, Rio de Janeiro, RJ, Brasil 2PROCEP, Centro de Ensino e Pesquisa, Hospital Pró-Cardíaco, Rio de Janeiro, RJ, Brasil 3Departamento de Fisiologia e Farmacodinâmica, Fundação Oswaldo Cruz, Rio de Janeiro, RJ, Brasil 4Departamento de Imunobiologia, Instituto de Imunologia, Universidade Federal Fluminense, Niterói, RJ, Brasil
5Albert Einstein College of Medicine, Bronx, NY, USA
Abstract
After myocardial infarction (MI), activation of the immune system and inflammatory mechanisms, among others, can lead to
ventricular remodeling and heart failure (HF). The interaction between these systemic alterations and corresponding changes in the heart has not been extensively examined in the setting of chronic ischemia. The main purpose of this study was to
inves-tigate alterations in cardiac gene and systemic cytokine profile in mice with post-ischemic HF. Plasma was tested for IgM and IgG anti-heart reactive repertoire and inflammatory cytokines. Heart samples were assayed for gene expression by analyzing hybridization to AECOM 32k mouse microarrays. Ischemic HF significantly increased the levels of total serum IgM (by 5.2-fold) and total IgG (by 3.6-fold) associated with a relatively high content of anti-heart specificity. A comparable increase was observed in the levels of circulating pro-inflammatory cytokines such as IL-1β (3.8X) and TNF-α (6.0X). IFN-γ was also increased by 3.1-fold in the MI group. However, IL-4 and IL-10 were not significantly different between the MI and sham-operated groups.
Chemokines such as MCP-1 and IL-8 were 1.4- and 13-fold increased, respectively,in the plasma of infarcted mice. We
identi-fied 2079 well annotated unigenes that were significantly regulated by post-ischemic HF. Complement activation and immune response were among the most up-regulated processes. Interestingly, 21 of the 101 quantified unigenes involved in the inflam
-matory response were significantly up-regulated and none were down-regulated. These data indicate that post-ischemic heart
remodeling is accompanied by immune-mediated mechanisms that act both systemically and locally.
Key words: Experimental post-ischemic heart failure; Anti-heart antibodies; Cytokines; Immunoarray; RNAm - Microarray
Introduction
Correspondence: A.C. Campos-de-Carvalho, Instituto de Biofísica Carlos Chagas Filho, UFRJ, CCS, Bloco G, 21949-900 Rio de Janeiro, RJ, Brasil. Fax: +55-21-2280-8193. E-mail: [email protected]
*These authors contributed equally to this study.
Received April 28, 2009. Accepted February 18, 2010. Available online March 5, 2010. Published April 12, 2010.
Myocardial infarction (MI) is the most frequent cause of heart failure (HF), and the leading cause of death in
Western countries (1). Several factors, including inflam -mation, apoptosis and immune-mediated mechanisms, culminate in adaptive changes of ventricular size, shape and function known as ventricular remodeling, which leads
to HF (2,3). The inflammatory reaction after acute MI (AMI)
is coordinated by the activity of a series of cytokines, which
is a prerequisite for healing and scar formation (4-6). IFN-γ,
a typical cytokine involved in the Th1-type response (7), is
significantly increased in patients after AMI (8). The pro-inflammatory cytokines IL-1 (9) and TNF-α (10) have also been implicated in the inflammatory response after AMI.
Chemokine expression is markedly up-regulated in AMI and
may play an important role in regulating leukocyte infiltration
and activity and in modulating infarct angiogenesis as well
as fibrous tissue deposition (11). Although the immune-in
(12), far fewer studies have examined this response in the setting of healed myocardial infarctions leading to chronic heart failure (13,14). Furthermore, there have been few
publications correlating the systemic immune-inflammatory
response to changes in gene expression in the chronically ischemic myocardium. Therefore, in the present study, we
have characterized the immune and inflammatory profile
persisting 7 weeks after the induction of ischemic heart failure in mice by determining serum levels of cytokines and of the anti-heart reactive IgM and IgG antibody repertoire and by concomitantly determining the cardiac gene
activa-tion profile by microarray analysis.
Material and Methods
This investigation conforms to the Guide for the Care and Use of Laboratory Animals (Institute of Laboratory Animal Research, Commission on Life Science, National Research Council, USA) and was approved by the Animal Committee of UFRJ.
Animals
Male and female C57BL/6 mice aged 8-10 weeks (20.5-25.5 g) were obtained from the Animal Facility of the Federal University of Rio de Janeiro. Mice were housed at controlled temperature (23°C) with a 12:12-h light-dark cycle and received standard mouse chow and water ad libitum.
Ischemic heart failure
Permanent myocardial infarcts were produced by liga-tion of the descending branch of the left coronary artery. Animals were anesthetized by an intraperitoneal injection of ketamine (40 mg/kg) and xylazine (80 mg/kg), placed in the supine position and intubated. Mice were ventilated with a volume-cycled ventilator (100 cycles/min; Harvard
Apparatus, USA) with a volume sufficient to adequately
expand but not overexpand the lungs. After a left anterior thoracotomy, the heart was exposed and the suture (8-0 mononylon) was passed under the artery at a position ~1 mm from the tip of the normally positioned left auricle. The chest was then closed and the skin sutured with 5-0 nylon. Sham operations were carried out by the same method but without tying the suture on the left anterior descending artery (15).
Electrocardiography
Briefly, 24 h before infarction mice were anesthetized
and electrodes were implanted subcutaneously in each limb and extended to the back of the animal where a three-prong lead was exteriorized in order to obtain a ventral plane 3-lead ECG in awake animals. ECG were recorded continuously (Power Laboratory, ADInstruments, USA), and the parameters analyzed were: heart rate, ECG intervals [PR, QRS, QT, and QTc using Bazett’s methods (QTc = QT/ RR1/2)], ECG wave amplitude and duration (P, QRS, T),
ST amplitude, and presence of Q wave in L1, which were recorded starting 24 h after surgery and thereafter.
Myocardial damage markers
Blood was obtained from the caudal vein before and 3 days after surgery. The distal one-half centimeter of the tail was clipped and a capillary pipette was used to collect two
samples of 80 μL each from the bleeding surface. Immedi -ately after collection, the cut surface of the tail was cauterized with styptic powder. Serum cardiac troponin I (cTnI) was measured using the ADVIA Centaur® immunoassay (Bayer Diagnostics, Germany), which has a sensitivity and assay range of 0.1-50 ng/mL. Serum creatine kinase isoenzyme MB (CK-MB) was measured by chemiluminescence immu-noassay using the IMMULITE System (Diagnostic Products Corporation, Germany).
Echocardiography
We used an echocardiography color-system (GE vivid 7 Megas) equipped with a 12-MHz electronic-phased-array transducer at a rate of 100 frames/s. All images were ac-quired at a depth setting of 6 mm using direct chest contact. Under ketamine and xylazine anesthesia, the animal’s chest was shaved and the animal was maintained either in left lateral decubitus or in the supine position. Subcutane-ous electrodes were taped to the miceallowing ECG for observation of heart rate. Images were obtained from the left parasternal window. Short-axis 2-dimensional views of the left ventricle (LV) were taken at the level of the papillary muscles to obtain the M-mode recordings. Anterior and pos-terior end-diastolic and end-systolic wall thickness, LV, left atrium and aorta internal dimensions, and shortening frac-tion were measured according to the leading-edge method of the American Society of Echocardiography (ASE) (16).
Transmitral and aortic flow pulsed Doppler measurements
were acquired in the parasternal long-axis view. Mice were followed sequentially by comparing pre- and post-procedure measurements in the same animal. Normalization for
an-thropometric measures did not show significant differences.
All post-infarction analyses were performed at 49 days after surgery by the same echocardiographist, who was blind to group allocation (sham-operated or MI).
Evaluation of serum immunoglobulin (Ig) concentrations
Briefly, 96-well flat-bottom plates were coated overnight at 4°C with 3 μg/mL purified goat anti-mouse IgM or IgG
(Southern Biotech, USA), diluted in 50 mM phosphate
buffer, pH 8.0. After blocking nonspecific binding sites with
Tween 20, the reaction was developed with 3,3’,5,5’-tetra- methyl benzidine substrate (Sigma). The enzymatic reaction was stopped with H2SO4 and the plates were read at 450
nm on a microplate spectrophotometer (SOFTmax Pro;
Molecular Devices, USA). Unlabeled purified IgM and IgG
(Southern Biotech) were used as standards. Serum IgM or
IgG concentrations are reported as μg/mL.
Assessment of serum anti-heart Ig repertoire
Murine hearts (at least 5 hearts per group) were mechanically disrupted with a homogenizer (Polytron; Brinkmann Instruments, USA) with appropriate buffer (2% SDS, 5% 2-mercaptoethanol and 62.5 mM Tris/HCl, pH 6.8) on ice, as described previously (17). The extract was sonicated at maximum power for 2 min and then boiled for 10 min. The samples were cooled to 4°C and centrifuged,
the supernatant was collected and filtered (5-μm pores), and
protein concentration was measured by spectrophotometry at 280/260 nm. Aliquots of heart extract were stored at -80°C
and defrosted only once, prior to use. Heart extract (600 μg)
was submitted to electrophoresis on 10% polyacrylamide gels under reducing conditions in a Mighty Small II SE 250
apparatus (Hoefer Scientific Instruments, USA). Proteins were transferred onto nitrocellulose membranes (0.2 μm;
Schleicher and Schull, Germany) using a Semi-Dry Elec-troblotter B (Ancos, Denmark) and blocked overnight with PBS-0.2% Tween 20. Incubation of sera from infarcted,
sham-operated and control mice (50 μL 1:20 dilution in
PBS-0.2% Tween 20) with the blotted membrane was per-formed using a 28-channel Miniblot System (Immunetics Inc., USA). After 4-h incubation at room temperature, the membranes were extensively washed and incubated with the secondary antibodies coupled to alkaline phosphatase
specific for mouse IgM or IgG antibodies (Southern Bio -tech) for 90 min. After washings, immunoreactivities were revealed with nitroblue tetrazolium/bromo-chloro-indolyl phosphate substrate (Promega, USA) in appropriate buf-fer (100 mM Tris/HCl, pH 9.5, 100 mM NaCl, 5 mM MgCl2)
and the reaction was stopped after 3-5 min with distilled
water. Immunoreactivities were quantified by optical scan
-ning of the membranes in the reflective mode, followed by computer-based densitometry. Total protein profiles were
acquired after staining of the blotted proteins with colloidal gold (Protogold), and then submitted to a second densito-metric quantitation. Data analysis was done on MacIntosh computers (Apple Computer Inc., USA) with the IGOR software (Wavemetrics, USA) and special macros written for the analysis of Western blots. Protein and
immunoreactiv-ity profiles were superimposed after migration distortions
were corrected to allow the semi-quantitative comparison of immunoreactivity by multivariate statistics - principal component analysis (PCA) (18).
Cytokine analysis
Blood samples were collected (from at least 5 animals
per group) between 10:00 and 12:00 am 49 days after surgery as described for the myocardial damage markers. Blood was placed on ice and plasma was collected by centrifugation at 800 g for 15 min at 4°C, aliquoted and stored at -80°C until the day of analysis. A Multiplex cytokine
kit [IFN-γ, TNF-α, IL-1β, IL-4, IL-6, KC (IL-8), IL-10, IL-12
(p40), MCP-1] was used and the assay performed
accord-ing to manufacturer instructions (Bio-Rad, USA). Briefly,
the appropriate cytokine standards and samples (50 µL) diluted in plasma dilution buffer were added to the wells of
a filtered plate. The samples were incubated with 50 µL of
the antibody-coupled microsphere set (2000 beads/well) at room temperature for 30 min on a plate shaker (set to 300
rpm) in the dark and filter washed three times with 100 µL
wash buffer. Freshly diluted secondary/detection antibody (25 µL/well) was added to the wells and then incubated at room temperature on a plate shaker for 30 min in the dark
and filter washed three times with 100-µL wash buffer. Fifty microliters of streptavidin-phycoerythrin (16 μg/mL
in assay buffer) was added to the wells and incubation at
room temperature continued for the first 10 min on a plate shaker. Unbound analytes were filtered through the wells
using the vacuum manifold and the bound beads washed three times with 100-µL wash buffer. Following the last wash step, 125-µL assay buffer was added to each well and the plate placed for 1 min on a plate shaker set at 500 rpm, followed by reduced speed to 300 rpm for 3 min. Fifty microliters of sample was analyzed on the Bio-Plex system (Bio-Rad) according to manufacturer instructions. Data analyses of all assays were performed with the Bio-Plex Manager software (19).
Microarray analysis
We compared RNA samples extracted from whole hearts of control (N = 4) and healed infarcted (N = 4) mice by analyzing hybridization to AECOM 32k mouse microarrays (https://www.ncbi.nlm.nih.gov/geo/query/acc. cgi?acc=GPL5371) spotted with Operon version 3.0 70-mer oligonucleotides. The hybridization protocol, the slide type and the scanner settings were uniform throughout the entire experiment to minimize the technical noise. Thirty micrograms total RNA extracted in Trizol from each heart
was reverse transcribed in the presence of fluorescent Alexa
Fluor® 647-aha-dUTPs to obtain “red”-labeled cDNA. Eight
samples, each consisting of 30 μg total RNA, of our universal
reference (20) prepared from 10 adult mouse tissues (aorta, brain, heart, kidney, liver, lung, ovary/testicle, spleen, and stomach - equal amounts from males and females) were
reverse transcribed in the presence of fluorescent Alexa
Fluor® 555-aha-dUTPs to obtain “green”-labeled cDNA.
an Axon 4000B dual-laser scanner. Locally corrupted and saturated spots, as well as those for which the foreground
median fluorescence did not exceed double the median local background fluorescence on one slide, were eliminated from
the analysis of all slides, with four independent measure-ments (in biological replicas) thus being obtained for each gene in each condition. Microarray data were processed as indicated in previous studies (20,21). Thus, we used a normalization algorithm that alternated intra-chip and inter-chip normalization until the residual error was below 5% in subsequent steps. The spots probing the same gene were organized into redundancy groups to which we applied Bonferroni adjustment. Considering variance among the 4 control and 4 MI hearts (using the Student heteroscedastic
t-test of equality of the means of the distributions with a Bonferroni-type adjustment), all target genes that showed
statistically significant (P < 0.05) changes of at least 1.5-fold
were considered to be differentially expressed. GenMapp (22) and MappFinder softwares (www.genmapp.org) (23) and databases were used to identify the most affected Gene Ontology categories.
Real-time RT-PCR
The level of mRNA expression of control (N = 4) and infarcted (N = 4) mouse heartswas measured by real-time RT-PCR (qRT-PCR) to validate the microarray experiment.
Genes involved in the inflammatory response, Hif1a, Ifnar1,
Nos2, Mmp23, and Tlr4, were chosen. The same total RNA preparation was used in the microarray and real-time experiments. The cDNA was prepared using a High Capac-ity cDNA Reverse Transcription kit (Applied Biosystems, USA) following manufacturer instructions. The forward and reverse primer sequences used in the qRT-PCR assay are listed below.qRT-PCR amplifications were performed in a 96-well plate of the ABI Prism 7500 Fast Sequence Detector
(Applied Biosystems) in a reaction mixture of 25 μL, which contained 1 μL 100X diluted cDNA, 12.5 μL 2X Power
SYBR Master Mix (Applied Biosystems) and 150 nM of each primer. Actb (Gene bank accession number NC_000071): Forward (5’-3’) CATCACTATTggCAACgAgCg, Reverse (5’-3’) ATGGATGCCACAGGATTCCA. Hif1a (Gene bank accession number NM_010431): Forward (5’-3’) TCAAgTC AgCAACgTggAAg, Reverse (5’-3’) TATCgAggCTgTgTCg ACTg. Ifnar1 (Gene bank accession number NC_000082): Forward (5’-3’) TCCCCgCAgTATTgATgAgT, Reverse (5’-3’) CTggTCTgTgAgCTgTACTT. Mmp23 (Gene bank ac-cession number NC_00070.5): Forward (5’-3’) CCAC GGTGGCATTCACTTTGATGA, Reverse (5’-3’) CAATg TggCATTgAggTgCATgAg. Nos2 (Gene bank accession number NM_010927): Forward (5’-3’) TCCCTgATgACATT CCTTCTT, Reverse (5’-3’) CATTggAAgTgAAgCgTTTCg.
Tlr4 (Gene bank accession number NM_021297): Forward (5’-3’) CAgCTgggCTgTACAAACCTT, Reverse (5’-3’) TgAg CCACATTgAgTTTCTTTA.
The amplification program was 55°C for 2 min, 95°C
for 10 min, followed by 40 cycles at 95°C for 15 s and annealing at 60°C for 1 min. The qRT-PCR melting curve
data were collected to check PCR specificity. Each cDNA
sample was tested in triplicate, and a corresponding non-reverse transcriptase reaction was included as a control for DNA contamination. In addition, the expression of the
chosen genes was normalized to that of β-actin as an
internal control.
The relative quantities of gene-specific mRNA expres -sion were determined by the comparative CT method
expressed by the formula 2-(∆Ct) where Ct refers to the
“threshold cycle” and is determined for each plate with 7500 real-time PCR System Sequence Detection Software
(Applied Biosystems). ∆Ct is the difference between the Ct
of the target mRNA and the Ct of the endogenous control
(β-actin). The fold-change in the expression of the target
genes in response to the infarct was calculated as follows:
mean ± SD of 2-(∆Ct) for each group followed by the deter -mination of the ratio between infarcted and normal.
Statistical analysis
Animals were divided into three experimental groups: non-operated control (N = 25), sham-operated (N = 7), and infarcted mice (N = 30). All groups were analyzed together by investigators blind to which animals were sham-operated or infarcted. All data are reported as means ± SD. Differences between the values obtained for control, sham-operated and infarcted groups were evaluated by one-way analysis of variance (ANOVA) followed by the Bonferroni post-test. Nonparametric variables were evaluated by the
Kruskal-Wallis test and the Dunn post-test. Statistical significance was defined by P < 0.05.
Results
Myocardial infarction and assessment of heart failure
Surgical mortality was 23% (7/30) and during the first 2
weeks post-infarction 43% (10/23) of the animals died, with no further death until the end of the study at 7 weeks. No sham-operated mice (N = 7) died during the same period. Interruption of left anterior coronary perfusion led to the development of ST-segment elevation and “Q” waves after 24 h (data not shown). Infarcted mice also developed atrial and ventricular conduction alterations such as widened P, QRS complex and longer rate-corrected QT intervals (Table
1). Myocardial infarction was confirmed by CK-MB and cTnI
levels (data not shown), whichshowed a significant increase 3 days after surgery compared to sham-operated and control
groups (P < 0.001). cTnI levels (>0.3 ng/mm3) were increased
in 95% of these animals. No sham-operated animal had a cTnI concentration above 0.3 ng/mm3 after surgery.
There was a significant impairment of global LV function
measured 7 weeks after MI (Table 2). The shortening fraction
of the LV of an MI mouse (Figure 1B) shows anterior wall thinning associated with hypokinesia when compared with sham-operated and control groups and with the posterior intact wall. The HF group developed diastolic dysfunction
confirmed by an elevated E/A ratio (4.51 ± 1.09 for HF vs
3.25 ± 0.78 for control animals). There was no significant
difference in heart rate (HR) under a ketamine/xylazine anesthesia regimen (Table 2). Myocardial infarction sizes were about 20 to 30% of the LV in the chronic
state (data not shown). During sacrifice the ma -jority of infarcted mice exhibited pleural effusion consistent with HF.
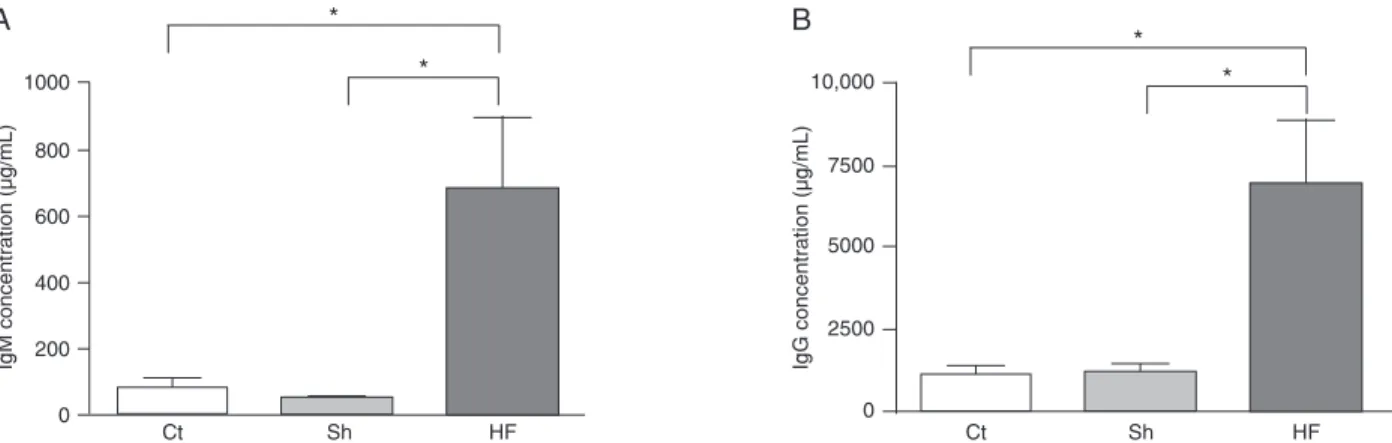
Post-ischemic heart failure results in a sustained increase in serum IgM and IgG reactivities directed at heart auto-antigens
Sera of post-ischemic HF mice were ana-lyzed for total IgM and IgG levels by quantita-tive ELISA. While non-manipulated or sham-operated mice presented comparable levels of both IgM (Figure 2A) and IgG (Figure 2B), a dramatic increase in both immunoglobulin
isotypes was identified in the serum of infarcted
mice 7 weeks later. To evaluate the impact of post-ischemic HF on the serum levels of anti-heart reactive antibodies we applied a semi-quantitative immunoblot technique. When serum IgM and IgG from individual mice were assayed for reactivity against syngeneic heart extracts we observed that the reactive patterns were similarin all animals of the same experimental group. As expected, both control and sham-operated mice exhibited comparable anti-heart serum IgM or IgG repertoires, characterized by a natural antibody repertoire weakly reactive to heart antigens. In contrast, mice submitted to experimental post-ischemic HF exhibited remarkably higher levels of anti-heart reactive IgM and IgG in their sera 7 weeks after surgical intervention (Figure 3).
Western blot densitometry profiles displayed extensive increases in the anti-heart profiles of
both IgM and IgG reactivities. This alteration
reflects not only the enhancement of existing natural antibody specificities, but also the emer
-gence of new IgM and IgG anti-heart specificities
in the serum of HF mice (Figure 3). When the
scores obtained from densitometry profiles of
anti-heart reactivity were subdivided taking into account individual reactivity for each mouse from control and HF groups and submitted to a classical multivariate statistical treatment, i.e., PCA, the differences between these groups were
prominent. The first two principal components
of both IgM and IgG reactivities clearly
segre-gated HF and control mice into non-overlapping areas of
the two-dimensional space defined by the first two PCA
factors. These principal components are related to the
impressive increase of serum IgM and IgG specificities for
heart antigens occurring and persisting after the
establish-ment of HF (Figure 3B, inset). There were no significant
differences between control and sham-operated groups (data not shown).
Table 1. Electrocardiographic analysis of C57BL/6 mice.
Control (N = 25)
Sham-operated (N = 7)
Myocardial infarction (N = 10)
Heart rate (bpm) 592 ± 105 679 ± 80 532 ± 78+ Amplitude
P wave (mV) 0.088 ± 0.033 0.118 ± 0.036 0.147 ± 0.068 Q wave (mV) 0.003 ± 0.014 0.031 ± 0.045 0.221 ± 0.276*+ QRS complex (mV) 0.608 ± 0.254 0.760 ± 0.392 0.357 ± 0.316+ ST segment (mV) 0.004 ± 0.003 0.084 ± 0.087 0.397 ± 0.363*+ T wave (mV) 0.106 ± 0.063 -0.024 ± 0.200 -0.140 ± 0.270* Duration
P wave (ms) 11 ± 2 12 ± 1 14 ± 2*
PR interval (ms) 34 ± 7 32 ± 5 37 ± 6
QRS (ms) 11 ± 2 14 ± 3 15 ± 2*
QT interval (ms) 22 ± 6 39 ± 13 68 ± 49*+
QTc 71 ± 13 177 ± 147 201 ± 143*
Data are reported as means ± SD. QTc = QT corrected interval. *P < 0.05 vs control; +P < 0.05 vs sham-operated (one-way ANOVA).
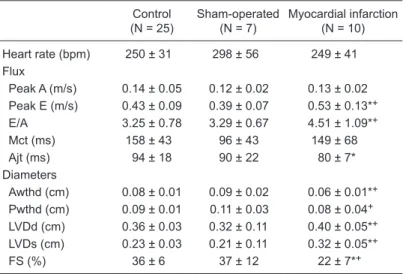
Table 2. Echocardiographic analysis of mice with myocardial infarction.
Control (N = 25)
Sham-operated (N = 7)
Myocardial infarction (N = 10)
Heart rate (bpm) 250 ± 31 298 ± 56 249 ± 41 Flux
Peak A (m/s) 0.14 ± 0.05 0.12 ± 0.02 0.13 ± 0.02 Peak E (m/s) 0.43 ± 0.09 0.39 ± 0.07 0.53 ± 0.13*+ E/A 3.25 ± 0.78 3.29 ± 0.67 4.51 ± 1.09*+
Mct (ms) 158 ± 43 96 ± 43 149 ± 68
Ajt (ms) 94 ± 18 90 ± 22 80 ± 7*
Diameters
Awthd (cm) 0.08 ± 0.01 0.09 ± 0.02 0.06 ± 0.01*+ Pwthd (cm) 0.09 ± 0.01 0.11 ± 0.03 0.08 ± 0.04+ LVDd (cm) 0.36 ± 0.03 0.32 ± 0.11 0.40 ± 0.05*+ LVDs (cm) 0.23 ± 0.03 0.21 ± 0.11 0.32 ± 0.05*+
FS (%) 36 ± 6 37 ± 12 22 ± 7*+
Data are reported as means ± SD. A = transmitral late filling velocity; E = transmitral early filling velocity; Mct = mitral closure time; Ajt = aortic ejection
time; Awthd = diastolic anterior wall thickness; Pwthd = diastolic posterior wall thickness; LVDd = diastolic left ventricle (LV) dimension; LVDs = systolic LV
Effect of ischemic heart failure on circulating
cytokine profile
In an independent time course experiment, we observed
a slight but significant increase in plasma concentrations of
all cytokines tested shortly after MI or sham surgery (data
not shown), reflecting alterations induced by the surgical
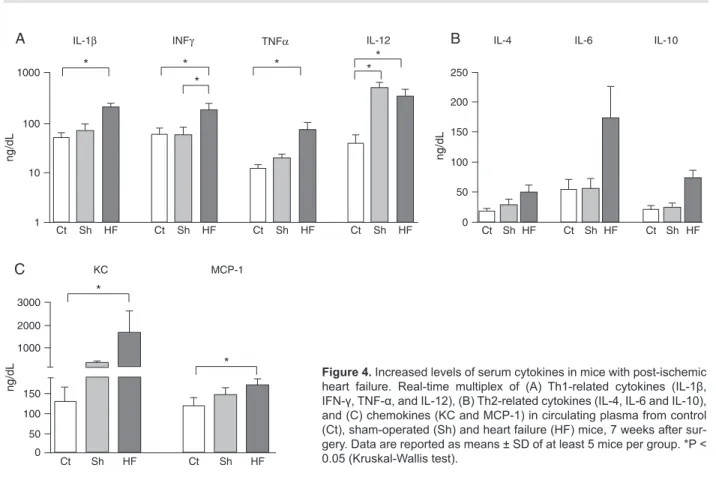
procedures. When the assessment was performed 7 weeks post-surgery we observed that most cytokines had returned to control levels in the sham-operated group. One exception was IL-12, which showed persistent elevation in the serum of the sham-operated mice even after 7 weeks. In contrast, post-ischemic HF mice exhibited persistently elevated
levels of circulating cytokines (Figure 4). IL-1β (P = 0.033) and TNF-α (P = 0.004), pro-inflammatory cytokines, were significantly higher in plasma 7 weeks after MI compared to control. Moreover, INF-γ, a typical Th1 response mediator,
was higher (P = 0.031) in the MI group than in the other
groups. In contrast, the anti-inflammatory cytokines IL-4 (P = 0.17) and IL-10 (P = 0.19) did not differ significantly among groups (Figure 4B). Importantly, a highly significant increase
was observed in the plasma levels of the chemokines KC (IL-8 murine ortholog) (P = 0.008) and MCP-1 (Ccl2; P = 0.018) in the infarcted group compared to control.
Differential gene expression profile in post-ischemic
heart failure mouse hearts
Whole heart tissues from HF (7 weeks post-MI) or control mice were sampled to examine changes in gene expression associated with the disease. The experiment was performed according to Minimum Information about a Microarray Experiment (MIAME) standards and the re-sults were deposited in http://www.ncbi.nlm.nih.gov/sites/ entrez?db=geo as series GSE18703. A total of 14,755 distinct genes with known protein products were probed
Figure 2. Increased levels of serum IgM and IgG in mice with post-ischemic heart failure. Serum IgM (A) and IgG (B) concentrations in post-ischemic heart failure (HF) or sham-operated (Sh) mice were tested by ELISA 7 weeks after surgery. Data for non-manipulated
age-matched control C57BL/10 mice are also presented (Ct). Data are reported as means ± SD for at least 5 mice per group. *P <
0.0001, HF mice vs Ct and Sh mice (Kruskal-Wallis test).
Figure 1. M-mode echocardiography. Representative parasternal short axis views 3 weeks after surgery of sham-operated (A) and infarcted (B) mice. Observe the wall thinning and decrease in anterior wall motion (arrow) in the infarcted mouse.
in this experiment. Of these, 1989 (13.48%) were signifi -cantly up-regulated and 90 (0.61%) were down-regulated in post-ischemic HF hearts. Using the GenMapp software to categorize Gene Ontology terms, we examined whether certain cellular pathways encoded by altered genes were prominently affected in the infarcted myocardium. Down-regulated genes predominantly represented G-protein signaling, cell communication, respiratory chain complex IV, regulation of secretion, z disc, sarcomere and sarcoplasmic reticulum, gluconeogenesis, and voltage gated chloride channel gene products. Up-regulated genes predominantly encoded molecules involved in complement activation, immune response, protein degradation (cysteine-type
and ubiquitin protease as well as aminopeptidase
activ-ity, modification-dependent protein catabolism), tumor
necrosis factor binding, Ca2+ transport, β-catenin binding,
cytoskeleton organization, and biogenesis gene products. Known genes were sorted on the basis of their functions
such as immune and inflammatory response, apoptosis, cell
proliferation and differentiation. We validated by real-time
PCR five of the genes that were found by the microarray
analysis to be either up- (Hif1a, Ifnar1, Mmp23, and Tlr4) or not regulated (Nos2). These results, which quantitatively agreed with those of the microarray analysis, are illustrated in Figure 5.
Figure 3. Increased anti-heart antibodies in mice with post-ischemic heart failure. A, Semi-quantitative immunoblot of IgM and IgG reactivity to autologous heart extract was scored for individual control (Ct), sham-operated (Sh) and heart failure (HF) mice 7 weeks after surgery. B, Densitometric profiles of serum IgM and IgG immunoreactivities of individual control (black lines) and HF (red lines) mice to heart extracts are shown. Reactivity intensities (absorbance) and migration distances are reported as arbitrary units. The values of the individual IgM or IgG immunoreactivity intensity (peak value) were submitted to principal component analysis. Scores of
the resulting first two principal components of the individual Ct and HF mice are shown in two-dimensional plots in the insets: control (open squares) and heart failure mice (black squares). Data are reported as means ± SD of at least 5 mice per group. P < 0.05, HF
Gene expression patterns indicative of an immune
inflammatory response
A specific objective of this study was to identify late
changes in myocardial transcription of immune-mediated
inflammatory response genes after the establishment of post-ischemic HF. Of the 184 quantified genes known to be related to the inflammatory/immune/defense response
(see Table 3 and Supplementary Tables 1A and 1B for all
quantified genes in this category), we found that 38 (20.7%; Table 3) were significantly (>1.5-fold, P < 0.05) up-regulated
after chronic MI. In addition, 37 other genes had a change
exceeding 1.5-fold but increases were not significant (P > 0.05; see Supplementary Table 1A), so that 41% of all sampled genes related to the inflammatory/immune/de
-fense response showed >1.5-fold up-regulation. Among the significantly up-regulated genes there were 3 chemokines
(Ccl8, Ccl9, and Cxcl14) and a chemokine-like receptor, 3 interferon receptors (Ifnar1, Ifngr1, Ifngr2), 6 interferon
activated genes (Ifi204, Ifi205, Isg20, Icsbp1, Ifih1, Ifi1),
2 interleukins (Il13, Il1f9), 4 interleukin receptors (Il1r1, Il13ra1, Il2rg, Il22ra1), 4 interleukin-1 receptor-associated kinases (Irak1, Irak2, Irak3, Irak4), and 7 tumor necrosis factor receptors (Tnfrsf1a, Tnfrsf1b, Tnfrsf10b, Tnfrsf12a,
Tnfrsf19l, Tnfrsf22, Tnfrsf25). As expected, no inflammation-related gene was found to be significantly down-regulated, although the change in the expression of 5 (i.e., <3%) of
them (Cklfsf2a, Cxcl12, Il17e, Il17f, Tnfsf15) exceeded
1.5-fold. The fact that several cytokine and chemokine genes
were transcriptionally elevated indicates pro-inflammatory
properties within chronically injured myocardial tissue.
Figure 5. Real-time PCR validation of changes in the
expres-sion of five genes that were found to be altered in microarray
analysis (Hif1a, Ifnar1, Mmp23, Nos2, and Tlr4). Fold changes for each gene indicate that expression changes determined by each method are positively correlated for these sampled genes.
Linear regression curve with dotted line as 95% confidence inter -val (Pearson R = 0.968, P = 0.0066).
Figure 4. Increased levels of serum cytokines in mice with post-ischemic
heart failure. Real-time multiplex of (A) Th1-related cytokines (IL-1β, IFN-γ, TNF-α, and IL-12), (B) Th2-related cytokines (IL-4, IL-6 and IL-10),
and (C) chemokines (KC and MCP-1) in circulating plasma from control (Ct), sham-operated (Sh) and heart failure (HF) mice, 7 weeks after
sur-gery. Data are reported as means ± SD of at least 5 mice per group. *P <
The majority of receptor genes regulated after chronic
MI were related to TNF-α, which has a critical role in diverse
cellular events, including cell proliferation, differentiation and apoptosis. In agreement with systemic measurements of protein levels, we did not observe transcriptional regula-tion of expression of IL-4, IL-6 or IL-10 or their receptors in cardiac tissue 7 weeks after MI. In contrast, other
in-terleukin and inin-terleukin receptors and Toll-like receptors were up-regulated in the post-ischemic healed heart tissue.
We also identified a significant up-regulation of IgG Fc
receptor (FcgR3), related to antibody-dependent cellular cytotoxicity (x = 2.70, P = 0.02). In addition, chemokine monocyte chemo-attractant protein (Ccl8), also known as monocyte chemo-attractant protein-2 (MCP-2), was highly
Table 3. Significant regulation of genes involved in the inflammatory/immune defense response of
infarcted mice.
Name Symbol X P
Chemokine (c-c motif) ligand 8 Ccl8 9.70 0.024
Chemokine (c-c motif) ligand 9 Ccl9 2.31 0.040
Chemokine (c-x-c motif) ligand 14 Cxcl14 2.31 0.027
Chemokine-like receptor 1 Cmklr1 1.82 0.004
Complement component 3 C3 2.68 0.015
Gamma-glutamyltransferase-like activity 1 Ggtla1 2.16 0.026
Immunity-related gtpase family, m Irgm 1.81 0.009
Interferon (alpha and beta) receptor 1 Ifnar1 1.51 0.016
Interferon activated gene 204 Ifi204 3.21 0.000
Interferon activated gene 205 Ifi205 5.06 0.001
Interferon consensus sequence binding protein 1 Icsbp1 1.55 0.025
Interferon gamma receptor 1 Ifngr1 2.02 0.013
Interferon gamma receptor 2 Ifngr2 2.01 0.015
Interferon induced with helicase c domain 1 Ifih1 1.58 0.006
Interferon-induced protein 35 Ifi35 1.54 0.039
Interferon-stimulated protein Isg20 1.58 0.012
Interleukin 1 family, member 9 Il1f9 1.69 0.018
Interleukin 1 receptor, type 1 Il1r1 2.53 0.024
Interleukin 13 Il13 2.11 0.017
Interleukin 13 receptor, alpha 1 Il13ra1 1.93 0.005
Interleukin 2 receptor, gamma chain Il2rg 1.91 0.047
Interleukin 22 receptor, alpha 1 Il22ra1 2.17 0.047
Interleukin 6 signal transducer Il6st 2.71 0.018
Interleukin-1 receptor-associated kinase 1 Irak1 1.57 0.038 Interleukin-1 receptor-associated kinase 2 Irak2 3.27 0.000 Interleukin-1 receptor-associated kinase 3 Irak3 2.95 0.030 Interleukin-1 receptor-associated kinase 4 Irak4 1.61 0.015 Nuclear factor of activated t-cells, cytoplasmic, calcineurin-dependent 4 Nfatc4 1.94 0.015
Toll interacting protein Tollip 1.50 0.048
Toll-like receptor 2 Tlr2 1.65 0.005
Toll-like receptor 4 Tlr4 3.15 0.001
Tumor necrosis factor receptor superfamily, member 10b Tnfrsf10b 1.68 0.043 Tumor necrosis factor receptor superfamily, member 12a Tnfrsf12a 2.37 0.001 Tumor necrosis factor receptor superfamily, member 19-like Tnfrsf19l 1.61 0.010 Tumor necrosis factor receptor superfamily, member 1a Tnfrsf1a 1.52 0.008 Tumor necrosis factor receptor superfamily, member 1b Tnfrsf1b 1.92 0.006 Tumor necrosis factor receptor superfamily, member 22 Tnfrsf22 1.80 0.039 Tumor necrosis factor receptor superfamily, member 25 Tnfrsf25 1.80 0.025
expressed in the post-ischemic heart tissue, achieving a 9.7-fold increase (Table 3).
Discussion
After myocardial necrosis, sequestered cardiac antigens are exposed and presented to the immune system. This trig-gers both cellular and humoral immune responses consisting of activation of cytotoxic T cells and production of anti-heart antibodies (5,24-26). We report here that C57BL/6 mice submitted to MI surgery presented remarkably higher levels of circulating IgMs and IgGs with increased auto-reactivity towards heart proteins, which persisted during the chronic stage of the disease. In acute MI, various proteins have
been identified as targets of antibodies, including myosin
(27), troponin I (16) and actin (28).
We report that a broad array of anti-heart antibody
specificities are increased in the serum of post-ischemic HF mice. Our data suggest that cardiac-specific antigens may
trigger the expansion and differentiation of disease-related auto-reactive B cells, which are still active even after the healing process has occurred. However, the relationship
between the specificity of the secreted antibodies and the
outcome of heart disease remains to be determined. Re-markably, the increased expression of FcgR3 genes in the
healed heart was also identified. This suggests an active
function of antibodies mediating myocyte destruction by cytotoxicity and/or apoptosis, even 7 weeks after MI.
Sensitization to heart antigens after acute MI can be corre-lated with the increase in plasma cytokines and chemokines. These alterations can play an active role in the initiation,
progression and maintenance of inflammatory responses by promoting cell activation and influx into the injured tissue,
which lead to myocardial dysfunction (29). We demonstrated that persistently increased levels of circulating cytokines/ chemokines course with concomitant up-regulation of car-diac genes encoding cytokine/chemokine receptors after the establishment of post-ischemic HF. The imbalance between
pro- and anti-inflammatory cytokines may determine the
outcome of the healing and cardiac remodeling after acute
MI. Pro-inflammatory cytokines such as IL-1 and TNF-α are
increased in plasma after AMI (12) and we have now shown that these cytokines remain elevated even 7 weeks after MI
when HF has developed. At first, these cytokines are determi -nant for the healing process and restoration of cardiac function through activation of matrix metalloproteinases, inhibition of collagen formation, and promotion of cell differentiation (30). However, these cytokines can also promote unfavorable
events leading to chronic dilation, and finally lethal HF (14). The increase in serum INF-γ and its cardiac receptor gene suggests that the Th1 response plays a significant role in the evolution of HF. Anti-inflammatory cytokines such as IL-10 and TGF-β would provide the counter-activation signals restricting the excessive inflammatory response. In our study,
however, cardiac gene expression of these cytokines did
not show significant differences among the experimental groups. Indeed, altered expression of either anti-inflammatory
cytokines or their receptor genes could not be detected in the heart after MI.
The evaluation of cardiac gene expression profile in
response to myocardial ischemic dysfunction highlighted the activation of damage-repair and remodeling processes, as
reflected by overexpression of several heat shock protein
and Toll-like receptor-related genes. In addition, our analysis revealed an increase of pro-apoptotic signaling-related genes in the healed infarcted heart in agreement with published data (31). Thus, the response to chronic ischemic insult is associated with altered repair and remodeling processes, metabolic reprogramming and enhanced apoptosis, as previously observed by others in acute MI (32).
Furthermore, we showed that immune/inflammatory
process-related gene receptors are up-regulated in the chronic infarction model, emphasizing that remodeling leading to HF is accompanied by alterations in immune-mediated processes. The importance of immune-immune-mediated
inflammation in heart disease has been demonstrated in
cardiotropic viral infections, immunization with cardiac antigens or exposure to other pathogens. Under these circumstances, cardiomyocyte injury occurs leading to cardiomyopathy, with the concomitant development of cardiac antibodies and cytotoxic T cell mediators (33-36), which are independent predictors of fatal cardiac events (37). In the present study, we demonstrated that in post-ischemic heart failure changes in the expression of cardiac genes occur along with robust and persistent cytokine and antibody systemic responses.
Although the observed alterations have been associ-ated with cardiac impairment in the setting of acute MI, our results suggest that persistence of the systemic and local
pro-immune/inflammatory repertoire may be important for
the development of post-ischemic heart failure. Future ex-periments involving knockout mice are expected to reveal a more mechanistic view of the involvement of these immune/
inflammatory processes in the cardiac remodeling leading
to heart failure after ischemia.
Acknowledgments
References
1. Volpe M, Tocci G. Integrated cardiovascular risk manage-ment for the future: lessons learned from the ASCOT trial. Aging Clin Exp Res 2005; 17: 46-53.
2. Anversa P, Li P, Zhang X, Olivetti G, Capasso JM. Ischaemic myocardial injury and ventricular remodelling. Cardiovasc Res 1993; 27: 145-157.
3. Sutton MG, Sharpe N. Left ventricular remodeling after myo-cardial infarction: pathophysiology and therapy. Circulation 2000; 101: 2981-2988.
4. Entman ML, Smith CW. Postreperfusion inflammation: a
model for reaction to injury in cardiovascular disease. Car-diovasc Res 1994; 28: 1301-1311.
5. Frangogiannis NG, Youker KA, Rossen RD, Gwechenberger M, Lindsey MH, Mendoza LH, et al. Cytokines and the mi-crocirculation in ischemia and reperfusion. J Mol Cell Cardiol 1998; 30: 2567-2576.
6. Mehta JL, Li DY. Inflammation in ischemic heart disease: re -sponse to tissue injury or a pathogenetic villain? Cardiovasc Res 1999; 43: 291-299.
7. Williams JG, Jurkovich GJ, Maier RV. Interferon-gamma: a key immunoregulatory lymphokine. J Surg Res 1993; 54: 79-93. 8. Cheng X, Liao YH, Ge H, Li B, Zhang J, Yuan J, et al. TH1/
TH2 functional imbalance after acute myocardial infarction:
coronary arterial inflammation or myocardial inflammation.
J Clin Immunol 2005; 25: 246-253.
9. Byrne CE, Fitzgerald A, Cannon CP, Fitzgerald DJ, Shields DC. Elevated white cell count in acute coronary syndromes:
relationship to variants in inflammatory and thrombotic
genes. BMC Med Genet 2004; 5: 13.
10. Torre-Amione G, Kapadia S, Benedict C, Oral H, Young JB,
Mann DL. Proinflammatory cytokine levels in patients with
depressed left ventricular ejection fraction: a report from the Studies of Left Ventricular Dysfunction (SOLVD). J Am Coll Cardiol 1996; 27: 1201-1206.
11. Frangogiannis NG, Entman ML. Chemokines in myocardial ischemia. Trends Cardiovasc Med 2005; 15: 163-169.
12. Frangogiannis NG, Smith CW, Entman ML. The inflam -matory response in myocardial infarction. Cardiovasc Res 2002; 53: 31-47.
13. Mari D, Di Berardino F, Cugno M. Chronic heart failure and the immune system. Clin Rev Allergy Immunol 2002; 23: 325-340. 14. Jahns R, Boivin V, Krapf T, Wallukat G, Boege F, Lohse MJ.
Modulation of beta1-adrenoceptor activity by domain-specif-ic antibodies and heart failure-associated autoantibodies. J Am Coll Cardiol 2000; 36: 1280-1287.
15. Gould KE, Taffet GE, Michael LH, Christie RM, Konkol DL, Pocius JS, et al. Heart failure and greater infarct expansion in middle-aged mice: a relevant model for postinfarction failure. Am J Physiol Heart Circ Physiol 2002; 282: H615-H621. 16. Gao XM, Dart AM, Dewar E, Jennings G, Du XJ. Serial
echocardiographic assessment of left ventricular dimen-sions and function after myocardial infarction in mice. Car-diovasc Res 2000; 45: 330-338.
17. Eriksson S, Halenius H, Pulkki K, Hellman J, Pettersson K. Negative interference in cardiac troponin I immunoassays by circulating troponin autoantibodies. Clin Chem 2005; 51: 839-847.
18. Nobrega A, Stransky B, Nicolas N, Coutinho A. Regeneration of natural antibody repertoire after massive ablation of
lym-phoid system: robust selection mechanisms preserve antigen
binding specificities. J Immunol 2002; 169: 2971-2978. 19. Szodoray P, Alex P, Brun JG, Centola M, Jonsson R.
Circu-lating cytokines in primary Sjogren’s syndrome determined by a multiplex cytokine array system. Scand J Immunol 2004; 59: 592-599.
20. Iacobas DA, Iacobas S, Urban-Maldonado M, Spray DC. Sensitivity of the brain transcriptome to connexin ablation. Biochim Biophys Acta 2005; 1711: 183-196.
21. Iacobas DA, Iacobas S, Li WE, Zoidl G, Dermietzel R, Spray DC. Genes controlling multiple functional pathways are transcriptionally regulated in connexin43 null mouse heart. Physiol Genomics 2005; 20: 211-223.
22. Dahlquist KD, Salomonis N, Vranizan K, Lawlor SC, Conklin BR. GenMAPP, a new tool for viewing and analyzing microarray data on biological pathways. Nat Genet 2002; 31: 19-20. 23. Doniger SW, Salomonis N, Dahlquist KD, Vranizan K, Lawlor
SC, Conklin BR. MAPPFinder: using Gene Ontology and
GenMAPP to create a global gene-expression profile from
microarray data. Genome Biol 2003; 4: R7.
24. Lange LG, Schreiner GF. Immune mechanisms of cardiac disease. N Engl J Med 1994; 330: 1129-1135.
25. Smith SC, Allen PM. The role of T cells in myosin-induced autoimmune myocarditis. Clin Immunol Immunopathol 1993; 68: 100-106.
26. Varda-Bloom N, Leor J, Ohad DG, Hasin Y, Amar M, Fixler R, et al. Cytotoxic T lymphocytes are activated following myocardial infarction and can recognize and kill healthy myocytes in vitro. J Mol Cell Cardiol 2000; 32: 2141-2149. 27. Matache C, Stefanescu M, Ivanov D, Szegli G, Popescu
P, Filip Z. Presence and significance of some antibodies/
autoantibodies in patients with acute myocardial infarction and idiopathic dilated cardiomyopathy. Roum Arch Microbiol Immunol 1992; 51: 197-203.
29. Melguizo C, Prados J, Velez C, Aranega AE, Marchal JA,
Aranega A. Clinical significance of antiheart antibodies after
myocardial infarction. Jpn Heart J 1997; 38: 779-786. 29. Hosenpud JD, Campbell SM, Mendelson DJ.
Interleukin-1-induced myocardial depression in an isolated beating heart preparation. J Heart Transplant 1989; 8: 460-464.
30. Siwik DA, Chang DL, Colucci WS. Interleukin-1beta and tumor necrosis factor-alpha decrease collagen synthesis and increase matrix metalloproteinase activity in cardiac
fibroblasts in vitro. Circ Res 2000; 86: 1259-1265. 31. Lyn D, Liu X, Bennett NA, Emmett NL. Gene expression
pro-file in mouse myocardium after ischemia. Physiol Genomics 2000; 2: 93-100.
32. Nanni L, Romualdi C, Maseri A, Lanfranchi G. Differential
gene expression profiling in genetic and multifactorial cardio -vascular diseases. J Mol Cell Cardiol 2006; 41: 934-948. 33. Alvarez FL, Neu N, Rose NR, Craig SW, Beisel KW.
Heart-specific autoantibodies induced by Coxsackievirus B3: iden
-tification of heart autoantigens. Clin Immunol Immunopathol 1987; 43: 129-139.
35. Matsumori A, Kawai C. An experimental model for conges-tive heart failure after encephalomyocarditis virus myocardi-tis in mice. Circulation 1982; 65: 1230-1235.
36. Neu N, Rose NR, Beisel KW, Herskowitz A, Gurri-Glass G, Craig SW. Cardiac myosin induces myocarditis in genetically
predisposed mice. J Immunol 1987; 139: 3630-3636. 37. Rupprecht HJ, Blankenberg S, Bickel C, Rippin G, Hafner
G, Prellwitz W, et al. Impact of viral and bacterial infectious burden on long-term prognosis in patients with coronary artery disease. Circulation 2001; 104: 25-31.
Supplementary Table 1A. Genes involved in the inflammatory/immune defense response of mice
whose absolute difference exceeds 1.5-fold but with P > 0.05.
Name Symbol X P
CD276 antigen (Cd276) Cd276 1.58 0.053
Chemokine (C-C motif) ligand 17 Ccl17 1.67 0.061
Chemokine (C-C motif) ligand 5 Ccl5 1.63 0.172
Chemokine (C-C motif) ligand 6 Ccl6 3.29 0.085
Chemokine (C-C motif) receptor 2 Ccr2 1.81 0.100 Chemokine (C-C motif) receptor-like 1 Ccrl1 2.28 0.134 Chemokine (C-X3-C motif) ligand 1 Cx3cl1 1.67 0.133 Chemokine (C-X-C motif) ligand 12, transcript variant 1 Cxcl12 -1.93 0.196 Chemokine (C-X-C motif) ligand 16 Cxcl16 1.69 0.139 Chemokine (C-X-C motif) ligand 7 Cxcl7 3.31 0.144 Chemokine-like factor superfamily 2A Cklfsf2a -1.72 0.238 Cytokine receptor-like factor 1 Crlf1 1.77 0.135
Duffy blood group Dfy 2.16 0.062
Fas (TNF receptor superfamily member) Fas 2.13 0.056 Interferon gamma inducible protein 47 Ifi47 1.53 0.179 Interferon induced 203 protein Ifi203 1.92 0.096 Interferon induced transmembrane protein 1 Ifitm1 1.77 0.146
Interferon regulatory factor 1 Irf1 1.54 0.128
Interferon-related developmental regulator 1 Ifrd1 1.83 0.106
Interleukin 1 beta Il1b 2.07 0.127
Interleukin 1 receptor accessory protein, transcript variant 1 Il1rap 1.97 0.067 Interleukin 10 receptor, alpha Il10ra 1.64 0.083 Interleukin 15 receptor, alpha chain, transcript variant 1 Il15ra 1.73 0.102
Interleukin 17 receptor Il17r 1.99 0.059
Interleukin 17 receptor B Il17rb 2.01 0.064
Interleukin 17 receptor E Il17re 3.53 0.224
Interleukin 17E Il17e -1.85 0.354
Interleukin 17F Il17f -1.50 0.428
Interleukin 18 receptor 1 Il18r1 2.31 0.097
Interleukin 2 receptor, alpha chain Il2ra 1.82 0.134
Interleukin 31 Il31 1.58 0.179
Interleukin 4 receptor, alpha, transcript variant 2 Il4ra 2.15 0.066
Lymphocyte antigen 86 Ly86 1.56 0.092
Peroxisome proliferator activated receptor gamma Pparg 2.06 0.143
Replication initiator 1 Repin1 1.72 0.095
Toll-like receptor 3 Tlr3 1.79 0.052
Tumor necrosis factor (ligand) superfamily, member 13 Tnfsf13 1.94 0.074 Tumor necrosis factor (ligand) superfamily, member 15 Tnfsf15 -1.56 0.348 Tumor necrosis factor receptor superfamily, member 23 Tnfrsf23 1.57 0.137 Tumor necrosis factor, alpha-induced protein 2 Tnfaip2 1.60 0.052 Tumor necrosis factor, alpha-induced protein 8-like 2 Tnfaip8l2 1.86 0.140 Uveal autoantigen with coiled-coil domains and ankyrin repeats Uaca 1.58 0.074
Supplementary Table 1B. Non-regulated genes involved in the inflammatory/immune defense response of mice.
Name Symbol X P Name Symbol X P
Allograft inflammatory factor 1 Aif1 1.36 0.152 Interferon, alpha-inducible protein G1p2 -1.17 0.518
Arachidonate 5-lipoxygenase Alox5 1.28 0.494 Interferon, alpha-inducible protein 27 Ifi27 -1.07 0.750 Attractin Atrn -1.11 0.475 Interferon-activatable protein 203 N/A 1.08 0.715 CD180antigen Cd180 1.18 0.252 Interferon-induced protein 44 Ifi44 -1.21 0.431 Chemokine ligand 12 Ccl12 -1.07 0.803 Interferon-induced protein with tetratricopeptide repeats 1 Ifit1 1.04 0.868 Chemokine ligand 2 Ccl2 1.03 0.882 Interferon-induced protein with tetratricopeptide repeats 2 Ifit2 1.28 0.332 Chemokine ligand 22 Ccl22 -1.13 0.715 Interferon-induced protein with tetratricopeptide repeats 3 Ifit3 -1.02 0.862 Chemokine ligand 24 Ccl24 1.09 0.678 Interferon-lambda2 Ifnl2 -1.46 0.047 Chemokine ligand 25 CcI25 1.25 0.126 Interferon-related developmental regulator 2 Ifrd2 1.21 0.312 Chemokine ligand 3 Ccl3 1.03 0.959 Interleukin 1 receptor-like 1, transcript variant 1 Il1rl1 1.30 0.329
Chemokine receptor 5 Ccr5 1.31 0.163 Interleukin 10 Il10 1.18 0.720
Chemokine receptor-like 2 Ccrl2 1.10 0.639 Interleukin 10 receptor, beta Il10rb 1.34 0.211 Chemokine ligand 1 Cxcl1 1.42 0.282 Interleukin 12b Il12b 1.24 0.507
Chemokine ligand 4 Cxcl4 1.30 0.252 Interleukin 15 Il15 1.23 0.239
Chemokine ligand 9 Cxcl9 1.00 0.990 Interleukin 16 Il16 1.49 0.048
Chemokine receptor 4 Cxcr4 1.49 0.079 Interleukin 17 Il17 1.14 0.720 Chemokine receptor 6 Cxcr6 -1.42 0.407 Interleukin 17 receptor c Il17rc 1.50 0.015 Chemokine binding protein 2 Ccbp2 1.29 0.272 Interleukin 17 receptor d Il17rd 1.13 0.704 Chemokine-like factor 5, complete cds CKLF5 1.02 0.915 Interleukin 17d Il17d 1.02 0.851 Chemokine-like factor superfamily 2B Cklfsf2b 1.31 0.170 Interleukin 18 Il18 1.46 0.124 Chemokine-like factor superfamily 3 Cklfsf3 1.31 0.066 Interleukin 18 binding protein Il18bp 1.36 0.171 Chemokine-like factor superfamily 4 Cklfsf4 1.22 0.292 Interleukin 21 N/A 1.28 0.391 Chemokine-like factor superfamily 5 Cklfsf5 -1.28 0.577 Interleukin 21 receptor Il21r 1.20 0.549 Chemokine-like factor superfamily 6 Cklfsf6 1.49 0.072 Interleukin 4 induced 1 Il4i1 -1.45 0.217 Chemokine-like factor superfamily 7 Cklfsf7 1.19 0.018 Interleukin 6 receptor, alpha Il6ra 1.46 0.220 Chemokine-like factor superfamily 8 Cklfsf8 -1.01 0.924 Interleukin 7 II7 1.29 0.174 Chemokine-like factor, transcript variant 1 Cklf 1.22 0.305 Interleukin 7 receptor Il7r -1.50 0.724 Chitinase 3-like 4 Chi3l4 1.06 0.808 Interleukin enhancer binding factor 3 Ilf3 1.36 0.134 Cytokine induced apoptosis inhibitor 1 Ciapin1 1.25 0.231 Interleukin-1 receptor associated kinase 1 splice form 1 Irak1 1.37 0.055 Cytokine inducible SH2-containing protein Cish -1.02 0.921 Interleukin-1 receptor-associated kinase 1 binding protein 1 Iraklbp1 1.06 0.830 Cytokine-like 1 Cyt1 1.37 0.039 Myeloid differentiation primary response gene 88 Myd88 -1.01 0.916 Cytokine receptor-like factor 3 Crlf3 1.21 0.521 Pyd and card domain containing Pycard -1.04 0.806 Endothelial differentiation, sphingolipid
G-protein-coupled receptor, 3 Edg3 1.49 0.175 Regenerating islet-derived 3 gamma Reg3g 1.33 0.299 Hemolytic complement Hc 1.14 0.558 Signal transducer and activator of transcription 5b Stat5b 1.21 0.385 Interferon receptor 2 Ifnar2 1.20 0.347 Tachykinin 1 Tac1 1.08 0.839 Interferon-activated gene 203 Ifi203 1.17 0.195 Toll-like receptor 1 Tlr1 -1.31 0.316 Interferon alpha responsive gene Ifrg15 1.25 0.487 Toll-like receptor 9 Tlr9 1.32 0.096 Interferon-dependent positive acting transcription
factor 3 gamma Isgf3g -1.22 0.821 Transforming growth factor, beta 1 Tgfb1 1.35 0.062 Interferon gamma-induced gtpase Igtp 1.20 0.292 Tumor necrosis factor superfamily, member 12 Tnfsf12 1.43 0.099 Interferon gamma-inducible protein 30 Ifi30 1.18 0.517 Tumor necrosis factor superfamily, member 13b Tnfsf13b 1.32 0.385 Interferon-induced transmembrane protein 2 Ifitm2 1.29 0.051 Tumor necrosis factor superfamily, member 9 Tnfsf9 1.38 0.353 Interferon-induced transmembrane protein 3 Ifitm3 -1.12 0.301 Tumor necrosis factor receptor superfamily, member 19 Tnfrsf19 1.24 0.191 Interferon-inducible gtpase 2 Iigp2 1.32 0.123 Tumor necrosis factor receptor superfamily, member 21 Tnfrsf21 1.29 0.392 Interferon-inducible gtpase family member 5 ligp5 -1.02 0.936 Tumor necrosis factor receptor superfamily, member 4 Tnfrsf4 1.02 0.914 Interferon regulatory factor 2 Irf2 1.31 0.219 Tumor necrosis factor receptor superfamily, member 5 Tnfrsf5 1.28 0.035 Interferon regulatory factor 2 binding protein 1 Irf2bp1 1.01 0.956 Tumor necrosis factor receptor superfamily, member 9 Tnfrsf9 -1.11 0.724 Interferon regulatory factor 2 binding protein 2 Irf2bp2 1.12 0.682 Tumor necrosis factor superfamily, member 5-induced protein 1 Tnfsf5ip1 1.26 0.155 Interferon regulatory factor 5 Irf5 1.35 0.194 Tumor necrosis factor, alpha-induced protein 1 Tnfaip1 1.31 0.037 Interferon regulatory factor 6, transcript variant 1 Irf6 -1.14 0.732 Tumor necrosis factor, alpha-induced protein 3 Tnfaip3 1.43 0.152 Interferon regulatory factor 7 Irf7 -1.03 0.875 Tumor necrosis factor, alpha-induced protein 8 Tnfaip8 1.19 0.197 Interferon stimulated exonuclease gene 20-like 1 Isg20l1 1.22 0.414 Tumor necrosis factor, alpha-induced protein 8-like 1 Tnfaip8l1 1.19 0.409